DEVELOPMENT OF A SPATIAL INFORMATION CONSULTING METHOD FOR
MERGED LOCAL GOVERNMENTS
Naoya Okua, *, Mayumi Mizobuchi a, Atsushi Hatta a
a
Kokusai kogyo Co., Ltd., 1-1-15, Nishinagasu-cho, Amagasaki, Hyogo, 660-0805, JAPAN (naoya_oku, mayumi_mizobuchi, atsushi_hatta)@kk-grp.jp
Commission VI, WG Ⅳ/1: Geospatial Data Infrastructure
KEY WORDS: GIS , Consulting , Method , cost ,data , systems , management
ABSTRACT:
In Japan, the merger of local governments is progressing. Since a digital divide may exist between local governments before merging, however, the merger may increase the gap through presenting the contrast and may provide trouble for equitably providing citizen services that the merger should aim for. To solve this problem, we developed a spatial information consulting method for merged local governments. The method can be classified into four phases according to its execution steps. The four phases are “gap analysis” that compares the current state of merging local governments (As-Is) against the ideal state (To-Be),”Scenario analysis” that shows how to realize To-Be against current issues that have been defined through gap analysis, “Cost-benefit analysis” that calculate costs and benefits to verify the feasibility of the analysis-based scenario, and “Roadmap formulation” that reflect the results obtained by the analysis over a yearly schedule table. In result, we have achieved the appropriate planning to integrate data and system for merged local governments, and be introduced in a packaged framework to other local governments that have similar issues.
* Corresponding author.
1. Introduction
1.1 Local government mergers
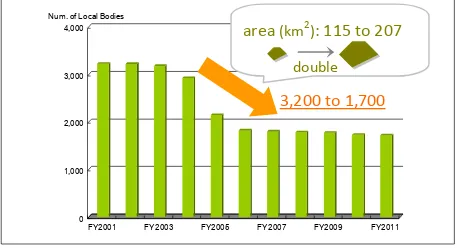
Local government mergers, known as “Large Heisei Mergers,” were conducted in Japan between 1999 and 2006. These mergers reduced the number of local governments to 1,700, almost half the figure prior to 2005. Conversely, the average city area nearly doubled (Figure 1). “Large Heisei Mergers” are expected to enhance the financial bases of local governments and improve citizen services by offering such services equitably at head and branch offices.
Figure 1 The no. of local gov. after “Large Heisei Mergers”
1.2 The need for spatial information to be integrated
The merger of local governments also had a substantial impact on the field of spatial information. In the course of local government activities, numerous maps are used in a variety of fields, including the management of infrastructure related to roads, water and sewerage, as well as the management of citizen information. Offering citizen services using maps such as these equitably to all post-merger jurisdictional areas necessitates the creation of maps of all areas integrated via merger (Figure 2).
Figure 2. The merger of local governments
However, pre-merger maps used by local governments include paper maps as well as digital ones. Also, the precision of digital maps varies, depending on the contexts in which they were prepared. Accordingly, integrating these maps requires surveying, analysis and planning, with a view to overall optimization.Furthermore, local governments vary in the degree to which they used digital maps to offer services prior to merger. Even when such systems were introduced, they often have different background map data and system functions. Rather than offering merger advantages, this information gap (digital divide) between local governments’ pre-merger data and systems can result in problems in a merger. Benefiting from a merger therefore requires a consulting method that addresses the question of how to overcome the digital divide.
1.3 Existing research on local governments’ GIS
Individual special divisions of local governments having their own geographic information system (GIS) have been already addressed, and the effects of helping to make routine work more efficient and supporting planning have been anticipated (A. Haque, 2001). The Ministry of Internal Affairs and Communications has also promoted the use of an integrated GIS as a “system (mechanism) for sharing information prepared by different divisions and using it cross-sectionally in the agency” (Ministry of Internal Affairs and Communications of Japan, A 0
1,000 2,000 3,000 4,000
FY2001 FY2003 FY2005 FY2007 FY2009 FY2011 Num. of Local Bodies
3,200 to 1,700
area (km2): 115 to 207
double
After merger Before merger
new city International Archives of the Photogrammetry, Remote Sensing and Spatial Information Sciences, Volume XXXIX-B4, 2012
Guideline for proceeding the Integrated GIS, 2008). On this basis, questionnaires, interviews and other surveys of agency divisions have also been conducted (Aoki, 2006). However, existing research only presented the results of analysis; no research extended to putting in place solutions based on survey results. There also exists little research that takes local government mergers as a turning point.
On the other hand, a wide range of research, including (C. M. Pereira, 2004) and (T. Dewett, G. R. Jones, 2001), applies frameworks in the field of IT consulting. However, as the creation of mapping data is considered important in the field of spatial information, this field differs from IT consulting in the sense that it involves a proposal of method and putting this method into practice. As creation of base map is a major premise in the field of spatial information, first it is essential to provide consulting that achieves.
2. Consulting method
This research describes a consulting method in the field of spatial information for merged local governments. As the issue is the merger of local governments, map digitization and system construction are not carried out for specific agency divisions. Rather, such activities must be conducted from the viewpoint of an optimal overall solution. This requires the analysis of all current conditions in each division, the setting of goals for the merged local government entity, and a framework for reaching these objectives. The consulting method, as a framework, described in this research can be used consistently across local governments and in as many instances as possible. The hypothesis is that even though local governments confront different circumstances, the states they aim to achieve are essentially the same. This hypothesis is used to lead them to best practice.
The consulting method was divided into four phases (Figure 3). Conducting each phase step by step allows current conditions to be analyzed, a solution to be determined, and the merged local government to achieve its target state. Each phase employs our original appropriate analysis tools. To solve issues concerning mergers, not only creation of data but also establishing of system and management should be required. In short, under this method three elements are important: the data, the system and management.
Figure 3. Consulting framework
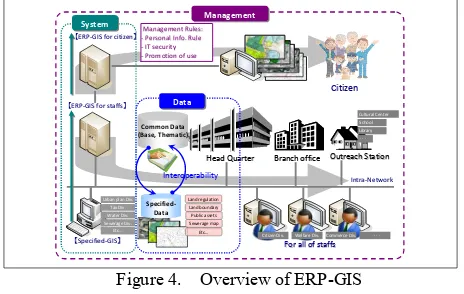
Figure 4 shows ideal state which has been obtained through this research and analysis. That is, creating base map for the whole area, constructing system for the whole agency, and visualizing and disclosing regional information to citizens, proposing a future plan based on quantitative evidences for region’s decision-making. In this research, a GIS that realizes this ideal state is called a “Enterprise Resource Planning GIS” (hereinafter referred to as “ERP-GIS”).
Figure 4. Overview of ERP-GIS
3. Implementation of consulting method
This chapter describes the four phases of this consulting method that were developed. The city of Nagahama, Shiga Prefecture, is selected as a model case.
3.1 Gap analysis (phase 1)
3.1.1 Outline
In phase 1, the current conditions are analyzed. That is, an analysis is conducted that compares the current state of merging local governments (As-Is) against the ideal state (To-Be).In this method, the To-Be state means that digital base maps of the whole area have been created, a system equipped with editing and viewing functions that can be used anywhere—not only at head but branch offices—is in sustainable management, and finally, citizens can be provided administrative services equitably.
Current conditions (As-Is), however, assume various conditions as described above. For example, some branch offices have digital maps but others have paper maps. The systems in each branch have different specifications, and sometimes those of systems have not been used. Personnel from pre-merger bodies have differing levels of IT skills. Under such conditions, the administrative services offered by branch offices might be differentiated. In phase 1, the gap between To-Be and As-Is is defined.
3.1.2 Questionnaire and interview
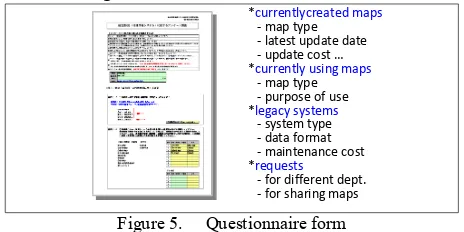
Questionnaires and interviews are the analysis tools used to provide a detailed understanding of current conditions. Although very typical of current condition analysis methods, entries in the questionnaire survey are specialized for spatial information. Not only is the possession of maps and systems at all divisions in the agency known; how they are used is also understood. This survey result is important for supporting subsequent analysis (Figure 5). From a technical standpoint in particular, the focus is on the method of creating maps so far, rather, on how maps are used in this approach in terms of cost effectiveness. To meet additional needs that cannot be
【 【ERPERP--GIS for staffs】GIS for staffs】
Common Data (Base, Thematic)
For all of staffs
For all of staffs
System
Citizen Div. Welfare Div.Commerce Div. ・・・
Specified-Data
【 【SpecifiedSpecified--GISGIS】】
Interoperability
Head Quarter
Head Quarter Branch officeBranch office Outreach StationOutreach Station Intra
Intra--NetworkNetwork
Management
ManagementRules:Rules:
--Personal Info. RulePersonal Info. Rule
--IT securityIT security
--Promotion of usePromotion of use
Management
Phase 1 : Gap Analysis
Phase 2 : Scenario Analysis
Phase 3 : Cost-Benefit Analysis
Phase 4 : Roadmap Consensus
Complete digital base maps, data interoperability
Complete digital base maps, data interoperability
ERP-GIS for every staffs on their desks
ERP-GIS for every staffs on their desks
Practical operation
Mixed digital / paper maps, overlapping
creation
Mixed digital / paper maps, overlapping
- Trial GIS (option)
- GIS training (option) Tools: - Questionnaire form - Interview form - Trial GIS (option) - GIS training (option)
Decide priority for data creation
Decide priority for data creation
Make position of specified-GIS
Make position of specified-GIS - Specified-GIS decision flow Tools:
- Needs-Cost Chart - Priority lists - Specified-GIS decision flow
Cost comparison between legacy ways
and data-sharing
Cost comparison between legacy ways
and data-sharing between as-is and work with ERP-GIS
Cost comparison between as-is and work with ERP-GIS
Data SystemSystem ManagementManagement
to be
understood from questionnaire survey results, divisions that voice a large number of opinions are visited directly to conduct an interviewing.
Figure 5. Questionnaire form
3.1.3 GIS training and trial GIS
Another point is the provision of a GIS training and the introduction of a trial GIS prior to the questionnaire and interview (Figure 6). In the GIS training taking place approximately three times during a day in a conference room, domestic and international trends are introduced in addition to the mechanisms of digital maps and the advantages of using a GIS. Explanations are provided at two levels: for beginners and for advanced participants. Trial GIS aims to foster an understanding of items that are difficult to explain in a training course and to uncover potential needs through the hands-on use of a GIS.
Many personnel have little knowledge about GIS. Conducting GIS-related questionnaire under these conditions is unlikely to uncover potential needs. Accordingly, this approach aims to lead participants to the To-Be condition via the shortest path, determining issues with current conditions after they have understood the advantages of a GIS. Although its primary purpose is to provide a preliminary survey for subsequent analysis, this also promotes a more thorough understanding of a GIS and is a first step toward To-Be.
Figure 6. GIS training
An interesting example of the results of analysis is introduced below. The following figures show the state of use of maps. Figure 7 shows the usefulness of mapping in administrative services. Meanwhile, Figure 8 shows that present map reliability is low because maps are not updated, that the use of paper maps means that preparing data is time-consuming, and that personnel worry about dealing with inquiries from citizens.
Figure 7. The current status of use of maps
Figure 8. The problem of use of maps
3.2 Scenario analysis (phase 2)
3.2.1 Outline
In phase 2, a scenario is developed showing how to realize To-Be against current issues that have been defined through gap analysis. The scenarios are covering an integration of base maps and a direction of existing legacy systems. Carrying out these activities results in the overall optimization of administrative works. Figure 9 shows items to be considered, based on the issues through gap analysis.
Figure 9. Problems and Solutions
3.2.2 Plan for integration of base maps
For the most fundamental base maps, an optimal plan for creating and integrating maps is drawn up based on the current conditions for each former area (digital or paper format, creating method, required scale, update year, etc.). At the same time, those maps’ precision must meet the Japan’s legal requirements such as 1/600 or larger for a sewerage map.
It would be simple if all maps of the whole area could be created anew in the digital format, but the cost would be enormous. Therefore, where digital maps are used they are revised, and where only paper maps are used, existing paper maps are digitized. The necessary scale is set by area (city area and mountainous area), and maps are to be in a puzzle-like manner as shown in Figure 10. As the necessary scale is directly related to the execution of administrative work, creating method is decided together with personnel, using Figure 10.
Figure 10. Cost-effective base map integration plan
*currentlycreated maps
- map type - latest update date - update cost … *currently using maps
- map type - purpose of use *legacy systems
- system type - data format - maintenance cost *requests
- for different dept. - for sharing maps
③月に1回程度使う , 1 8部署, 2 5.4 %
②週に1回程度使う,
1 4部署, 19 .7 % ④年に1回程度使う,
2部署, 2. 8%
⑤ほとんど使わない,
6部署, 8 .5 %
①ほぼ 毎日使う, 31 部署, 43. 7%
Use everyday 31 div, 43.7%
Use once a week 14 div,19.7% Use once a month
18 div,25.4% Use once a year
2div,2.8% No use 6div,8.5%
③月に1回程度使う , 1 8部署, 2 5.4 %
②週に1回程度使う,
1 4部署, 19 .7 % ④年に1回程度使う,
2部署, 2. 8%
⑤ほとんど使わない,
6部署, 8 .5 %
①ほぼ 毎日使う, 31 部署, 43. 7%
Use everyday 31 div, 43.7%
Use once a week 14 div,19.7% Use once a month
18 div,25.4% Use once a year
2div,2.8% No use 6div,8.5%
1 9 5
1 4 2 5
4 7
0 5 1 0 1 5 2 0 2 5 3 0 3 5 4 0 4 5 5 0
(部署) その他
全域の地図がな い 場所の検索に時間がかかる 紙地図である ため加工に時間がかかる 地図が現状と一致していない
No. of Div. Maps not describe real world
Take much time to process because of paper maps
Take much time to find places
No maps with complete merger area
Misc.
P
ro
b
le
m
s
S
o
lu
tio
n
s
Problems from “merger” Problems from “daily works”
Each branch has it’s own GIS with
non-standard specs.
Each branch has it’s own GIS with
non-standard specs.
Thematic maps situation varied in
each branch
Thematic maps situation varied in each branch
Maps not describe real world
Maps not describe real world
Maps not updated
Maps not updated
Willing to use maps owned by other sections
Willing to use maps owned by other sections
Many inquiries
Many inquiries
Do not have completely covered
base maps
Do not have completely covered
base maps
Create a plan for initial development / update of
complete base maps
Create a plan for initial development / update of complete base maps
Create a policy for “specified-GIS”
Create a policy for “specified-GIS”
Create a plan for initial development / update of
each thematic maps
Create a plan for initial development / update of
each thematic maps
Create an operation system
Create an operation system
Development of ERP-GIS
Development of ERP-GIS Do not have GIS, and use still paper maps
Do not have GIS, and use still paper maps
Learning GIS framework and concept
Practical GIS training
To be updated, Lv.2500
To be newly mapped, Lv.2500
To be updated, Lv.5000
To be newly mapped, Lv.5000 International Archives of the Photogrammetry, Remote Sensing and Spatial Information Sciences, Volume XXXIX-B4, 2012
3.2.3 Plan for updating base maps
Plans to update base maps are also considered as same as an initial plan discussed above. As the questionnaire survey for gap analysis shows, digital maps that are not updated become difficult to use. To prevent this situation, a mechanism for continuously updating these maps should be established. Updating all such maps every year, however, can be quite expensive. An optimal update method can be achieved by balancing needs with costs. Figure 11 shows this method with four classifications. Since Japanese law requires that aerial photographs for fixed assets be taken on a cycle of three years or more, and that base maps for urban planning work be updated on a cycle of five years or more, these conditions should be satisfied.
Figure 11. Needs-Costs chart
3.2.4 Plan for creating and integrating common thematic map
Not only is a GIS useful in creating base maps of the whole area; it also adds on them urban planning information, land boundary, and infrastructure / utility information like water and sewerage. This information can be effectively used for various works. In many cases, data can be shared among divisions.
Based on questionnaire results, various thematic maps is scored on the basis of whether it has been digitized, and other divisions require. Data ranked a higher priority is loaded onto the ERP-GIS. This promotes effectiveness of the ERP-GIS from the beginning. Table 1 shows an example in which common thematic map is classified into four groups, from priority A to D.
priority description content example
A Digital data and already used in some projects with GIS.
-Zoning and regulation -Cadastre
-Community area -Public facility
B Currently paper based, but high-need in several projects.
-Road and network map -Land boundary -Agricultural regulation
C Currently not decided data creation or integration policy
-Water facility map -Sewerage facility map -Building certification
D Create digital map in individual projects -Archaeological site -Environmental regulation
Table 1. Priority of common thematic maps
3.2.5 Plan for system integration
A web-type is employed, that are used widely among agency personnel, for GIS. When selecting the functions for ERP-GIS, rather than looking around conventional customized ways, a request for information (RFI) is adopted in terms of cost effectiveness and the market average.
As ERP-GIS can view whole-area maps for every personnel, legacy individual work specified-GIS should be reconsidered for an integration strategy. By inquiring again about the necessity of each system, about whether a new system can satisfy the needs of the legacy systems, and the systems have been managed effectively, reconsideration can result in an optimum system and contribute to cost savings. The decision flow in Figure 12 is used for analysis.
Figure 12. Decision flow for specified-GIS
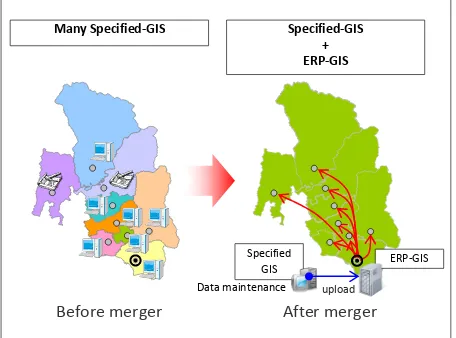
One example in which the decision flow was used showed that although the legacy systems had specialized functions such as data edit and analysis, they were not used frequently. This tendency was particularly noticeable at branch offices. This indicates that the system exceeded actual requirements. Those too advanced functions were required before merger. However, since roles of branches have been changed after merger, personnel have transferred, or operational support has not been insufficient, the system with much functions have become useless. In such cases, an interoperable method is effective that shares work between the head and branch offices by using the specified-GIS in combination with ERP-GIS (Figure 13).
Figure 13. Combination of specified-GIS and ERP-GIS
3.3 Cost-benefit analysis (phase 3)
3.3.1 Outline
In this phase, costs and benefits are calculated to verify the feasibility of the analysis-based scenario. The costs consisted with initial of integrating maps and systems, and updating maps and maintaining systems. This approach allows a comparison of the cost-saving effects of eliminating paper maps and specified- GIS, as well as of reduced working hours. This analysis offers a long-term estimate of subsequent management and provides an understanding of cost-recovery timing. Then, the results of analysis also help to promote personnel to use. There are also some effects not expressed in quantitative way. These include improvements in citizen services, closing the information gap, and others. Effects that can be expressed numerically are called quantitative effects, and those effects that have a potential to spread are qualitative effects; these are described below.
3.3.2 Quantitative effects
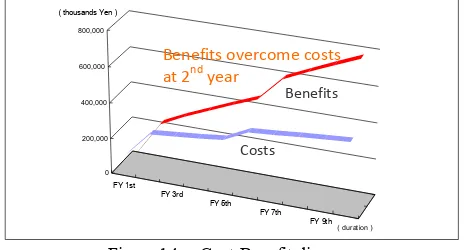
Figure 14 shows quantitative effects. The blue line indicates costs. These include the map creation, the construction of systems and the procurement of hardware. Major expenses are incurred in the first year, with annual maintenance occurring
aerial photo
aerial photo
Land boundary
Land boundary
road road
building building
small object
small object
annotation annotation
contour contour
vegetation vegetation
Update frequently, update by partially
U
p
d
a
te
F
re
q
u
e
n
c
y
Update Cost low
high high
low
Update not frequently, update by partially
Update frequently, update by completely
Update not frequently, update by completely
Legacy Specified-GIS
Any work-specific function?
Necessary such function as well?
Integrate to ERP-GIS
Easy to migrate data?
Keep specified-GIS
Willing to have Specified-GIS
Necessary work-specific function? No
Yes
Yes
No No
Yes
Develop specified-GIS
No
Yes
After merger Before merger
Data maintenance
ERP-GIS
upload Specified
GIS
Specified-GIS + ERP-GIS Many Specified-GIS
thereafter. The red line indicates benefits. As described above, these include the elimination of legacy specified-GIS and the future suppression effect, as ERP-GIS is introduced. Working hours are expressed as labor costs, and reflect the reduction in working hours using maps—obtained through questionnaire analysis. The graph shows that an effect becomes apparent in the second year. That the “effect of improvement of working hours is obtained by the introduction of a GIS” has long been discussed; this graph method verifies the effect visually.
Figure 14. Cost-Benefit diagram
3.3.3 Qualitative effects
Qualitative effects are described next. Figure 15 shows statistical data from local governments in Japan and shows fields in which GIS have been introduced. The largest effects are in the field of fixed asset tax. This is followed by the fields of urban planning, road, agriculture and forestry, water and sewerage. These results show the leading role that GIS play in fields involving civil engineering, where GIS are most commonplace. The graph also implicates a wide spread of application fields. It is anticipated that taking a merger as the turning point for introducing ERP-GIS can improve awareness within the agency. This approach is expected to overcome gaps between fields, as well as between branch offices.
(see. reference of MIAC)
Figure 15. GIS-used fields in local gov.
For example, Nagahama city which have merged and introduced ERP-GIS, some ripple effects have been achieved during the first year. In particular, these effects were evident following the Great East Japan Earthquake in the welfare field, where GIS had not been used extensively. That is, support for people in need of backup during disaster evacuation. GIS are used to assist the evacuation of people for whom self-evacuation is problematic, such as aged people who live alone and aged married couples. This can be understood visually by using GIS to map residential
status. Overlaying this information onto aerial photographs and hazard maps makes it possible to analyze how many people requiring assistance live in dangerous areas. As many related divisions, such as welfare, crisis management, citizen, and civil engineering divisions, need to share information at disaster, an ERP-GIS is effective.
This example shows the recognition of whole area map and the ERP-GIS rising in only one year in fields where GIS were not used previously. Also, citizen services were provided at a lower cost and higher level.
3.4 Roadmap formulation (phase 4)
3.4.1 Outline
In the last phase, the results obtained by the analysis are reflected over a long time span of approximately 10 years. The three viewpoints: data, system and management, are here to be important, again. In terms of data, for example, an optimal update cycle of each feature, and creating priorities for thematic maps have to be scheduled. Also trainings for system, assessment for management should be scheduled.
The schedule which reflected all of those elements shows what expenses will be incurred and when. In many cases, GIS that have been introduced cannot be kept running and fall into disuse. Planning a schedule makes it possible to check the current status several years after introduction.
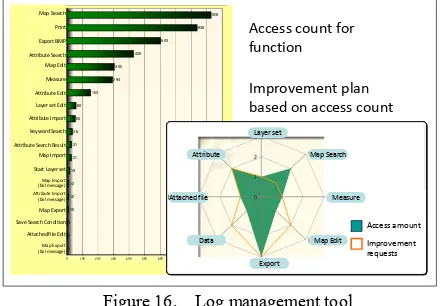
A good schedule is useless, however, if it is not executed. Assessment that can monitor the schedule periodically should support it. Assessment allows the course to be corrected if it deviates from the schedule planned for realizing the To-Be state.A schedule table and a log management tool supporting assessment are described in detail below.
3.4.2 Yearly schedule table
A yearly schedule table, which has data, system and management elements in vertical axis, initial and upgrading / maintenance periods in horizontal axis, arranges items determined by analysis (Table 2). This is the roadmap of executing ERP-GIS.
Table 2. Yearly schedule
3.4.3 Log management tool
The ERP-GIS employs a log management tool that records the
Benefits overcome costs
at 2nd year
Upgrading / Maintenance Period
●
- ASP / Cloud service
●
- Basic design
5. ERP-GIS for citizen
●
- Hardware procurement / lease
●
- Software procurement / lease
● - Create thematic maps
3. Thematic maps
● ●
- Update base maps
● ●
- Create digital base maps
● ● ● ●
- Create aerial / ortho photo
●
items Upgrading / Maintenance Period
●
- ASP / Cloud service
●
- Basic design
5. ERP-GIS for citizen
●
- Hardware procurement / lease
●
- Software procurement / lease
● - Create thematic maps
3. Thematic maps
● ●
- Update base maps
● ●
- Create digital base maps
● ● ● ●
- Create aerial / ortho photo
●
Step-by-step creation by each section’s intent
Setup base maps after creation / update
Setup thematic maps after creation / update
Management Guideline by 2ndyear, and apply assessment in every 3 years
Aerial / ortho photo creation in every 3 years, and update digital base maps in every 6 years
Gradual creation and update
Development on 1styear, and gradual data setup
Development on 2ndyear,
and gradual data setup
frequently and not. Individual training and consultation can be provided for divisions whose accesses are particularly infrequent. This approach helps to overcome information gaps.
Figure 16. Log management tool
4. Results of study and discussion
As described above, a consulting method which achieves development of persuasive ERP-GIS plan for merged local governments is established. This research puts emphasis on the following three points. First, this method is the “packaged framework” including four step-by-step phases: current analysis, improvement scenario, cost analysis and roadmap formulation. Second, because of having divided four phases, so that there is an advantage to be able to apply selected phases depending on local governments’ budgetary or other considerations.
Table 3 shows achievements and conditions for each phase.
Menu Type menu achievement condition
A No-consultation
Develop ERP-GIS without any analysis and planning Priority setting, GIS integration planning difficult to evaluate validity. D Gap,
Scenario and C/B Analysis
Analysis of quantitative and qualitative effect
Make persuasive budget plan
Difficult to involve flexibility and manage plan in long-term.
E Complete consultation
Roadmap planning, Log analysis
Equalize costs, monitor performance of plan
See “5. Conclusion.”
Table 3. Comparison of consultation menu
In case of type A: “no-consultation”, development of ERP-GIS is executed without cost calculation and problem findings, then this might be resulted in data and system duplication. Type B: gap analysis can find out current issues, but not solutions. Type C: B plus scenario analysis can present solutions, but face difficulty to evaluate its validity because there’s no evidence. Type D: C plus cost-benefit analysis can make persuasive budget plan, but face difficulty to modify plans flexibly in long-term. Type E: complete consultation can be effective in terms of not only making ERP-GIS plan but executing its plan certainly with monitoring progress and performance. This leads an equalization of total costs, and then achieves sustainable maps and system management with sound financial condition.
Finally, the consulting method can be introduced as a packaged framework to other local governments that have similar issues. As already described in 1.2, most cases of merged local governments tend to face a digital divide among pre-merger bodies. For those cases, this paper proposes setting the “To-Be” goal shown in Figure 4, and leads there whatever any current situation.
5. Conclusion
The “Large Heisei Mergers” constituted a turning point in Japan that highlighted many needs for the creation of areawide maps and the integration of GIS. The spatial information consulting method of this research was developed in response to this demand. Our focus is on integrating maps and systems, and making “daily” works efficient, enriching services for citizen.
This research, however, has not discussed “data storing system”, which has been increased its importance. During the Great East Japan Earthquake, in some cases city offices were swept away and all administrative maps were lost. This situation highlighted the need to convert paper maps to copiable digital data and storing this data over a wide and distributed area. This approach is not entirely unrelated to the trend toward cloud computing.
At present, such data still tends to be stored in the central server room of the head office of a merged local government. However, they have got wide administrative area, so that enough to store their map assets at distributed sites within their area. Moreover, we keep focus on not only approach to store data over wide area, but also to continue providing services by switching the role of head and branch office flexibly in emergencies. Further research is required to ensure that GIS can handle the task of providing services equitably anywhere and as usual, even in emergencies.
ACKNOWLEDGMENT
In preparing this paper, we used documents and data provided by the Nagahama City Government as examples. We express our thanks to the Nagahama City and the staffs cooperated.
REFERENCES
Aoki, K., 2006. A survey on the use of integrated GIS in local government departments without map-drawing management,
Theory and Applications of GIS, Vol. 14, No. 2, pp. 97-105. Dewett, T., Jones, G. R., 2001. The role of information technology in the organization:a review, model, and assessment,
Journal of Management, Vol. 27, No. 3, pp. 313-346.
Haque, A., 2001. GIS, Public Service, and the Issue of Democratic Governance, Public Administration Review, Vol. 61, Issue 3, pp. 259-265.
Ministry of Internal Affairs and Communications of Japan (MIAC), 2008. A Guideline for proceeding the Integrated GIS. Nagahama city, 2011. The master plan for development of integrated-GIS in Nagahama city.
Pereira, C. M., Sousa, P., 2004. A method to define an Enterprise Architecture using the Zachman Framework,
Proceedings of the 2004 ACM symposium on Applied computing, pp. 1366-1371
Access count for function
Improvement plan based on access count
1