Comparison of grassland management systems for beef cattle
using self-contained farmlets: effects of contrasting nitrogen
inputs and management strategies on nitrogen budgets, and
herbage and animal production
J.A. Laws
∗, B.F. Pain, S.C. Jarvis, D. Scholefield
Institute of Grassland and Environmental Research, North Wyke, Okehampton, Devon EX20 2SB, UK
Received 24 December 1998; received in revised form 9 February 2000; accepted 22 February 2000
Abstract
Past research on nitrogen (N) inputs, losses and surpluses focused on separate components of grassland management, i.e., grazed or cut swards and the impact of fertiliser or slurry applications. In practice, however, grassland is both grazed and cut for conservation, and N fertiliser is supplied from both organic and inorganic sources. A whole systems approach was used to evaluate the effects of combinations of management strategies designed to reduce N losses on N budgets, and herbage and animal production in South West England. Three systems with contrasting N inputs were compared: CN, conventional mineral N application and broadcast slurry; TN, tactical mineral N application with slurry injection and the early housing of cattle; GC, a mixed grass/white clover sward with no mineral N addition and slurry injection. Comparisons were made on two contrasting soil types: a freely-draining sandy loam (Gleysol, Site 1), and a poorly drained clay (Luvisol, Site 2). 1 ha farmlets were grazed to a target sward height by beef cattle for a 5-year (Site 1) or a 4-year (Site 2) period. Herbage surplus to grazing requirements was cut for silage. On average, 185 kg N ha−1was applied annually to treatment TN compared with 280 kg N ha−1for CN. An
additional 76, 102 and 67 kg N ha−1was applied in slurry to treatments CN, TN and GC, respectively. Substantial reductions
in N surpluses were achieved for both treatments TN and GC compared with treatment CN (N surpluses ha−1: 254, 168 and
119 kg at Site 1, and 247 kg, 190 and 73 kg at Site 2, for CN, TN and GC, respectively). The highest N input for treatment CN was associated with the greatest animal and herbage production. More land was required for grazing on treatment GC and less herbage was cut for silage so that self-sufficiency was not attained for winter fodder on this treatment. The early removal of cattle on treatment TN did not result in a significant increase in the amount of herbage cut for silage. It was concluded that the combinations of mitigation options used were successful in reducing N surpluses compared with the conventional N management system, but animal and herbage production was reduced. © 2000 Elsevier Science B.V. All rights reserved.
Keywords:Farmlets; Systems; Beef cattle; Nitrogen; Nitrogen budgets; Slurry; Herbage production; Animal production; UK
∗Corresponding author. Tel.:+44-1837-82558;
fax:+44-1837-82139.
E-mail address:[email protected] (J.A. Laws)
1. Introduction
Grassland farms in the UK are a major source of diffuse nitrogen (N) pollution. In intensively man-aged, slurry-based livestock systems, N inputs exceed N outputs in animal products and a substantial
proportion of the surplus is lost to the wider envi-ronment. Concerns over concentrations of nitrates in drinking water have prompted legislation in the form of the Nitrate Directive 91/676/EEC which enforces standards on water quality in nitrate vulnerable zones (MAFF, 1998). More recently, gaseous emissions from livestock systems have been recognised as con-tributors to soil N enrichment and acidification, which may damage nutrient-sensitive ecosystems in the UK and elsewhere in Europe, and to the ‘greenhouse effect’. Abatement measures are already enforced in some countries. Typically, N input as fertiliser to UK dairy farms is 281 kg ha−1compared with offtakes in milk of 36 kg ha−1(Jarvis, 1999), with the imbalance representing the polluting potential of the system. As well as environmental concerns, current economic, food hygiene and animal welfare pressures encourage more extensive and sustainable farming methods.
Some of the various opportunities that exist to abate losses and make better use of N in farming systems were summarised by Wilkins (1993). These include slurry injection to reduce ammonia loss, reliance on N fixation by white clover (Trifolium repensL.), and a tactical (diagnostic) approach to N fertilisation in which mineral N addition is adjusted according to plant requirements after determining levels of mineral N in the soil. An early cessation of grazing avoids the accumulation of soil inorganic N and reduces the risk of leaching in autumn. Although not appropriate in all circumstances, each of these system modifications has been shown to reduce losses. However, a high degree of interaction between processes is evident, and reduc-ing losses via one pathway may only serve to exacer-bate losses by other processes. In addition, grassland is commonly both cut and grazed and fertiliser may be applied from both organic and inorganic sources. It is, therefore, essential that a whole systems approach is considered to evaluate the environmental sustainabil-ity of systems based on reduced N inputs.
In this paper, the implications of using a combi-nation of management options to reduce N inputs and losses in beef production systems are examined. Self-contained, grassland farmlets were used to exam-ine the overall effects of each system on herbage and animal production and on N budgets, and a compar-ison was made with a system based on conventional N fertiliser management. The farmlets were sited on two soil types with contrasting drainage status to
allow comparisons to be made and with a particular aim of addressing the problems associated with grass-land management on poorly drained grass-land. Results are reported over 4–5 years.
2. Materials and methods
2.1. Site and sward details
1 ha grassland farmlets were established on two soil types with contrasting drainage status at two separate sites, being situated 4 km (Site 1) and 1.5 km (Site 2) from the Institute of Grassland and Environmental Re-search (IGER), North Wyke in South West England, UK (latitude 50.46◦N, longitude 30.54◦W). The soil at
Site 1 was a Dystric Gleysol (a freely-draining, grav-elly, sandy loam of the Shaldon series, described by Findlay et al. (1984) as well drained and moderately droughty with a high traffickability). At Site 2, the soil was an Orthic Luvisol (a poorly-drained clay loam of the Hallsworth series, being characteristically water-logged during the winter and early spring period). An-nual rainfall, measured at the meteorological station at North Wyke, averaged 1054 mm (1966–1995 mean) with approximately two-thirds of this occurring dur-ing the October–March period.
The farmlets were established at Site 1 in Spring 1992 on a mixedLolium perenneL./T. repensL. (cv. Huia) ley which was sown in autumn 1990. Prior to this, the land supported continuous winter-sown cere-als. The pasture was intensively grazed by sheep and occasionally by beef cattle during 1991. Grass-only plots were created by spraying out the clover on 1 ha areas using a mixture of MCPA/dicamba/mecoprop (Campbell’s ‘Field Marshal’, MTM Agrochemicals Ltd. (United Phosphorus Ltd.), Warrington; 5 l in 250 l water ha−1) in March 1992. At Site 2, farmlets were established in March 1993 on a permanent pasture known to be at least 50-years-old with grass-only treat-ments on the original sward and grass/white clover treatments on plots which were ploughed and reseeded toL. perenne L. (cv. Melle) and over-sown with T. repensL. (cv. Huia) in 1988.
2.2. Pasture management
live weight at turnout) At turnout, steers were blocked by weight and allocated at random to one of 12 farmlets. Each farmlet was nominally divided into 10 equal sectors numbered sequentially from 1 to 10. At turnout, cattle were confined to Sectors 1–3 using an electric fence. Thereafter, the mean sward height under grazing was maintained at >75 mm by moving the electric fence and adjusting the grazed area by ±0.1 ha when necessary. Excessively tall grass was cut for silage rather than grazed whenever possible to avoid spoilage. Initially (1992 and 1993), each farm-let was stocked at 7 steers ha−1. However, difficulties were experienced at Site 2 in 1993 after a wet spring period when considerable poaching of the swards oc-curred and the stocking rate was reduced to 4 steers ha−1 at both sites in subsequent years. Cattle were sold after the grazing period because there was no provision for housing.
Herbage surplus to grazing requirements was cut for silage; decisions regarding the areas available for cutting were made after consideration of imminent ad-justments to the grazed areas, the heights of the grazed swards and prevailing weather and ground conditions. Optimum soil conditions for herbage growth were maintained for all swards. Thus, 5 Mg lime (CaCO3) ha−1 was applied to the grass/white clover swards in 1994 to maintain the pH>6.0. Phosphorus and K were applied to all treatments in one annual dressing, usually after the first silage cut, to provide 60 kg ha−1 of each. Phosphorus and K were also applied in slurry.
2.3. Mineral fertiliser and slurry management
Nitrogen as ammonium nitrate was applied using a pneumatic boom spreader (Jet 812 PTO, Bamlett, Överums Bruk, 59096 Överum, Sweden). Slurry was
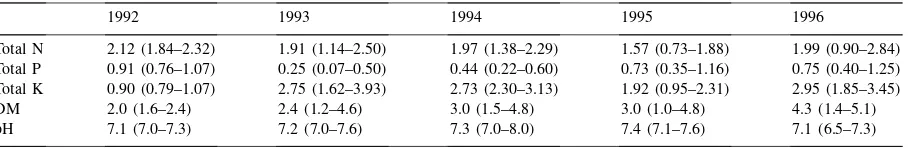
Table 1
Total N, P and K (kg m−3), dry matter (DM) content (%), and pH of the slurries used in the experimenta
1992 1993 1994 1995 1996
Total N 2.12 (1.84–2.32) 1.91 (1.14–2.50) 1.97 (1.38–2.29) 1.57 (0.73–1.88) 1.99 (0.90–2.84) Total P 0.91 (0.76–1.07) 0.25 (0.07–0.50) 0.44 (0.22–0.60) 0.73 (0.35–1.16) 0.75 (0.40–1.25) Total K 0.90 (0.79–1.07) 2.75 (1.62–3.93) 2.73 (2.30–3.13) 1.92 (0.95–2.31) 2.95 (1.85–3.45) DM 2.0 (1.6–2.4) 2.4 (1.2–4.6) 3.0 (1.5–4.8) 3.0 (1.0–4.8) 4.3 (1.4–5.1) pH 7.1 (7.0–7.3) 7.2 (7.0–7.6) 7.3 (7.0–8.0) 7.4 (7.1–7.6) 7.1 (6.5–7.3)
aEach value is the mean for all slurries used in each year with the range shown in parentheses.
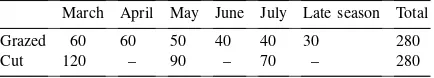
Table 2
Mineral N application (kg N ha−1) to areas designated ‘grazed’
or ‘cut’ for treatment CNa
March April May June July Late season Total
Grazed 60 60 50 40 40 30 280
Cut 120 – 90 – 70 – 280
aCN denotes conventional nitrogen.
2.4. Treatments
There were three treatments:
1. Conventional N (CN): A grass monoculture receiv-ing a total of 280 kg N ha−1each year as ammo-nium nitrate which was applied at set times and in set amounts from March to August, according to current recommendations (MAFF, 1994). The tim-ing and rate of each application were adjusted ac-cording to seasonal requirements of swards under grazing or cutting regimes (Table 2) with Sectors 1–3 designated ‘grazed’ and Sectors 4–10 ‘cut’. Grazed and cut areas received the same amount of N in total each year. Grazing commenced in spring when ground conditions and herbage availability allowed and continued until sward surface height (SSH) on the grazed area was less than 60 mm (Oc-tober at both sites). Herbage surplus to grazing re-quirements was cut on three occasions each year. Slurry was broadcast on the surface in spring and post-silage harvests. Slurry-N application was ad-ditional to the amounts of mineral N supplied. 2. Tactical N (TN): A grass monoculture receiving
modest amounts of N as ammonium nitrate with rates of application calculated to comply with the EC Nitrate Directive (CEC, 1991). Soil cores (10 on each sector) were taken fortnightly to a depth of 30 cm on sectors which were either grazed only (Sectors 1–3) or cut only (Sectors 9 and 10) and, after extraction with 1 M KCl, soil mineral N levels (nitrate plus ammonium) were determined using a modified reflectometer (‘Nitrachek 404’, QuoMed Ltd., Horsham, Sussex, UK). Nitrogen fertiliser was applied at fortnightly intervals, if required, in amounts prescribed by the model NCYCLE (Scholefield et al., 1995) to maintain nitrate con-centrations in drainage at<50 mg l−1, taking into
account mineralisation and denitrification rates and plant uptake. Thus, soil mineral N from both inorganic and organic sources was accounted for
when calculating rates of inorganic N addition. Nitrogen fertiliser application was adjusted for either grazing (Sectors 1–5) or cutting (Sectors 6–10) management. Inorganic N was not applied after August in each year. Slurry was injected in spring and post silage cuts. The cattle were re-moved from the farmlets in August and late-season growth was harvested for silage. There were three cuts for silage with two being taken during the post-grazing period from the whole farmlet area. 3. Grass/white clover (GC): A grass/white clover
sward receiving no fertiliser N. Grazing com-menced in spring and continued until SSH fell below 60 mm in autumn. There were three silage cuts each year. Slurry was injected with a nitrifi-cation inhibitor (dicyandiamide (‘eNrich’) Omex Agriculture Ltd., Kings Lynn, Norfolk, UK) in-corporated in late-season applications to reduce nitrate leaching during the winter period. Slurry injection in mid-season was avoided to prevent damage to the clover stolons.
2.5. Experimental design and statistical analysis
At each site, the pasture was divided into two repli-cate blocks and the three treatments were randomised within each block giving twelve plots in total. In 1992, one animal died on each of treatments TN and GC and each was replaced. Data collected for these an-imals were included up to the times of their deaths; data collected for their replacements were discarded. Treatment means for all parameters were compared by analysis of variance using Genstat 5 software (Genstat 5 Committee, 1995). Data collected for each site were analysed separately.
2.6. Measurements
The live weight of the cattle was recorded fort-nightly and daily live weight gain (LWG) was calcu-lated from regressions of live weight over time. The N content of the LWG was assumed to be 28 g kg per LWG (Schulz et al., 1974). Mean sward heights (SSH) was estimated weekly from 10 measurements taken at random on each sector under grazing using a sward stick (Bircham, 1981).
device attached to the rear axle of the trailer in which the crop was transported (‘Weyload’, Chipping Sod-bury, Avon). This instrument was calibrated by weigh-ing harvested grass in trailers on a public weighbridge after recording the weight measured by the ‘Weyload’. A linear regression described by x=123.39y−1138 (wherex=weight of grass andy=the ‘Weyload’ read-ing) accounted for 98.5% of the variation between 19 samples. Samples of fresh herbage were taken at the time of harvesting, and, after drying to constant weight, dry matter (DM) content was determined and DM yield calculated.
Herbage mass on offer was assessed on four occa-sions during the year to coincide with the start and end of grazing and the first and second silage cuts. On each occasion, samples (0.1 m2) were selected at random and cut to ground level with hand shears. At the start of grazing, one sample was taken on each of the 10 sectors of each farmlet. On subsequent occa-sions, 10 samples were taken on each farmlet being divided equally over all sectors under grazing. The herbage was dried at 80◦C in a forced-draught oven
and the DM content was determined. A representative sub-sample of the dried herbage was milled through a 0.8 mm screen and total N was determined by Kjel-dahl digestion.
The same herbage samples were used to assess clover proportion under grazing and 10 additional samples were taken on the sectors closed to grazing to assess clover proportion under cutting for treat-ment GC. Prior to taking the samples, the clover fraction as a proportion of the total herbage present within each sample was assessed visually. Four ad-ditional samples were assessed for clover proportion in the same sector but were not cut. The herbage taken was separated into grass and clover fractions before drying so that the proportion of clover in the biomass could be calculated. A linear regression equation was derived for the relationship between the actual and assessed values for clover proportion. The mean values of the four additional assessments made on each sector were used in the equation to calculate the mean clover percentage. Separate re-gression equations for each site were established for swards under cutting or grazing management at the time of sampling. Estimates of clover-N fixa-tion were made using the models (Ledgard, personal communication):
• N fixed for grazed swards (kg ha−1)=clover yield (kg DM ha−1)×0.06;
• N fixed for cut swards (kg ha−1)=clover yield (kg DM ha−1)×0.068.
Measured amounts of mineral fertiliser were applied and slurry was spread with tankers of pre-determined capacity. The total N content of the slurry was deter-mined by Kjeldahl digestion.
3. Results
3.1. Weather conditions
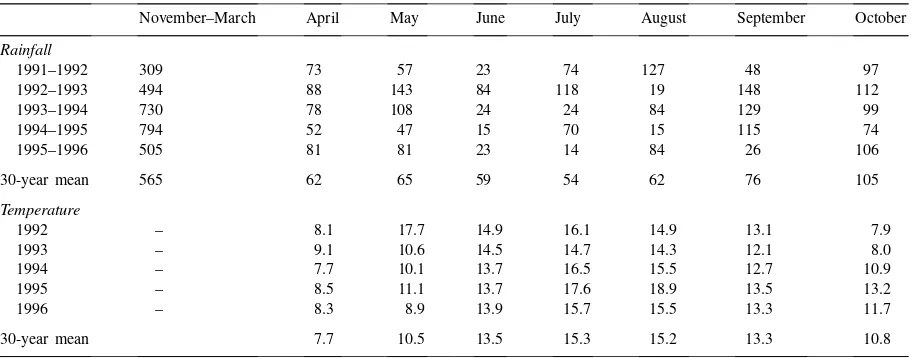
Table 3 shows rainfall and mean air temperature for each month from April to October and total rain-fall during the preceding November–March period, with 30-year (1966–1995) means, for 1992–1996. Considerable contrasts in rainfall occurred during the experiment. Of particular note is the extreme wetness of the April–October 1993 period, with rainfall during this period being 46% higher than the 30-year mean. The November–March period in 1993–1994 and 1994–1995 were 29 and 40% wetter than the 30-year mean, respectively. Dry periods were experienced in all years, with June–July 1994, June–August 1995 and June–July and September 1996 being exceptional. The July–September period in 1993 was cooler than aver-age and the summer of 1995 was particularly warm.
3.2. Slurry application
Table 3
Rainfall distribution (mm) and mean air temperature (◦C)
November–March April May June July August September October
Rainfall
1991–1992 309 73 57 23 74 127 48 97
1992–1993 494 88 143 84 118 19 148 112
1993–1994 730 78 108 24 24 84 129 99
1994–1995 794 52 47 15 70 15 115 74
1995–1996 505 81 81 23 14 84 26 106
30-year mean 565 62 65 59 54 62 76 105
Temperature
1992 – 8.1 17.7 14.9 16.1 14.9 13.1 7.9
1993 – 9.1 10.6 14.5 14.7 14.3 12.1 8.0
1994 – 7.7 10.1 13.7 16.5 15.5 12.7 10.9
1995 – 8.5 11.1 13.7 17.6 18.9 13.5 13.2
1996 – 8.3 8.9 13.9 15.7 15.5 13.3 11.7
30-year mean 7.7 10.5 13.5 15.3 15.2 13.3 10.8
49, 59 and 49 m3 for treatments CN, TN and GC, respectively, at Site 1 and 46, 59 and 45 m3for treat-ments CN, TN and GC, respectively, at Site 2. Corre-sponding values for the amounts of slurry applied as a proportion of the amounts required were 90, 93 and 92% at Site 1 and 87, 105 and 84% at Site 2.
3.3. Nitrogen inputs, outputs, efficiencies and surpluses
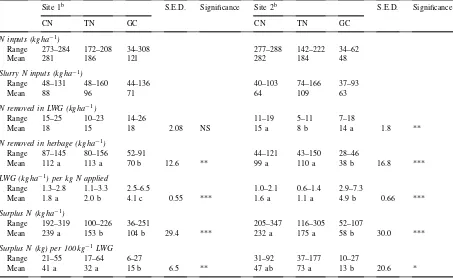
Nitrogen inputs, outputs, efficiencies and surpluses (using a ‘surface balance’ for the soil (Jarvis, 1999)) for each treatment are shown in Table 4. Average fertiliser N inputs on treatment TN were 95 and 98 kg ha−1less than for treatment CN for Site 1 and Site 2, respectively, with a wider range at Site 2 than at Site 1. Estimates of biological fixation for treatment GC reflected a reduction in clover proportion in the sward over the years at Site 1 and an increase at Site 2. Slurry-N addition was highest for treatment TN at both sites with overall means being 24, 34 and 37% of total N inputs for CN, TN and GC, respectively, at Site 1, and 18, 37 and 57% for CN, TN and GC, respec-tively, at Site 2. Nitrogen outputs in LWG were small in comparison to N inputs; values for treatment TN were lowest at both sites with treatment differences at Site 2 being significant (p<0.05). Significantly
less N was removed in cut herbage on treatment GC compared with the other treatments at both sites (Site
1,p<0.01; Site 2, p<0.001). Live weight gain kg−1 N applied was ranked in order from highest to lowest GC>TN>CN at Site 1 (p<0.001) and GC>CN>TN
at Site 2 (p<0.001). Nitrogen surpluses (N inputs
as fertiliser/fixation and manure minus N outputs in LWG and silage) were calculated on a per unit area (ha−1) and per unit product (100 kg−1 LWG) basis. Mean values for N surplus per unit area were ranked in order from highest to lowest CN>TN>GC at both Sites 1 and 2, with the differences being significantly (p<0.001) greater on treatment CN than the other treatments at Site 1, and significantly (p<0.001) lower on treatment GC than the other treatments at Site 2. Nitrogen surpluses ha−1for treatment TN and GC, showed reductions in comparison with CN of 34 and 56%, respectively, at Site 1, and 25 and 75%, respectively, at Site 2. For N surplus per unit product, treatments were ranked in order CN>TN>GC at Site 1 and TN>CN>GC at Site 2. Mean values for ment GC were significantly less than the other treat-ments at Site 1 (p<0.01) and treatment TN at Site 2
(p<0.05).
3.4. Grazing periods and herbage measurements
Table 4
N inputs as fertiliser (CN and TN) or biological fixation (GC) and slurry, outputs in live weight gain and cut herbage, efficiency and surplusesaper unit area and per unit product
Site 1b S.E.D. Significance Site 2b S.E.D. Significance
CN TN GC CN TN GC
N inputs (kg ha−1)
Range 273–284 172–208 34–308 277–288 142–222 34–62
Mean 281 186 121 282 184 48
Slurry N inputs (kg ha−1)
Range 48–131 48–160 44–136 40–103 74–166 37–93
Mean 88 96 71 64 109 63
N removed in LWG (kg ha−1)
Range 15–25 10–23 14–26 11–19 5–11 7–18
Mean 18 15 18 2.08 NS 15 a 8 b 14 a 1.8 **
N removed in herbage (kg ha−1)
Range 87–145 80–156 52–91 44–121 43–150 28–46
Mean 112 a 113 a 70 b 12.6 ** 99 a 110 a 38 b 16.8 ***
LWG (kg ha−1) per kg N applied
Range 1.3–2.8 1.1–3.3 2.5–6.5 1.0–2.1 0.6–1.4 2.9–7.3
Mean 1.8 a 2.0 b 4.1 c 0.55 *** 1.6 a 1.1 a 4.9 b 0.66 ***
Surplus N (kg ha−1)
Range 192–319 100–226 36–251 205–347 116–305 52–107
Mean 239 a 153 b 104 b 29.4 *** 232 a 175 a 58 b 30.0 ***
Surplus N (kg) per 100 kg−1 LWG
Range 21–55 17–64 6–27 31–92 37–177 10–27
Mean 41 a 32 a 15 b 6.5 ** 47 ab 73 a 13 b 20.6 *
aN inputs as fertiliser/fixation and slurry minus N outputs as live-weight gain (LWG) and silage.
bAbbreviations: CN, conventional nitrogen; TN, tactical nitrogen; GC, grass/white clover. Values with different letters within rows for
each site are significantly different (NS, not significant; *p<0.05; **p<0.01; ***p<0.001).
of 163, 104 and 166 days at Site 2. Generally, graz-ing startgraz-ing earlier in sprgraz-ing at Site 1 and continued longer in autumn at Site 2. More land was required to comply with grazing guidelines on treatment GC than the other treatments and least land was grazed on treatment CN at both sites, with treatment differ-ences over all years being significant (p<0.05) at Site 1. Means over all years were 0.57, 0.62 and 0.64 ha (S.E.D.=0.029,p<0.05) at Site 1 and 0.53, 0.54 and 0.64 ha (S.E.D.=0.059, p>0.05) at Site 2, for treat-ments CN, TN and GC, respectively.
Treatment comparisons for SSH, herbage mass on offer and the grassland area required for grazing were made for the period from the start of grazing in spring to the end of grazing on treatment TN. Over all years, SSH was highest on treatment CN at Site 1 and on treatment TN at Site 2 (89, 86 and 86 mm, S.E.D.=2.8,
p>0.05 for Site 1 and 91, 96 and 88 mm, S.E.D.=3.4,
p>0.05 for Site 2 for CN, TN and GC, respectively). Differences between treatment means were not icant. The overall mean value for Site 2 was signif-icantly greater than the corresponding value for Site 1 (87 and 92 mm for Site 1 and Site 2, respectively, S.E.D.=1.8,p<0.05). Similarly, herbage mass on of-fer was highest for CN at Site 1 and for TN at Site 2, and was consistently lower in all years for GC at both sites (3.05, 2.85 and 2.46 t ha−1, S.E.D.=0.136,
Table 5
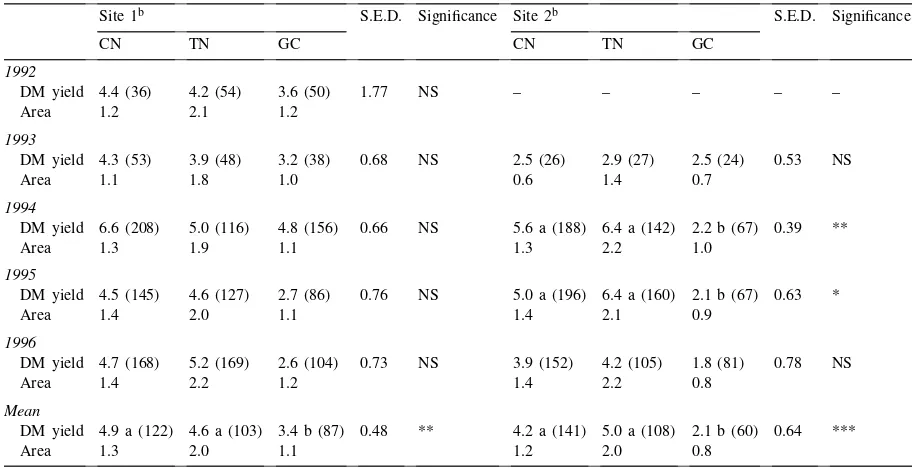
Herbage DM yield (t) and the total area cut for silage, for each treatment, in each year, with overall meansa
Site 1b S.E.D. Significance Site 2b S.E.D. Significance
CN TN GC CN TN GC
1992
DM yield 4.4 (36) 4.2 (54) 3.6 (50) 1.77 NS – – – – –
Area 1.2 2.1 1.2
1993
DM yield 4.3 (53) 3.9 (48) 3.2 (38) 0.68 NS 2.5 (26) 2.9 (27) 2.5 (24) 0.53 NS
Area 1.1 1.8 1.0 0.6 1.4 0.7
1994
DM yield 6.6 (208) 5.0 (116) 4.8 (156) 0.66 NS 5.6 a (188) 6.4 a (142) 2.2 b (67) 0.39 **
Area 1.3 1.9 1.1 1.3 2.2 1.0
1995
DM yield 4.5 (145) 4.6 (127) 2.7 (86) 0.76 NS 5.0 a (196) 6.4 a (160) 2.1 b (67) 0.63 *
Area 1.4 2.0 1.1 1.4 2.1 0.9
1996
DM yield 4.7 (168) 5.2 (169) 2.6 (104) 0.73 NS 3.9 (152) 4.2 (105) 1.8 (81) 0.78 NS
Area 1.4 2.2 1.2 1.4 2.2 0.8
Mean
DM yield 4.9 a (122) 4.6 a (103) 3.4 b (87) 0.48 ** 4.2 a (141) 5.0 a (108) 2.1 b (60) 0.64 ***
Area 1.3 2.0 1.1 1.2 2.0 0.8
aThe values in parentheses show the yield of herbage DM as a proportion (%) of the estimated DM required for winter feeding.
Assuming a live weight at slaughter of 475 kg, rolled barley fed as a supplement (3 kg per head per day for the first 3 months of the housed period and 4.5 kg per head per day thereafter) and allowing for 25% total losses of conserved herbage during ensiling and feeding.
bValues with different letters within rows for each site are significantly different (NS, not significant; *p
<0.05; **p<0.01; ***p<0.001). Abbreviations as in Table 4.
1996. Conversely, values for treatment GC at Site 2 increased from 6% for both grazed and cut swards in 1993 to 10% for grazed and 9% for cut swards in 1996. Overall means, adjusted according to the proportion of the total area under cutting or grazing management for each farmlet, were 20% at Site 1 and 9.5% at Site 2.
Table 5 shows that, over all years, the greatest area of land was available for cutting on treatment TN than on the other treatments, and least land was cut on treatment GC. Yields were generally lower on treat-ment GC than on the other treattreat-ments at both sites, with the differences being significant at Site 2 in 1994 (p<0.01) and 1995 (p<0.05) and over all years at both sites (Site 1,p<0.01; Site 2,p<0.001).
3.5. Self-sufficiency for winter fodder
Estimated levels of silage DM required during the housed period were calculated for each treatment,
Table 6
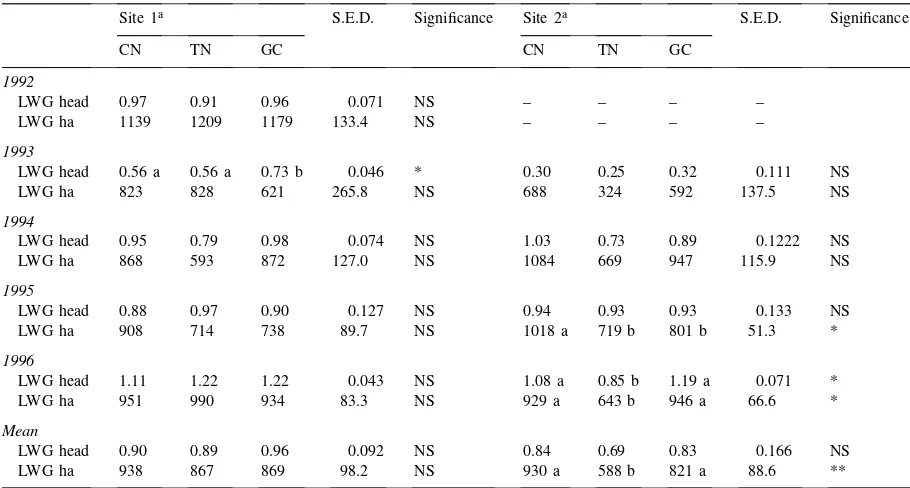
Daily live weight gain (LWG) per head (kg) up to the removal of cattle on TN and overall LWG grazed ha−1 (kg) for each treatment, in
each year, with overall means
Site 1a S.E.D. Significance Site 2a S.E.D. Significance
CN TN GC CN TN GC
1992
LWG head 0.97 0.91 0.96 0.071 NS – – – –
LWG ha 1139 1209 1179 133.4 NS – – – –
1993
LWG head 0.56 a 0.56 a 0.73 b 0.046 * 0.30 0.25 0.32 0.111 NS
LWG ha 823 828 621 265.8 NS 688 324 592 137.5 NS
1994
LWG head 0.95 0.79 0.98 0.074 NS 1.03 0.73 0.89 0.1222 NS
LWG ha 868 593 872 127.0 NS 1084 669 947 115.9 NS
1995
LWG head 0.88 0.97 0.90 0.127 NS 0.94 0.93 0.93 0.133 NS
LWG ha 908 714 738 89.7 NS 1018 a 719 b 801 b 51.3 *
1996
LWG head 1.11 1.22 1.22 0.043 NS 1.08 a 0.85 b 1.19 a 0.071 *
LWG ha 951 990 934 83.3 NS 929 a 643 b 946 a 66.6 *
Mean
LWG head 0.90 0.89 0.96 0.092 NS 0.84 0.69 0.83 0.166 NS
LWG ha 938 867 869 98.2 NS 930 a 588 b 821 a 88.6 **
aValues with different letters within rows for each site are significantly different (NS, not significant; *p
<0.05; **p<0.01). Abbreviations as in Table 4.
3.6. Animal production
Daily LWG per head from turnout until the removal of the cattle from treatment TN was calculated for all treatments. LWG grazed ha−1, being the product of daily LWG per head, stocking rate of the grazed area, and the number of days spent grazing, was calculated for the overall grazing period for each treatment. Table 6 shows that, at Site 1, LWG per head was sim-ilar for all treatments, except in 1993 when the value for treatment GC was significantly (p<0.05) greater than the other treatments. At Site 2, values were generally lower on treatment TN than the other treat-ments with the differences being significant (p<0.05)
in 1996. Values for CN and GC were similar in all years. LWG grazed ha−1, for Site 1, was highest at the higher stocking rate in 1992. On average, values were highest on treatment CN but treatment differ-ences were small and non-significant (p>0.05). For Site 2, LWG grazed ha−1was significantly (p
<0.05)
greater for treatment CN than the other treatments in
1995 and significantly (p<0.05) lower for treatment TN in 1996 and over all years.
4. Discussion
for treatment CN at Site 2 and 50% for treatment GC at Site 2.
Only small proportions of the N inputs were con-verted to animal products with values being similar to those reported by others for beef production systems. Calculations on the data reported by Tyson et al. (1992) for permanent pasture receiving either 200 or 400 kg N ha−1per year, show that the amounts of N re-moved as LWG in beef steers were 22 and 25 kg ha−1, respectively. Animal output was maximised in this experiment by continuous adjusted stocking with no allowance made for winter fodder requirements. Sim-ilarly, on a freely draining soil at Hurley, UK, Ryden and Garwood (Whitehead et al., 1986) reported off-takes as animal LWG of 29 and 23 kg N ha−1 (6 and 12% of total N input), respectively, for grazed ryegrass receiving 420 kg N ha−1per year and unfer-tilised ryegrass/white clover swards, respectively.
Substantial amounts of N were removed in cut herbage with the differences between treatments re-flecting differences in the areas cut and N inputs for each treatment. Least herbage was cut on treatment GC because more land was required to maintain graz-ing guidelines on this treatment. A large proportion of the N removed in herbage was returned in slurry. The amounts of slurry applied to the treatments may have been over-estimated because losses during storage periods were not accounted for. It may be assumed that further losses would have occurred by ammonia volatilisation during spreading, particularly on treat-ment CN, and by leaching and denitrification. Losses of N via these pathways will be reported elsewhere. Preliminary results show losses in the order of 51, 32 and 4 kg N ha−1 as ammonia, 67, 12 and 5 kg N ha−1 as nitrate and 10, 4 and 12 kg N ha−1 from denitrification for treatments CN, TN and GC, re-spectively, at Site 1 (Scholefield and Hatch, personal communication, IGER, North Wyke).
N inputs were correlated with N surpluses on all treatments, being highest on treatment CN and lowest on GC, and the highest animal and herbage output was attained on treatment CN. It is, therefore, appar-ent that reduction in N surplus was only achieved at the expense of production which will inevitably affect the farm economy. The improved management of a smaller amount of fertiliser N on treatment TN com-pared with CN did not translate into improved herbage or animal output. Similarly, a reduction in grazing
for TN did not result in an increase in the silage crop even though more land was available for cutting. It may be assumed that any reduction in nitrate leaching achieved by the early cessation of grazing would be offset by an increased loss of N as ammonia during housing and from slurry stores and land spreading. This, however, may be advantageous in areas where nitrate concentration in drinking water is regulated (nitrate vulnerable zones). Higher production costs during housing, which may be considerable, would also have to be considered for treatment TN.
farms and reported surplus N ha−1 of 400, 265 and 208 kg for systems representing (a) good commercial practice, high output, (b) reduced loss, high output and (c) minimal loss, reduced intensity, respectively.
Surplus N within grassland-based animal produc-tion systems is susceptible to loss to the wider en-vironment. These results show that it is possible to reduce N surpluses, and consequently the pollution risk, by the adoption of simple measures and more accurate management techniques. Other techniques, such as the use of on-farm slurry analysis methods, the use of additives, and covering slurry stores to prevent ammonia loss, will assist in preventing pol-lution while exploiting the fertiliser value of manure (Pain et al., 1986). In addition, improved N retention in animals when grazing and during housing, and a better integration of cutting and grazing, have been shown to improve the overall efficiency of utilisation of N. Strategies such as these may be adopted more widely and be incorporated in protocols for farming practice.
5. Conclusions
In conclusion, substantial reductions in N inputs and surpluses were achieved on treatments TN and GC. However, the highest animal and herbage production was associated with the highest N input for treatment CN with more land required for grazing on treatment GC than on CN and less herbage cut for silage on this treatment. The early housing of cattle on treat-ment TN did not result in more herbage being cut for silage. Self-sufficiency for winter fodder was realised on treatments CN and TN but not on GC which would have implications for farm economies.
Acknowledgements
We are indebted to Mr. M. Pocock, Miss J. Lake, Miss S. Howell, Mr. L. Arjuna and Mr. A. Stone for their skilled technical assistance. The authors would like to thank the farm staff at North Wyke for carry-ing out field operations and the staff of the Analyti-cal Chemistry Laboratory for chemiAnalyti-cal analyses. Dr. A.J. Rook provided statistical support. The work was funded by the Ministry of Agriculture, Fisheries and
Food, London. IGER is a grant funded by the Biotech-nology and Biological Sciences Research Council.
References
Bircham, J.S., 1981. Herbage growth and utilization under continuous stocking management. Ph.D. thesis, University of Edinburgh.
CEC, 1991. Council directive concerning the protection of water against pollution caused by nitrates from agricultural sources. Official Journal of the European Community (91/676/EEC), L375/1–9.
Findlay, D.C., Colborne, G.J.N., Cope, D.W., Harrod, T.R., Hogan, D.V., Staines, S.J., 1984. Soils and their use in South West England. Soil Survey of England and Wales, Bulletin No. 14, Rothamstead Experimental Station, Harpenden, Hertfordshire, UK.
Genstat 5 Committee, 1995. Genstat 5 Release 3.2 Reference Manual. Clarendon Press, Oxford.
Jarvis, S.C., 1999. Accounting for nutrients in grassland: challenges and needs. In: Corrall, A.J. (Ed.), Accounting for Nutrients. British Grassland Society Occasional Symposium No. 33, pp. 3–12.
Jarvis, S.C., Wilkins, R.J., Pain, B.F., 1996. Opportunities for reducing the environmental impact of dairy farming managements: a systems approach. Grass Forage Sci. 51, 21– 31.
Ledgard, S.F., Giller, K.E., 1995. Atmospheric N2 fixation as
an alternative N source. In: Bacon, P.E. (Ed.), Nitrogen Fertilization in the Environment. Marcel Dekker, New York. MAFF, 1994. Fertilizer Recommendations for Agricultural and
Horticultural Crops. Reference Book 209, HMSO, London. MAFF, 1998. Guidelines for farmers in NVZs. Ministry of
Agriculture, Fisheries and Food, London, 32 pp.
Pain, B.F., Smith, K.A., Dyer, C.J., 1986. Factors affecting the response of cut grass to nitrogen content of dairy cow slurry. Agric. Wastes 17, 189–202.
Peel, S., Chambers, B.J., Harrison, R., Jarvis, S.C., 1997. Reducing nitrogen emissions from complete dairy farm systems. In: Jarvis, S.C., Pain, B.F. (Eds.), Gaseous Nitrogen Emissions from Grassland. CAB International, Wallingford, pp. 383–390. Scholefield, D., Titchen, N.M., 1995. Development of a rapid field test for soil mineral nitrogen and its application to grazed grassland. Soil Use Man. 11, 33–43.
Scholefield, D., Brown, L., Jewkes, E.C., Preedy, N., 1995. Integration of soil testing and modelling as a basis for fertiliser recommendations for grassland. In: Lemaire, G., Burns, I.G. (Eds.), Diagnostic Procedures for Crop N Management. Les Colloques, No. 82, INRA, Paris.
Tyson, K.C., Garwood, E.A., Armstrong, A.C., Scholefield, D., 1992. Effects of field drainage on the growth of herbage and the live weight gain of grazing beef cattle. Grass Forage Sci. 47, 290–301.
Whitehead, D.C., Pain, B.F., Ryden, J.C., 1986. Nitrogen in UK grassland agriculture. J. R. Agric. Soc., England 147, 190– 201.
Wilkins, R.J., 1993. Environmental constraints to production systems. In: The Places for Grass in Land Use Systems. British Grassland Society, Reading, pp. 19–30.
Wilkinson, J.M., 1984. Milk and Meat from Grass. Granada, London.
Wilkinson, J.M., Tayler, J.C., 1973. Beef Production from Grassland. Butterworths, London.