A 3D CAMPUS INFORMATION SYSTEM
–
INITIAL STUDIES
I. Kahramana, I. R. Karasa, B. Alizadehasharfib, A. Abdul-Rahmanb
a
Karabuk University, Engineering Faculty, Computer Engineering 78050 Karabuk , Turkey - (idriskahraman, ismail.karas)@karabuk.edu.tr
b
Department of Geoinformatics, Faculty of Geoinformation and Real Estate, Universiti Teknologi Malaysia, 81310 Skudai, Johor, Malaysia - [email protected], [email protected]
KEY WORDS: Geographical Information System, Campus Information System, 3D GIS, CityGML, Dynamic Pulse Function
ABSTRACT:
This paper discusses the method of developing Campus Information System. The system can handle 3D spatial data within desktop and web environment. The method consists of texturing of building facades for 3D building models and modeling 3D Campus Information System. In this paper, some of these steps are carried out; modelling 3D buildings, toggling these models on the terrain and ortho-photo, integration with a geo-database, transferring to the CityServer3D environment by using CityGML format and designing the service, etc. In addition to this, a simple but novel method of texturing of building façades for 3D city modeling that is based on Dynamic Pulse Function(DPF) is used for synthetic and procedural texturing. DPF is very fast compared to other photo realistic texturing methods. Last but not least, it is aimed to present this project on web using web mapping services. This makes 3D analysis easy for decision makers.
1. INTRODUCTION
The use of Geographic Information Systems (GIS) has become widespread in diverse disciplines such as urban and regional planning cartography, tourism sector, local governments and private sector. In general, GIS is a system of hardware, software, data, people, organizations and institutional arrangements for collecting, storing, analyzing and disseminating and presenting spatial and non-spatial information about areas of the earth (Chrisman, 2002).
3D city modeling defines methods for modeling various types of 3D objects within the city such as terrain, road network, building wireframes, texture on the facades and roof, signatures, trees, traffic lights and, etc. In this project, textures of 3D buildings were created based on prepossessed procedural texturing technique callaed DPF.
Today, GIS-based Campus Information System, have been used by many universities for different aims and purposes with different effective tools. This integrated system is formed by hardware, software, data and users for collecting spatial and non-spatial data within the university and its sub-units (both academic and administrative). By using the systems, these spatial and non-spatial data can be transferred, stored, queried, analyzed, and presented to the decision makers.
2. DATA ACQUISITION
Data acquisition is a process of acquiring, extracting, transforming, and transporting data from the source systems and external data sources. The data is the fundamental part of the projects. Several types of data were used for this project.
2.1 CAD Data and Optimization of Data
AutoCAD files keep layers, floors, rooms, and footprints of the buildings in dwg and dxf format.
- AutoCAD data file contains footprint of all buildings. - AutoCAD data file contains dimensions of buildings and study area.
- Profile, top view, side view of the buildings in AutoCAD data format
- Landscape of the project area with required information of vegetation and attribute data of overall project area in the AutoCAD data file
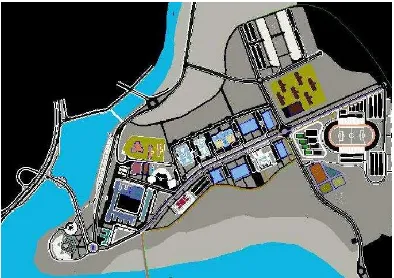
Figure 1. Footprints of all buildings in AutoCAD format
Boundaries of buildings, floors, rooms and other necessary parts were determined carefully within the AutoCAD file. The unnecessary lines, parts and texts in AutoCAD file cleaned. Because optimized AutoCAD file is imported into Google SketchUp in terms of creating geometric model. Therefore, the CAD data should be corrected so primarily depending on the need. Unnecessary lines and parts can also be deleted in Google Sketchup environment but it is more appropriate to do this process in AutoCAD environment. LoD2 is used for the International Archives of the Photogrammetry, Remote Sensing and Spatial Information Sciences,
buildings. So interior design of the structures is not shown on the project as the outer details are required.
Figure 2. The CAD data
Figure 3. Simplified and generalized CAD data
2.2 Photo Shooting and Dynamic Pulse Function
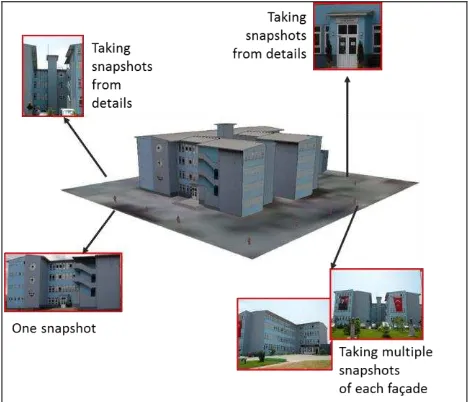
3D models of the buildings were generated by designing one by one on the footprints, and a lot of photos were utilized. In order to obtain very detailed structures of the façade, one of the best practices is to have a multi-aspect photo shooting as illustrated in Figure 3&4. On the other hand, it is particularly emphasized
on the corner snapshots to match all façade together.
Figure 4. Taking pictures from different views
Additionally, some images of building façades should be in png format. This is because; some parts of the building façades have interior view which can be generated with this format.
(a) (b)
Figure 5. a) Texturing in png format b) Texturing in jpeg format
Texturing is made with photo shooting method for some parts of the building. But the Dynamic Pulse Function method is the main function for texturing the façades. Due to huge data size of photorealistic texturing and lack of quality because of leaning geometries and disturbing objects, DPF is used for texturing. The output images produced by this method have high quality along with small data size; useful for web-based applications and navigators. Hence, the speed of the system is advanced with this method. As shown on Figure 6., 4 texture parts (1-wall texture, 2-window texture, 3,small window texture, 4-rain
gutter) load to the application and façade texture is generated as
shown on the Figure 6.
(a) (b)
Figure 6. a) Texture parts b) Generated texture
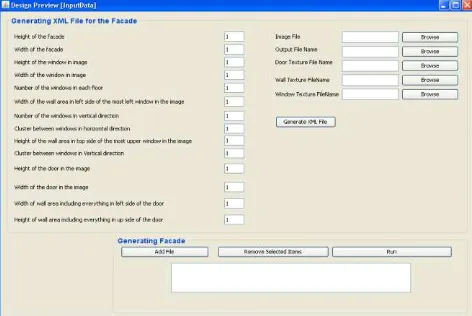
Dynamic Pulse Function application is developed in Java platform. This application is used for producing texturing for
façades. For this purpose, after loading sample pieces (wall texture, window texture, door texture, etc.), input required parameters. After entering values like width and height of wall texture, window, door, number of the windows are in the same line, number of the windows vertically aligned, window gap values, left margin of the first window, an xml file is generated. This xml file is loaded to application and after running the application, jpeg formatted image is obtained as output. This images are used in photo texturing.
International Archives of the Photogrammetry, Remote Sensing and Spatial Information Sciences,
Figure 7. Interface of the application Dynamic Pulse Function
2.3 Modeling 3D Structures
AutoCAD files were imported to SketchUp and unnecessary layers omitted and finally grouped. This file consists of footprints of buildings, details of the buildings, roads and other objects. Each floor plan of the buildings sketched as a closed polygon. These polygons should be simple geometry for web-based applications and navigators. Closed polygons were extruded based on the information from section view from the CAD file. Extrusions were applied according to measurements that were taken from administrative units of the university (Figure 1&2).
Figure 8. Footprint of the Engineering Faculty
Figure 9. Extruding the footprint of the Engineering Faculty
Façade texturing allows the realization of the buildings look
like real objects on the terrain. Some of the captured photos could have some problems, such as obstacles (trees, cars, pedestrians, etc.) to the buildings appearance. To avoid of this kind of problem, photo editing is needed in image editor program. The photos also should have to be optimized in both aspect; file size and quality. On the other hand, designed models should have simple geometry to reduce file size too. After the image and geometry optimization, the textured 3D models can be used effectively on the web to be loaded quickly based on GoogleEarth surface.
On the other hand, building textures were created by Java graphics. By the former method, every photo must be optimized one by one for a clean work. The output textures of this method are high data size. Therefore, a java code is developed for creating textures with high quality and small file data size. Mostly, the output image file is even smaller than the textures
which are used to create the façade. Semantic modeling along
with synthetic texturing has been done in this method and the database can be queried from XML schema. In this technique the perpendicular terrestrial photo from the façade was rectified by employing projective transformation functions and parameters from the camera after calibration. The rectified photo is down-sampled or resized based on constrain proportion. The result is not suitable for texturing the 3D model due to problems such as leaning geometries, shadow, disturbing objects and reflection but can be used for measuring parameters. For instance height and width of the resized and rectified photo can be employed for compiling the java program and generating the output frame. The height and width of windows, doors, horizontal and vertical distance between windows from upper left corner of this photo can be measured. The system can use these parameters and texture file names and file paths to create
the façade semi-automatically. The final image file resolution is proportional to the real geometry of the façade which can prevent the image from distortion and deformation while mapping (Alizadehashrafi et al., 2011).
Figure 10. Image optimization before and after
2.4 Texturing 3D Models
Texturing is one of the main components of 3D modeling. Realistic view of buildings is so important in virtual city, urban planning, disaster management and building supervision. Output texture files generated with the Dynamic Pulse Function were imported to SketchUp files and embedded to related
façade. Every structure and other 3D objects were modeled in SketchUp separately as seen in Figure 11&12.
International Archives of the Photogrammetry, Remote Sensing and Spatial Information Sciences,
Figure 11: Texturing in 3D modeling
Figure 12. Rectorate Building of Karabuk University, Turkey
2.5 Modeling and Visualizing Campus Area
Every building and other 3D objects were modeled in SketchUp separately. Before data entry, the whole campus area should be designed in the SketchUp.
3. CITYSERVER3D AND DATA ENTRY
3.1 CityServer3D and CityGML
Cityserver3D technology with its Open Geospatial Consortium (OGC) standards is a geodata server for three-dimentional city models and provides analysis and dynamic data. It has developed by Graphic Information Systems of Fraunhofer Institute for Computer Graphics (FHG-IGD). It is served as data storage with its own database but additional data sources.
In spite of the managing content, two tools are integrated into the framework. Firstly, there is a web-based WebViewer for exploring and visualizing the data which stored in the database. Secondly, there is a dedicated client that ensures importing and exporting the geodata. This provides management of database and content administration. It is seem that different external data
formats can be converted into the internal format (Haist and Coors, 2005.).
CityGML file format was used for the importing data into the CityServer3D. CityGML is a common information model for the representation of 3D urban objects. Classes and relations for the topographic objects in cities and regional models is defined with the geometrical, topological, semantical and appearance properties. CityGML format is beneficial for managing 3D city model as a multipurpose data source. External code list is a value defined by OGC for semantic modeling of objects by their
type of class, function, usage, roof type, installation, material, and so on. On the purpose of importing 3D models into CityServer3D, it is required to convert 3D SketchUp models to CityGML format by using CityGML plugin for SketchUp. After that, models can be uploaded to CityServer3D (Alizadehashrafi et al., 2010).
CityGML supports different Levels of Detail (LOD). In a CityGML dataset, the same object may be represented in different LOD simultaneously, enabling the analysis and visualization of the same object with regard to different degrees of resolution. LOD1 is for prismatic buildings with flat roofs. In contrast, a building in LOD2 has differentiated roof structures and thematically differentiated surfaces. LOD3 denotes architectural models with detailed wall and roof structures, balconies, bays and projections. LOD4 completes the LOD3 model by adding interior structures for 3D objects (Figure 8) (Candidate OpenGISCityGML Implementation, 2006). In this project LOD3 is used for buildings.
Figure 13. CityGML Data Model
Behind the scene of CityServer3D, it is possible to access to the MySQL database using DDL (Data Definition Language) and DML (Data Manipulation Language) to define and manipulate the data directly.
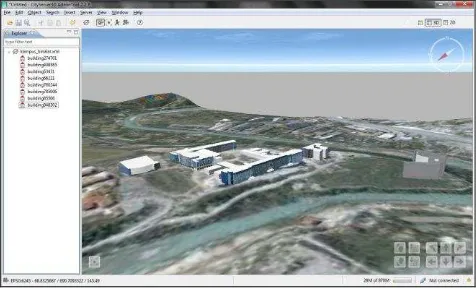
The WebViewer of the CityServer3D forms the interface between the user and the database. The WebViewer has standard technologies of the World Wide Web. The viewer works on any browser as long as it has java platform. Users can define any polygon by selecting area of interest on the map. When user clicks the interested area, the viewer and browser show the three-dimensional visualization of the selected area. In order to display 3D visualization on WebViewer, the viewer uses java3D technology. In a virtual universe the user can freely navigate through the area and objects. E.g., you can select buildings to get further information. The user interface is configured by XML files (Haist and Coors, 2005).
Figure 14. Visualization of the study area International Archives of the Photogrammetry, Remote Sensing and Spatial Information Sciences,
There will a semantic modeling for the campus area. Querying is the significant role for the system. Because, if you want to search something about the Campus, there will be 3D querying the spatial database and synchronize with visualization.
4. CONCLUDING REMARKS
Although CIS’s usage is very common, 3D CIS applications still doesn’t prevail in the universities management tools
(decision makers). This paper describes initial works on creating 3D web CIS. And also we used Dynamic Pulse Function in order to obtain better textures.
In the further works of this project, it is aimed that generated 3D models will be integrated with the spatial database for querying. We will service the project and add some applications such as 3D network analyze (Figure 10).
Figure 15. 3D Network Analyze
Additionally, it is aimed that some web-based applications like Tree Information System, Interactive Panoramic Image Library will be integrated to the system (Figure 11&12).
Figure 16. Panoramic View Library of Karabuk University
Figure 17. Tree Information System of Karabuk University
5. REFERENCES AND/OR SELECTED BIBLIOGRAPHY
References from Journals:
Haist, J., Coors, V.,“The W3DS-Interface of Cityserver3D” In: Kolbe, Gröger (Ed.); European Spatial Data Research (EuroSDR) u.a.: Next Generation 3D City Models. Workshop Papers: Participant's Edition. 2005, pp. 63-67
References from Other Literature:
Alizadehashrafi, B., Abdul-Rahman, A., Coors V., 2011, Texturing Sophisticated Geometries In Putrajaya, Applied Geoinformatics for Society and Environment (AGSE), Kenya
Haist, J., Etz, M.,“CityServer3D”, Computer Graphik Topics,
INI-GraphicsNet, 2005, Germany
Alizadehashrafi, B., Coors, V., and Rahman, A., A., “Dynamic Pulse Function for Texturing 3D Models”, World Engineering
Congress 2010, 2nd – 5th August 2010, Kuching, Sarawak, Malaysia, 2010
Chrisman, N., R., "Exploring GIS", 2nd edition (John Wiley and Sons, Inc.), 2002
Gröger, G., Kolbe T. H., 2006, Czerwinski, A., Candidate OpenGIS CityGML Implementation Specification
Gröger, G., Kolbe T. H., Czerwinski A, 2006,
Candidate
OpenGIS CityGML Implementation5.1 Acknowledgements
This study was supported by TUBITAK - The Scientific and Technological Research Council of Turkey (Project No: 112Y050) research grant. We are indebted for its financial support. And also, we would like to thank to the 3D GIS Lab, Universiti Teknologi Malaysia, for their assistance. International Archives of the Photogrammetry, Remote Sensing and Spatial Information Sciences,