www.elsevier.com / locate / econbase
Alternative models of demand for automobiles
*
Charlotte Wojcik
Federal Trade Commission, 8521 Window Latch Way, Columbia, MD 21045, USA
Received 28 October 1996; accepted 21 October 1999
Abstract
This paper uses data on automobile purchases to compare two alternatives to the multinomial logit model. The results indicate that the nested logit model is likely to be superior to the more general Berry–Levinsohn–Pakes model for applications using aggregate-level data. 2000 Elsevier Science S.A. All rights reserved.
Keywords: Demand models; Logit; Berry–Levinsohn–Pakes; Nested logit
JEL classification: C1
1. Introduction
The problems with the frequently-used multinomial logit model in the context of differentiated products and heterogeneous consumers are well known. This paper uses aggregate-level data on automobile sales to compare two alternative models: a very general model developed by Berry et al. (1995), and a more restrictive (but far easier to compute) nested logit model similar to that in Goldberg (1995). Both of these models involve interactions between car characteristics and consumer ‘tastes’. While the Berry–Levinsohn–Pakes (BLP) model may be theoretically superior to the nested logit (and was designed expressly for use with aggregate-level data), the nested logit model consistently predicted market shares more accurately.
2. The nested logit demand model
The nested logit model allows more reasonable substitution patterns than the simple multinomial logit because it imposes the Independence of Irrelevant Alternatives (IIA) assumption only across the
*Tel.:11-202-326-3450; fax: 11-202-326-2625.
E-mail address: [email protected] (C. Wojcik)
available choices at each stage. In choosing the nesting structure, we assume that consumers first choose the class of car (‘small’, ‘standard’, ‘luxury / sports’, or the outside alternative of not buying a new car), then the country of origin (domestic, European, or Japanese / Korean), and finally the specific model. Since the same unobservable characteristics (such as quality) which influence demand are also likely to affect marginal cost, the error term will be correlated with price; Berry (1994) demonstrates the use of a linear instrumental variables (IV) procedure to estimate the demand parameters in a
1
nested logit model. The demand instruments include the characteristics of model j, the sum of each of these characteristics over other models of the same origin and class, and the sum of each over models of other origins and classes.
3. The Berry–Levinsohn–Pakes demand model
The BLP model is less restrictive than the nested logit, but also far more difficult to compute. In this model the right hand side includes terms interacting consumer preferences (simulated by Monte Carlo methods) and product attributes; the parameters are estimated using the generalized method of moments (GMM / IV). The demand instruments are the characteristics of model j, the sum of each of these characteristics over other models made by the same firm, and the sum of each over models made
2 by other firms.
4. Results
3 The following is a variable list.
SHAREjt: the market share (taking account of the outside alternative) of model j; SHARE0t: the market share of the outside alternative in year t;
PRICEjt: the retail list price of the base model, in thousands of 1983 dollars; INCOMEt: the average household income plus the simulated deviation in year t; HP/ WTjt: horsepower per 10 lbs of vehicle weight;
AIRjt: a dummy for whether air conditioning is standard;
MPDOLjt: MPG (in tens) divided by the retail price of unleaded gas;
LN3WDjt: length3width, in units of 10,000 square inches;
1
By including the values of the observable characteristics of model j, we are making the (perhaps not innocuous) assumption that these terms are orthogonal to the unobserved characteristics.
2
We assume, following Berry et al. (1995) and others, that the firm unit for domestic cars is the parent company, i.e. GM, Ford, and Chrysler.
3
sotuc: the probability that origin o will be chosen, given prior choice of class c; sjtuoc: the probability that model j will be chosen, given class c and origin o chosen.
Table 1 contains the parameter estimates from both the nested logit and BLP specifications. The nested logit model yields a negative coefficient on PRICE and positive effects of all of the vehicle attributes as expected, and all are statistically significant. The probabilities of the choice which must be made at each stage to result in model j being bought, ln(sjtuoc) and ln(sotuc), naturally have positive and highly significant coefficients. Using the BLP model, the coefficient on the expenditure on other
goods, ln(INCOME2PRICE), is positive and significant as expected; the coefficients on all of the
attributes except MPDOL (which is very imprecisely measured) are positive, but few are significant. The coefficients on all of the interaction terms are also positive (though not significantly different from zero), suggesting that the deviation of the marginal utility from the mean is positive on average
for each attribute. The nested logit model yields an estimated average demand elasticity of 20.3,
which is unbelievably small compared to previous estimates; the BLP estimate of 220.6 is
Table 1
a
Nested logit and BLP demand results
Variable Nested logit BLP
4
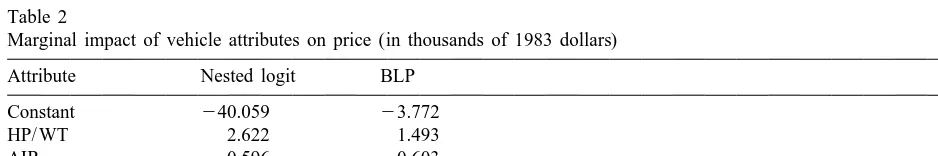
unbelievably large. Though the two models have different dependent variables, we can compare the magnitudes of the coefficients by looking at the average marginal impact of the vehicle attributes on price. In Table 2, the estimates of the marginal utilities of the attributes are divided by the marginal utility of price to obtain a dollar measure of the value of the attributes.
When predicting market shares using the nested logit model, the expected value of the unobservable term is assumed to be zero; as explained above, this is not strictly true, but the nesting structure does partially eliminate the endogeneity problem. Predicting market shares using the BLP model requires explicitly accounting for the expected value of the unobservable term, given price. This expected value is found by solving iteratively for the delta that makes the simulated market shares equal to the observed shares, where delta is the sum of the impact of all observed and unobserved car characteristics on utility; the contributions of the observed attributes are then subtracted from delta. To compare the out-of-sample prediction power of the two models, the parameters were estimated using only the data from 1971 to 1989, and the predicted market shares using the 1990 data were compared to the actual shares. For the linearized nested logit model, the mean squared prediction error
25 25
is 2.2310 ; for the Berry–Levinsohn–Pakes model, it is 7.3310 . Both models tend to overpredict
market shares; the difference in prediction accuracy primarily results from the tendency of the BLP model to overpredict hugely for models with tiny market shares. To compare the in-sample prediction power, we compare the predicted versus actual shares for 1989. In this case, the mean squared errors
25 25
for the nested logit and BLP models are 1.9310 and 6.7310 , respectively.
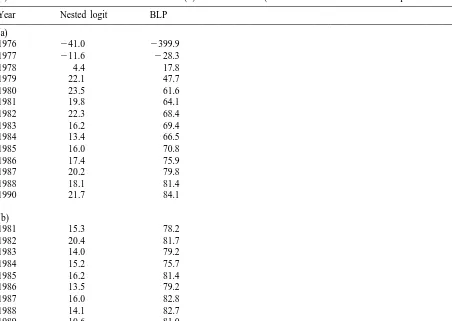
To determine how well the two models predict market shares for particular cars, we look at the Honda Accord (Table 3a), which experienced relatively large changes in price almost every year, and at the Ford Escort (Table 3b), which had a relatively constant price. The preponderance of positive errors demonstrates that both models tend to underpredict the market shares of these very popular cars. The nested logit model predicts better for the Escort with its smooth pricing than for the Accord, as we might expect, and the nested logit outperforms the BLP model in both cases. Finally, we compare the performance of the two models in predicting the total market share of each origin and class of automobiles (Table 4). With the exception of small cars, the nested logit model greatly outperforms the BLP model at predicting total market shares of each classification.
Table 2
Marginal impact of vehicle attributes on price (in thousands of 1983 dollars)
Attribute Nested logit BLP
Table 3
(a) Prediction error for the Honda Accord and (b) the Ford Escort (% difference between actual and predicted shares)
Year Nested logit BLP
Prediction error by country of origin and market class (% difference between actual and predicted shares)
Actual Nested BLP Nested logit BLP
share logit prediction error prediction error
Origin
Domestic 79.16 79.16 60.07 0.03 24.07
European 4.90 5.21 23.74 27.65 2409.02
Japanese 15.42 15.13 15.93 1.83 222.63
Class
Small 46.22 45.76 45.63 1.10 0.59
Medium / large 39.42 39.90 26.94 21.15 31.69
5. Conclusions
The multinomial logit model is frequently used for modeling the demand for differentiated products but, because of the IIA assumption, has undesirable properties in this setting. This paper uses aggregate data on automobiles to compare two recently-proposed alternative models and finds that the nested logit model appears to be generally preferable. Further work is needed to explain the surprisingly low prediction power of the BLP model.
Acknowledgements
This work was supported by a National Science Foundation graduate fellowship and a grant from the MIT World Economy Lab. I thank Glenn Ellison, Avinash Dixit and an anonymous referee for their extensive comments and advice; any remaining errors are my own. The views expressed herein are those of the author and do not necessarily reflect the views of the Bureau of Economics, the Federal Trade Commission, or any individual Commissioner.
References
Berry, S., 1994. Estimating discrete-choice models of product differentiation. RAND Journal of Economics 25 (2), 242–262. Berry, S., Levinsohn, J., Pakes, A., 1995. Automobile prices in market equilibrium. Econometrica 63 (4), 841–890. Goldberg, P.K., 1995. Product differentiation and oligopoly in international markets: the case of the US automobile industry.