12th UBAYA INTERNATIONAL ANNUAL SYMPOSIUM ON MANAGEMENT
ISBN: 978-979-99365-9-2 448
Empirical Evidence of Private Debts in Indonesia
Erick SugitoSuharso Alumnus of Surabaya University
Deddy Marciano Surabaya University [email protected]
EndangErnawati Surabaya University [email protected]
Abstract- This study aims to examine the effect of firm size, fixed asset ratio, market to book value of equity ratio, debt maturity, and public ownership to the use of private debt on corporate manufacturing sector in IDX the period 2010-2012. This study uses the quantitative approach to multiple linear regression analysis model. The study findings suggest that firm size significant positive effect on the use of private debt, firm size quadratic significant negative effect on the use of private debt, fixed asset ratio exhibited significantly positive effect on the use of private debt, market to book value of equity ratio is not significant positive effect on the use of private debt and significant positive effect on the use of private debt, debt maturity exhibited significantly positive effect on the use of private debt and not significant positive effect on the use of private debt, public ownership exhibited is significantly positive effect on the use of private debt.
Keywords: Private Debt, Asymmetric Information Theory, Agency Theory.
Background
According to creditor, debt can be categorised into two different kinds of type namely private debt and public debt. Private debt is a loan that can be given by finance institution to private firm while public debt is a loan that can be given by society to firm. James and Weir (1988) explained compared to public debt, private debt had several advantages.
First of all, private debt is able to reduce asymmetric information compared with public debt. The opinion was supported by Eugene Fama (1985) who said private debt had an information access consisting the borrowers while public debt was unable to have it. On the other hand, if an individualowns to the society (public debt), the information regarding borrowers would be difficult to get or could be controlled through debt rating government agencies, analyst’ reports, and independent auditor. Secondly, the finance institution has a better position to monitor regarding borrowers compared to obligation security issuer. Thirdly, the finance institution is able to keep firm secret like firm investment opportunity. Lastly, by using private debt, someone could avoid a longer process and higher cost than public debt issuer.
Some researchers have discussed about loan structure such as (Denis danMihov, 2003), (Krishnaswarni, SpindtdanSubramaniam, 1998), (Dhaliwal, Inder, danRaynolde, 2002), (Lin, Ma, and Xuan, 2013), are bank loans different?: Some evidence from the stock market (James and Weir, 1988), public debt, bank debt, and non-bank private debt in emerging and developed financial markets (Yu, Johnson, andTzon, 2008).
12th UBAYA INTERNATIONAL ANNUAL SYMPOSIUM ON MANAGEMENT
ISBN: 978-979-99365-9-2 449
Theoretical Study
A major firm size is described with more stable free cash flowdue to fixed targets in a particular market that leads to steady sale. On the other hand, bank does not allow big loan to big firms because big firms which collapse would possibly affect bank losing considerable money. Therefore, big firms will prefer public debt (Dennis and Mihov, 2003). Small firms tend to experience unstable free cash flow. This condition is caused by the limited circumstances where thesefirms operate. Furthermore, small firms are difficult to get an access to capital market (public debt), like huge cost of capital/flotation cost. Hence small firms prefer to use private debt (Denis and Mihov, 2003). It is hypothesized that the firm size is indicated to influence negative effect on private debt usage.
Firm size in quadratic would determine the loan capability to private debt or public debt. Quadratic model would explain from two sides. The first one is positive linear, a small firm using private debt, because there is limitation to access the capital market because of flotation cost. When the firm size reaches some particular point, new firm can access to capital market and automatically decrease its portion of private debt utilisation.
Finance institution (bank) needs fixed assets as a guarantee when firm utilise private debt (Madura, 2007: p394), similar with the opinion, Yu Johnson, and Tzon (2008). The reason why bank needs guarantee is because when bank gives a loan to medium quality borrowers, then bank needs to make sure that the loan has to be secured with collateral (Denis and Mihov, 2003). To sum up, it is hypothesized that tangible asset is assumed to positively affect private debt usage.
According to Jansen in Fatmasari (2010), firms with high investment opportunity experience enormous growth and active investigation. High investigation activities will respond the increasing of opportunity. When the opportunity is increasing, manager would manage the whole projects with high NPV. This is because other managers want to control big assets that suit their remuneration. This leads managers to choose projects which are suitable with managers’ wants, unfortunately the stockholders’ wants are not always the same as the managers. This leads to agency problem that can be reduced if the stockholder apply cross monitoring through private debt. As a result, the company with high investment would prefer to use private debt. Private debt usage is able to monitor every decision made by manager (Denis and Mihov, 2003; Krishnawarni, et al, 1998). From this explanation, it can be hypothesized that the growth opportunity seems to be positive relationship to private debt user.
Debt maturity is a date when lenders will get the repayment including the loan interest. Debt maturity can be measured by long term debt ratio toward the total debt (Lin, Ma, and Xuan, 2013). The payment due varies from 365 days to 5 years. The bigger debt maturity the major the uncertainty. The bank does not allow to give uncertain loan because the bank fund resources do not want to experience the uncertainty. The resources are from short term income like deposit, savings, etc. The bank funding resources can only be given to short term loan too (James and Weir, 1988). Therefore this research hypothesizes that debt maturity is indicated negative regarding the private debt usage.
The big stockholder prefers to choose private debt as firm funding because the stockholder wants the third person or institution which can monitor the decision made by manager, usually finance institution. With finance institution that monitors, it will reduce asymmetric information and agency problem (Meginson, 1997). Therefore, it is hypnotized that public ownership shows positive relation to the private debt usage.
Explanation and Result
12th UBAYA INTERNATIONAL ANNUAL SYMPOSIUM ON MANAGEMENT
ISBN: 978-979-99365-9-2 450
This means that big firms experience stable sale which produces abundant free cash flow. abundant free cash flow is more likely used by managers to their own interest (contradictory practice in order to hold the stockholder), such as upgrading facilities, selling firm’s product cheaply to another firm which belongs to the same manager. Hence, private debt has monitoring position where stockholder do their cross monitoring through private debt because it is more concerned about borrower compared with public debt.
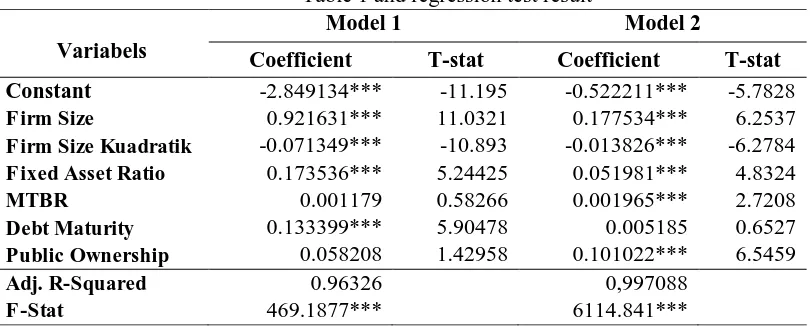
Table 1 and regression test result
Variabels
Model 1 Model 2
Coefficient T-stat Coefficient T-stat Constant -2.849134*** -11.195 -0.522211*** -5.7828 Firm Size 0.921631*** 11.0321 0.177534*** 6.2537 Firm Size Kuadratik -0.071349*** -10.893 -0.013826*** -6.2784 Fixed Asset Ratio 0.173536*** 5.24425 0.051981*** 4.8324
MTBR 0.001179 0.58266 0.001965*** 2.7208
Debt Maturity 0.133399*** 5.90478 0.005185 0.6527 Public Ownership 0.058208 1.42958 0.101022*** 6.5459
Adj. R-Squared 0.96326 0,997088
F-Stat 469.1877*** 6114.841***
FIRM SIZE QUADRATIC variable in model 1 and 2 influenced significantly negative to private debt within quadratic. This relationship is matching with Yu, Johnson, and Tzon ( 2008); Lin, Ma, Xuan’s research (2013) which said found significant positive while Denis and Mihov (2003); James danWier (1988); Krishnaswarni, Spind, and Subramaniam (1999); Dhaliwal, Inder, and Raynolde (2011) found significant negative.
This means small firm will utilise private debt but, when the company is growing in a particular point, it will reduce private debt slowly and start using public debt. The similarity regression private debt model 1 is Ltl/Ltd = -2.849134 + 0.921631 FIRMSIZE – 0.071349 FIRM SIZE KUADRATIK, then using derivative function Ltl/Ltd’ = 0.921631 – 0.142698 LTA. The result from LTA is = 0.921631 / 0.142698 = 6.458611. Therefore, the optimal point is approximately 6.458611 or in the asset value is IDR 2,874,822,266,766 / IDR 2,87trillion.
The TANGIBLE ASSET period in model 1 and 2 shows significant positive impact to private debt. This is matching with Yu, Johnson, and Tzon’s research (2009) which said the significant positive effect compared to significant negative which was said by Denis and Milhov (2013), Dhaliwal, Inder and Raynolde (2011).
Firms which own fixed assets tent to utilise private debt usage. It means the bigger the owned asset, the bigger its proportion of private debt. This condition appears because the frim with growing asset is easier to get loan because the value of asset used to guarantee is bigger accompanied by bank or finance institution’s big trust.Madura (2007: p394; Yu, Johnson, and Tzon, 2008) said that the bank needs real terms of guarantee when they agree to give loan to a company.
According to t-test, the hypothesis which says that Market to book value of equity ratio (MTBR) in model 1 affecting positive influence private debt user is rejected while MTBR in model 2 sees there is a positive and significant relationship in private debt usage. This is similar with Dhaliwal, Inder and Raynolde (2011); Yu, Johnson, and Tzon (2008); Krishnaswarni, Spindt, and Subramaniam’s research (1999)which said that market to book value of equity ratio influenced positive impact to private debt usage.
12th UBAYA INTERNATIONAL ANNUAL SYMPOSIUM ON MANAGEMENT
ISBN: 978-979-99365-9-2 451
reduced when the stockholder operate cross monitoring through private debt. As a result, firms with high growth opportunity tend to choose private debt. Using private debt allows them to monitor every decision made by manager.
Debt Maturity in model 2 brings significant positive to private debt usage while Debt Maturity in model 2 shows positive but not significant result. This is contradictory with James and Wier’s research (1988) which resulted significant negative impact on private debt usage. The longer maturity the bigger the uncertainty the debt repayment. Because of that monitoring is needed. Monitoring aims to control the availability of debt repayment. During controlling process, bank can evaluate the firm loan that make them able to reduce the uncertainty.
According to the regression result, there is a hypothesis describes Public Ownership in model 1 showing positive impact to private debt is rejected, while Public Ownership in model 2 results significant and positive impact to private debt. This means stockholder prefers to choose private debt as source of funding. The bigger the public stock ownership the bigger the mechanism of controlling management behaviour. The existence of public stockholder will ease monitoring, intervention or some discipliner impact to managers resulting appropriate acts as the stockholder wants. The public stockholder wants the third person, which is the finance institution to monitor every decision made by manager. By corporation with finance institution, the asymmetric information and agency problem can hopefully be reduced.
Conclusions
The study found that firm size significant positive effect on the use of private debt model 1 and 2, firm size quadratic significant negative effect on the use of private debt model 1 and 2, fixed asset ratio exhibited significantly positive effect on the use of private debt model 1 and 2, market to book value of equity ratio is not significant positive effect on the use of private debt model 1 and significant positive effect on the use of private debt model 2, debt maturity exhibited significantly positive effect on the use of private debt model 1 and not significant positive effect on the use of private debt model 2, public ownership exhibited is not significantly positive effect on the use of private debt model 1 and significantly positive effect on the use of private debt model 2.
Reference
Arthur Keown J, David Scott F, Jhon Martin D, William Petty J, 2002, Dasar– DasarManajemenKeuangan, Terjemahan Indonesia, PenerbitSalembaEmpat, Jakarta.
Atmojo, I., 2004, PenilaianHargaPinjamanKorporasi :StudiEmpiris di Indonesia, Skripsi, unpublished.
Bank Indonesia, 2003, Peraturan Bank Indonesia no. 5/8/PBI/2003 tentangpenerapanmanajemenrisikobagi bank umum.
Bolton, P. dan D. Scharfstein, 1996, Optimal Debt Structure and the Number of Creditors, Journal of Political Economy 104: 1-25.
Boyd, J. H., and E. C. Prescott, 1986, Financial intermediary coalitions, Journal of Economic Theory 38 (2): 211–32.
Chung, Kee H, and Charoenwong, Charlie, 1991, “Investment Options, Assets in Place, and the Risk of Stocks”, Financial Management Vol. 20, No. 3.
Denis D.J., danMihov V.T, 2003, The choice between bank debt, non-bank private debt and public debt: evidence from new corporate borrowings. Journal of Financial Economics, 70 (1): 3-28.
Dhaliwal, Dan, InderKhurana, and Raynolde Pereira, 2011, “Firm Disclosure Policy and the Choice between Private and Public Debt.” Contemporary Accounting Research, Vol. 28, Issue 1: p.293–330
12th UBAYA INTERNATIONAL ANNUAL SYMPOSIUM ON MANAGEMENT
ISBN: 978-979-99365-9-2 452
Fatmasari, Rhini., 2010, Hubunganantara Growth Opportunity dengan Debt Maturity danKebijakanLeverage sertaFungsi Covenant dalamMengontrolKonflikKeagenanantara Shareholders danDebtholders. JurnalSimposiumNasionalAkuntansi XIII
Gujarati, D. N., 2004, Basic Econometrics, 4th Edition, McGraw-Hill.
Istiqomah, DyahFebriantina., 2010, AnalisisPengaruhProfitabilitas, Solvabilitas, Likuiditas, danKepemilikanPublikTerhadapKeterlambatanPublikasiLaporanKeuangan. Skripsi. Surakarta :EkonomiUniversitasSebelasMaret.
Hadi, SyamsuldanAtikaAnggraeni., 2008, PemilihanPrediktorTerbaik, Perbandinganantara The Zmijewski Model, The Altman Model dan The Springate Model, JurnalAkuntansidan Auditing Indonesia,Vol 12 No 2.
Huda, Nuruldan Mustafa Edwin Nasution., 2007, InvestasipadaPasar Modal Syariah, Jakarta: KencanaPranada Media Group.
James, C. dan P. Weir., 1988, "Some Evidence of the Uniqueness of Bank Loans," Journal of Financial Economics: 217-235.
Jensen, M. and Meckling, W., 1976, Theory of the Firm: Managerial Behaviour, Agency Costs, and Ownership Structure. Journal ofFinancial Economics: 305-360.
Krishnaswami, S., P. Spindt, and V. Subramaniam., 1999, “Information Asymmetry, Monitoring, and the Placement Structure of Debt," Journal of Financial Economics 51: 407-434.
Lin, C., Y. Ma, P. Malatesta, and Y. Xuan., 2013, “Corporate Ownership Structure and the Choice Between Bank Debt and Public Debt," Journal of Financial Economics Forthcoming.
Limtiono, V., Marciano, D., &Ernawati, E., 2013 Mar 1., “Faktor-Faktor yang MempengaruhiDebt MaturitypadaPeminjamKorporasi di Asia PasifikPeriode 2006-2010.” Calyptra :JurnalIlmiahMahasiswaUniversitas Surabaya, Vol.2 no.1.
Madura, Jeff., 2000, International Finance, 6th edition. United States of America South: Western Publishing.
Madura, Jeff., 2007, PengantarBisnis, edisikeempat, Jakarta: SalembaEmpat: 394.
Manurung, Adler Haymans, Prof Dr., 2012, TeoriKeuangan Perusahaan, EdisiPertama, Jakarta: Penerbit PT Adler Manurung Press.
Marciano, D., 2008, PengaruhAsimetriInformasi, Moral Hazard, danStrukturPendanaanDalamPenentuanHargaKorporasiDalamBentuk US Dolar, Working paper, Disertasi, unpublished.
Martono, Harjito, Agus., 2002, ManajemenKeuangan, EdisiPertama, PenerbitEkonisiaFakultasEkonomi UI, Yogyakarta.
Megginson, William L., 1997, Corporate Finance. Addison-Wesley, Reading, M.A.
Myers, S.C., 1977, “The Determinant of Corporate Borowing,” Journal of Financial Economics 5: 147-176.
Ningrum, K.I., 2011, AnalisisPengaruhInvestment Opportunity Set (IOS) TerhadapaReturn Saham Perusahaan. SkripsiDipublikasikan. Surakarta: UniversitasSebelasMaret Surakarta.
Pranata, Y., 2007, PengaruhPenerapan Corporate Governance TerhadapKinerjaKeuangan Perusahaan. SkripsiTidakDipublikasikan. Yogyakarta: Universitas Islam Indonesia.
Munawir, S., 2004, AnalisisLaporanKeuangan, Edisi Ke-4, Liberty, Yogyakarta. IkatanAkuntansi Indonesia (IAI). 2004. PernyataanStandarAkuntansiKeuangan (PSAK ). Jakarta: SalembaEmpat.
Saputri, Ririn., 2011, PengaruhKarakteristik Perusahaan TerhadapPengungkapanTanggungJawabSosial Perusahaan Pada Perusahaan Manufaktur Yang Terdaftar di Bursa Efek Indonesia. SkripsiDipublikasikan. Medan: Universitas Sumatera Utara.
Sartika, 2012, PengaruhUkuran Perusahaan danRasioHutangterhadapPerataanLabapada Perusahaan Tekstildan Garment yang Terdaftar di Bursa Efek Indonesia. Bandung: UniversitasKomputer Indonesia.
12th UBAYA INTERNATIONAL ANNUAL SYMPOSIUM ON MANAGEMENT
ISBN: 978-979-99365-9-2 453
Setiawan, Rahmat., 2006, Faktor-faktor yang MempengaruhiStruktur Modal dalamPerspektif Pecking Order Theory PadaIndustriMakanandanMinuman di Bursa Efek Jakarta. Surabaya. MajalahEkonomi.
Smart, S.B., and Megginson, Gitman., 2009, Corporate Finance. Ohio: South-Western, Thomson Learning: Mason.
Smith Jr. C. W., dan R.L. Watts., 1992, “The investment Opportunity Set and Corporate Financing, Dividend, and Compensation Policies,” Journal of Financial Economics 13: 187-221.
Soemarso, 2004, AkuntansiSuatuPengantar (Buku1). Ed:5Revisi. Jakarta: SalembaEmpat.
Sofi, 2012, Faktor-Faktor yang Mempengaruhi Debt Maturity padaPinjamanKorporasi di Indonesia Periode 2000-2010, Skripsi, Universitas Surabaya.
Supardidan Sri Mastuti. 2003. ValiditasPenggunaan Z-Score Altman UntukMenilaiKebangkrutanPada Perusahaan Perbankan Go Publik di Bursa Efek Jakarta. DalamKompak No. 7. Januari-April, hal 10.
Yu, H.C., Johnson, K.H., danTzon.D., 2008, “Public debt, bank debt, and non-bank private debt in emerging and developed financial markets.” Bank and Bank Systems, Vol81 : 607-636. Wendiana, Adetyas, 2009, Credit Analysis Bank X to the Acquisition Plan of Debtor with Financing
Resource from Right Issue of Stocks – Case Study PT Leyand International Tbk. Jakarta: Universitas Indonesia.
White, Halbert, AHeteroscedasticity-Consistent Covariance Matrix Estimator and a Direct Test for Heteroscedasticity, in Econometrica, Vol. 48, 1980, 817-838 (Cambridge, MA: MIT Press, 1980)
1
GENERAL INSTRUCTIONS
1.1
Type area
The text should fit exactly into the type area of 187
×
272 mm (7.36"
×
10.71"). For correct settings of
margins in the Page Setup dialog box (File menu)
see Table 1.
1.2
Typefont, typesize and spacing
Use Times New Roman 12 point size and 13 point
line spacing (Standard;text tag). Use roman type
ex-cept for the headings (Heading tags), parameters in
mathematics (not for log, sin, cos, ln, max., d (in dx),
etc), Latin names of species and genera in botany
and zoology and the titles of journals and books
which should all be in italics. Never use bold, except
to denote vectors in mathematics. Never underline
any text. Use the small font (10 points on 11 points)
for tables (Table tags), figure captions (Figure
cap-tion tag) and the references (Reference text tag).
Never use letterspacing and never use more than
one space after each other.
2
GETTING STARTED
2.1
Preparing the new file with the correct template
Copy the template file B2ProcA4.dot (if you print on
A4 size paper) or B2ProcLe.dot (for Letter size
pa-per) to the template directory. This directory can be
found by selecting the Tools menu, Options and then
by tabbing the File Locations. When the Word
pro-gramme has been started open the File menu and
choose New. Now select the template B2ProcA4.dot
or B2ProcLe.dot (see above). Start by renaming the
document by clicking Save As in the menu Files.
Name your file as follows: First three letters of the
file name should be the first three letters of the last
name of the first author, the second three letters
should be the first letter of the first three words of
the title of the paper (e.g. this paper: balpcc.doc).
Now you can type your paper, or copy the old
ver-sion of your paper onto this new formated file.
2.2
Copying old text onto new file
Open your old file and the new file. Switch between
these two with the Window menu. Select all text of
the old file (excluding title, authors, affiliations and
abstract) and paste onto bottom of new file, after
having deleted the word INTRODUCTION (see also
section 2.5). Check the margin setting (Page Setup
dialog box in File menu) and column settings (see
Table 1 for correct settings). After this copy the texts
which have to be placed in the frames (see sections
2.3 and 2.4 ). In order to avoid disruption of the text
and frames, copy these texts paragraph by paragraph
without including the first word (which includes the
Preparing a two column paper with MS Word for Windows
A.T. Balkema & G. Westers
A.A. Balkema Publishers, Rotterdam, Netherlands
B. Unknown
New Institute, Gouda, Netherlands
Table 1. Margin settings for A4 size paper and letter size * Column dialog box in Format menu.
old tag). It is best to first retype the first words
man-ually and then to paste the correct text behind. When
the new file contains all the text, the old tags in the
text should be replaced by the new Balkema tags
(see section 3). Before doing this apply automatic
formatting (AutoFormat in Format menu).
2.3
Title, author and affiliation frame
Place the cursor on the T of Title at the top of your
newly named file and type the title of the paper in
lower case (no caps except for proper names). The
title should not be longer than 75 characters). Delete
the word Title (do not delete the paragraph end).
Place the cursor on the A of A.B.Author(s) and type
the name of the first author (first the initials and then
the last name). If any of the co-authors have the
same affiliation as the first author, add his name
af-ter an & (or a comma if more names follow). Delete
the words A.B. Author etc. and place the cursor on
the A of Affiliation. Type the correct affiliation
(Name of the institute, City, State/Province,
Coun-try). Now delete the word Affiliation. If there are
au-thors linked to other institutes, place the cursor at the
end of the affiliation line just typed and give a
re-turn. Now type the name(s) of the author(s) and after
a return the affiliation. Repeat this procedure until
all affiliations have been typed.
All these texts fit in a frame which should not be
changed (Width: Exactly 187 mm (7.36"); Height:
Exactly 73 mm (2.87") from top margin; Lock
an-chor).
2.4
Abstract frame
If there are no further authors place the cursor one
space behind the word ABSTRACT: and type your
abstract of not more than 150 words. The top of the
first line of the abstract will be 73 mm (2.87") from
the top of the type area. The complete abstract will
fall in the abstract frame, the settings of which
should also not be changed (Width: Exactly 187 mm
(7.36"); Height: Automatic; Vertical 73 mm (2.87")
from margin; Lock anchor).
2.5
First line of text or heading
If your text starts with a heading, place the cursor on
the I of INTRODUCTION and type the correct text
for the heading. Now delete the word
INTRODUC-TION and start with the text after a return. This text
should have the tag First paragraph.
If your text starts without a heading you should
place the cursor on the I of INTRODUCTION,
change the tag to First paragraph and type your text
after deleting the word INTRODUCTION.
3
LAYOUT OF TEXT
3.1
Text and indenting
Text is set in two columns of 9 cm (3.54") width
each with 7 mm (0.28") spacing between the
col-umns. All text should be typed in Times New
Ro-man, 12 pt on 13 pt line spacing except for the paper
title (18 pt on 20 pt), author(s) (14 pt on 16 pt), and
the small text in tables, captions and references (10
pt on 11 pt). All line spacing is exact. Never add any
space between lines or paragraphs. When a column
has blank lines at the bottom of the page, add space
above and below headings (see opposite column).
First lines of paragraphs are indented 5 mm (0.2")
except for paragraphs after a heading or a blank line
(First paragraph tag).
3.2
Headings
Type primary headings in capital letters roman
(Heading 1 tag) and secondary and tertiary headings
in lower case italics (Headings 2 and 3 tags).
Head-ings are set flush against the left margin. The tag
will give two blank lines (26 pt) above and one (13
pt) beneath the primary headings, 1½ blank lines (20
pt) above and a ½ blank line (6 pt) beneath the
sec-ondary headings and one blank line (13 pt) above the
tertiary headings. Headings are not indented and
nei-ther are the first lines of text following the heading
indented. If a primary heading is directly followed
by a secondary heading, only a ½ blank line should
be set between the two headings. In the Word
pro-gramme this has to be done manually as follows:
Place the cursor on the primary heading, select
Para-graph in the Format menu, and change the setting for
spacing after, from 13 pt to 0 pt. In the same way the
setting in the secondary heading for spacing before
should be changed from 20 pt to 7 pt.
3.3
Listing and numbering
3.4
Equations
Use the equation editor of the selected word
pro-cessing programme. Equations are not indented
(Formula tag). Number equations consecutively and
place the number with the tab key at the end of the
line, between parantheses. Refer to equations by
these numbers. See for example Equation 1 below:
From the above we note that sin
θ
= (x + y)z or:
interface; and k
1= shear stiffness number.
For simple equations in the text always use
super-script and subsuper-script (select Font in the Format
menu). Do not use the equation editor between text
on same line.
The inline equations (equations within a
sen-tence) in the text will automatically be converted to
the AMS notation standard.
3.5
Tables
Locate tables close to the first reference to them in
the text and number them consecutively. Avoid
ab-breviations in column headings. Indicate units in the
line immediately below the heading. Explanations
should be given at the foot of the table, not within
the table itself. Use only horizontal rules: One above
and one below the column headings and one at the
foot of the table (Table rule tag: Use the Shift-minus
key to actually type the rule exactly where you want
it). For simple tables use the tab key and not the
ta-ble option. Type all text in tata-bles in small type: 10
on 11 points (Table text tag). Align all headings to
the left of their column and start these headings with
an initial capital. Type the caption above the table to
the same width as the table (Table caption tag). See
for example Table 1.
3.6
Figure captions
Always use the Figure caption style tag (10 points
size on 11 points line space). Place the caption
un-derneath the figure (see Section 5). Type as follows:
‘Figure 1. Caption.’ Leave about two lines of space
between the figure caption and the text of the paper.
3.7
References
In the text, place the authors’ last names (without
in-itials) and the date of publication in parentheses (see
examples in Section 5). At the end of the paper, list
all references in alphabetical order underneath the
heading REFERENCES (Reference heading tag).
The references should be typed in small text (10 pt
on 11 pt) and second and further lines should be
in-dented 5.0 mm (0.2") (Reference text tag). If several
works by the same author are cited, entries should be
chronological:
Larch, A.A. 1996a. Development ... Larch, A.A. 1996b. Facilities ... Larch, A.A. 1997. Computer ...
Larch, A.A. & Jensen, M.C. 1996. Effects of ... Larch, A.A. & Smith, B.P. 1993. Alpine ...
3.7.1
Typography for references
Last name, First name or Initials (ed.) year. Book title. City: Publisher.
Last name, First name or Initials year. Title of article. Title of
Journal (series number if necessary) volume number (issue
number if necessary): page numbers.
3.7.2
Examples
Grove, A.T. 1980. Geomorphic evolution of the Sahara and the Nile. In M.A.J. Williams & H. Faure (eds), The Sahara and
the Nile: 21-35. Rotterdam: Balkema.
Jappelli, R. & Marconi, N. 1997. Recommendations and preju-dices in the realm of foundation engineering in Italy: A his-torical review. In Carlo Viggiani (ed.), Geotechnical
engi-neering for the preservation of monuments and historical sites; Proc. intern. symp., Napoli, 3-4 October 1996.
Rot-terdam: Balkema.
Johnson, H.L. 1965. Artistic development in autistic children.
Child Development 65(1): 13-16.
Polhill, R.M. 1982. Crotalaria in Africa and Madagascar. Rot-terdam: Balkema.
3.8
Notes
These should be avoided. Insert the information in
the text. In tables the following reference marks
should be used: *, **, etc. and the actual footnotes
set directly underneath the table.
3.9
Conclusions
Conclusions should state concisely the most
im-portant propositions of the paper as well as the
au-thor’s views of the practical implications of the
re-sults.
4
PHOTOGRAPHS AND FIGURES
left margin. Leave about two lines of space between
the actual text and figure (including caption).
Nev-er place any text next to a figure. Leave this space
blank. The most convenient place for placing figures
is at the top or bottom of the page. Avoid placing
text between figures as readers might not notice the
text. Keep in mind that everything will be reduced to
75%. Therefore, 9 point should be the minimum size
of the lettering. Lines should preferably be 0.2 mm
(0.1") thick. Keep figures as simple as possible.
Avoid excessive notes and designations.
Figure 1. Caption of a typical figure. Photographs will be scanned by the printer. Always supply original photographs.