REGULAR ARTICLE
Impacts of urea N addition on soil microbial community
in a semi-arid temperate steppe in northern China
Naili Zhang&Shiqiang Wan&Linghao Li&Jie Bi& Mingming Zhao&Keping Ma
Received: 12 November 2007 / Accepted: 13 May 2008 / Published online: 13 June 2008
#Springer Science + Business Media B.V. 2008
Abstract Nitrogen (N) addition has been well docu-mented to decrease plant biodiversity across various terrestrial ecosystems. However, such generalizations about the impacts of N addition on soil microbial communities are lacking. This study was conducted to examine the impacts of N addition (urea-N fertilizer) on soil microbial communities in a semi-arid temper-ate steppe in northern China. Soil microbial biomass carbon (C), biomass N (MBN), net N mineralization and nitrification, and bacterial and fungal community level physiological profiles (CLPP) along an N addition gradient (0–64 g N m−2 year−1) were
measured. Three years of N addition caused gradual or step increases in soil NH4-N, NO3-N, net N
mineralization and nitrification in the early growing season. The reductions in microbial biomass under high N addition levels (32 and 64 g N m−2year−1) are
partly attributed to the deleterious effects of soil pH. An N optimum between 16 and 32 g N m−2year−1in
microbial biomass and functional diversity exists in
the temperate steppe in northern China. Similar N loading thresholds may also occur in other ecosys-tems, which help to interpret the contrasting observa-tions of microbial responses to N addition.
Keywords CLPP. Microbial biomass . N addition . Net N mineralization . Nitrification
Introduction
Global nitrogen (N) enrichment resulting from an-thropogenic activities can have profound impacts on the structure and function of terrestrial ecosystems. As one of the essential components in terrestrial ecosys-tems, soil microorganisms have been documented to respond to N enrichment in soils deriving from N addition or deposition (Fisk and Schmidt 1996; Michelsen et al. 1999; Stevens et al. 2004; Hines et al.2006). In addition, soil microorganisms that have a high turnover rate can be changed by N addition in a relatively shorter time in comparison with plant communities (Bradley et al. 2006). The changes in soil microbial communities can consequently induce shifts in soil-based ecosystem processes, i.e., decom-position (Gallo et al. 2004; Liu et al. 2006), carbon (C) fixation (Frey et al.2004) and N cycling (Fisk and Schmidt 1996; Bardgett and Shine1999; Bardgett et al. 2002), and then feedback to aboveground plant communities. Given the important roles of soil microorganisms in terrestrial ecosystems, a better DOI 10.1007/s11104-008-9650-0
Responsible Editor: Lars Jensen.
N. Zhang
:
S. Wan:
L. Li:
J. Bi:
K. Ma (*)Key Laboratory of Vegetation and Environmental Change, Institute of Botany, Chinese Academy of Sciences, No.20, NanXinCun, Xiangshan,
Beijing 100093, China e-mail: [email protected]
M. Zhao
understanding of how soil N enrichment influences soil microbial communities is essential for explana-tion of changes in ecosystem structure and funcexplana-tion.
Soil microbial community level physiological profiles (CLPP) via Biolog assay providing a wide set of compounds can be used to estimate the relative potential metabolic versatility (Gomez et al. 2006) and provide further information on the microbial community responses to N addition. Yet previous observations call into question whether N addition has positive or negative effects on soil microbial commu-nities. Variations in the amount of N addition applied in different experiments may help to explain the controversial observations. For example, significant decreases in microbial CLPP under higher N addition levels (20 and 40 g N m−2year−1) were observed in a
pasture near Hamilton, New Zealand (Sarathchandra et al. 2001). However, significant increases in microbial CLPP under a lower N addition level (4 and 8 g N m−2year−1) were found in a healthland, and
no change in microbial CLPP was detected at a lower N addition rate (14 g N m−2year−1) in a soil-acidic
grassland at Wardlow Hay Cop, Derbyshire (Lee and Caporn 1998). Therefore, examination of the responses of soil microbial community along an N addition gradient in a single ecosystem may help to find a general pattern of microbial community response and to explain the contrasting observations among different studies and ecosystems.
As heterotrophs that depend on plants in acquiring C substrate, soil microorganisms can be both C- and N-limited (Gallardo and Schlesinger1992; Michelsen et al. 1999). Disproportional supplies of C or N resources may lead to shift from C-limitation to N-limitation or vice versa. Low-levels of N addition may stimulate microbial growth by ameliorating both N limitation through improving soil N availability and C limitation via stimulating plant growth and litter decomposition. However, extra N addition cannot only lead to C-limitation on microorganisms, but also result in reduced soil pH (Christie and Beattie1989; Malhi et al.1998). Microbial communities that have adapted to local habitat are sensitive to changes in soil pH (Schimel and Weintraub2003; Wang et al.2006; Kemmitt et al. 2006). Decreases in soil pH under high-level N addition may have a deleterious impact on soil microbial communities (Soderstrom et al. 1983; Schimel and Weintraub 2003; Kemmitt et al. 2006; Wang et al. 2006). Therefore, we hypothesize
that there is a threshold of N addition, at which microbial responses shift from positive to negative.
The temperate steppe in northern China represents one of the regional vegetation types of the Eurasian continent and plays an important role in the national stock breeding. Most of the local grasslands have suffered heavily from over-grazing since the early 1980s, resulting in severe land degradation and soil N deficiency (Christensen et al.2004; Yuan et al.2005, 2006). An N addition gradient ranging from 0 to 64 g N m−2 year−1 has been conducted for 3 years since
2003. The specific objective of this study was to test the hypothesis proposed in the previous paragraph: there is a critical N loading level that will trigger microbial responses along an N addition gradient in the temperate steppe. Due to close correlation of growing plants with soil N availability, it is difficult to distinguish between the direct effects of N addition on microbial communities and the indirect effects via altered plant communities. Therefore, we carried out this study in the early growing season to minimize the indirect effects of plant growth.
Materials and methods
Site description
The study site was located in Duolun County of Inner Mongolia, China (42°02′N, 116°16′E, 1,344 m a.s.l.). The climate belongs to the semi-arid monsoon climate of the moderate temperate zone. The long-term mean annual temperature is 2.1°C and the mean annual precipitation is 385 mm. The soil of the study site is sandy soil classified as chestnut soil according to the Chinese classification, or Calcic Luvisols according to the FAO classification with 69.21±0.06% sand, 15.60± 0.02% silt and 15.19±0.02% clay, respectively. The vegetation is typical steppe dominated by Stipa krylovii,Artemisia frigida, andAllium bidentatum.
smaller area of local grasslands and severe land degradation (Christensen et al. 2004; Yuan et al. 2005,2006). Since 2000, new bans on grazing have been carried out by the local government, but cattle and sheep grazing are still conducted in some areas of this region.
Experimental design and soil sampling
The experiment used a Latin square design with sixty-four 10×15 m plots arranged in eight rows and eight columns. In early July annually since 2003, each plot in each row was randomly assigned to one fertilizer treatment, 0, 1, 2, 4, 8, 16, 32, or 64 g N m−2year−1
(urea), which were denoted as N0, N1, N2, N4, N8,
N16, N32and N64, respectively. The distance between
plots was 4 m, and in each plot a buffer zone without N addition was set up 1 m inside. A simple ANOVA conducted on soil total N in 2003 showed no significant differences among different treatment plots.
Since the plots of the odd rows were clipped on 16 August 2005, soil samples were collected from half of the 64 plots (i.e., the 32 unclipped plots) with 4 replicates for each treatment (8 N treatments × 4 replicates) at the beginning of the growing season in May 2006. In order to avoid spatial heterogeneity, 3 cores (4.5 cm in diameter and 15 cm in depth) were collected along a diagonal line in each plot, and then completely mixed into one composite fresh sample. After removal of plant roots and large stones by sieving (sieve mesh 2 mm), the soil samples were packed in ice blocks and transported to the laboratory. Each sample was divided into three sub-samples, stored at 4°C (for max. 24 h after sampling), −20°C and air dried, respectively. Three of the four samples of each treatment stored at 4°C were chosen randomly to analyze microbial community level physiological profiles (CLPP). All four soil samples stored at−20°C were used to determine soil microbial biomass, net N mineralization and nitrification, while the air-dried samples were used to determine soil physicochemical properties.
Soil physicochemical properties and root biomass
A soil water mixture (1:2.5 soil to water ratio) and a glass electrode (Thermo Orion T20, USA) were used to determine soil pH. Soil samples were dried for 24 h
at 105°C to determine soil moisture. The air-dried samples, passed through a 0.5-mm sieve, were used to determine soil organic matter (SOM) and total N (TN). SOM was measured by the dichromate oxida-tion and titraoxida-tion method (Kalembasa and Jenkinson 1973), and TN was analyzed using Kjeldahl digestion method with an Alpkem autoanalyzer (Kjektec Sys-tem 1026 Distilling Unit, Sweden). Root biomass at 0–15 cm depth was measured by soil auger (7 cm in diameter).
Microbial properties
Net N mineralization and nitrification were deter-mined by laboratory incubations (Robertson et al. 1999). A flask covered with polyethylene film (permeable to O2and CO2but not to H2O) was filled
with a 10-g soil sample and placed in a humidified, darkened, 25°C incubator for 28 days. Inorganic N (NH4+-N and NO3−-N) in initial and incubated
samples were measured by extracting 10 g fresh soil with 100 ml 2 M KCl for 30 min on a reciprocating shaker, and then determined by a continuous-flow ion auto-analyzer (Scalar SANplus segmented flow ana-lyzer, Netherlands). We defined net nitrification as the difference in NO3−-N before and after the incubation,
and net N mineralization as the difference between total inorganic N (NH4+-N and NO3−-N) before and
after the incubation.
Microbial biomass carbon (MBC) and nitrogen (MBN) were determined by using the chloroform fumigation extraction method (Brookes et al. 1985; Vance et al. 1987). A 30-g soil composite sample from each of the 32 samples stored at −20°C was fumigated with alcohol-free CHCl3 for 24 h after
the samples were pre-incubated in a humidified, darkened, 25°C incubator for 7 days. Non-fumigated and fumigated samples were extracted by shaking them in 100 ml of 0.5 M K2SO4for 30 min, and then
Soil microbial community level physiological profiles (CLPP)
Bacterial and fungal CLPP were estimated using EcoPlates and FF plates, respectively. Further analysis was performed with the procedure described by Classen et al. (2003). Soil microbes were extracted from 4 g of the composite fresh sample with 36 ml of 50 mM K2HPO4 buffer (pH=6). Soil suspensions were then
shaken for 30 min on a reciprocal shaker. After settling for 30 min, the soil suspensions were diluted to 10−3
soil solution in sterile inoculating solution consisting of 0.40% NaCl and 0.03% Pluronic F-68 in deionized water. Fungal extractions were conducted using the protocols described above except that the inoculating solution contained streptomycin sulfate (1 µg per microtiter plate well) and chlortetracycline (0.5 µg per microtiter plate well) to inhibit bacterial growth. All solutions, transfer equipments, and glasswares were sterilized in advance with an autoclave.
Bacterial inoculations were accomplished by trans-ferring 150μl of solution to each of 96 wells in each
EcoPlate and fungal inoculations using only 100 μl
per well (Buyer et al. 2001; Donbranic and Zak 1999). All plates were placed in polyethylene bags to reduce desiccation while incubating. EcoPlates were incubated at 25°C for 96 h and FF plates were incubated at 25°C for 168 h, and all plates were estimated once for each 24 h.
Microbial activity expressed as average well-color development (AWCD) was determined for each microplate, according to Garland and Mills (1991) as follows:
AWCD¼X n
i¼1
xi c ð Þ=31;
where xi is the optical density value measured at 595 nm or 750 nm in substrate i in EcoPlates or FF plates respectively, and cis the value measured in the control well. The pattern of substrate utilization of each plate was expressed using transformed data calculated by dividing the raw difference value for each well by the AWCD of the plate: ðxi cÞ=Pðxi cÞ=31, and transformed
values of > 1 indicate that color responses are positive (Garland and Mills1991). Richness (R), as the number of oxidized carbon resources, was calculated using a transformed value of > 1 as the
threshold for positive response. Shannon–Wiener index (H) defining substrate richness and evenness was calculated as follows:
H ¼ X n
i¼1
piðlnpiÞ;
where pi is the ratio between the activity of each substrate and the sum of the activities of all substrates.
Statistical analyses
The data of soil physicochemical properties, AWCD, R, and H were analyzed by one-way analysis of variance (ANOVA) followed by Turkey’s HSD test with SAS 9.0. The multivariate data from CLPP were assessed by canonical correspondence analysis (CCA) with vegan package of R, which supports all basic ordination methods and functions for both fitting environmental variables and ordination graphics.
Results
Physicochemical properties
Soil NO3−-N increased gradually with the amount of N
addition, whereas soil NH4+-N concentrations showed
a step increase at the highest rate of 64 g N m−2year−1
(Table 1). The significant decreases in soil pH (P< 0.05) at high N addition rates (N32 and N64) were
observed.
Microbial biomass and activities
After 3 years of N addition, there was substantial variability in soil microbial biomass C across the 8 treatments with the greatest MBC under the N16
treatment, which was significantly higher than those under the N2 and N64 treatments. Soil microbial
biomass N slightly increased at the two low levels of N addition (N1 and N2), but decreased with the
p<0.01). No significant correlation between microbial biomass and root biomass in the previous year was observed (r2=0.08,P>0.05).
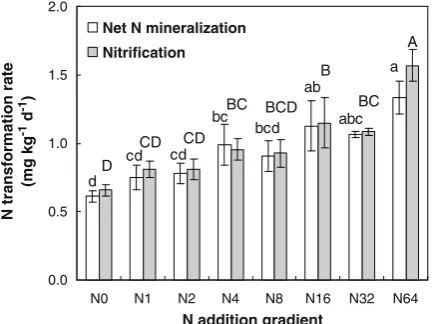
N addition significantly impacted N transformation processes (p<0.01 for net N mineralization and p< 0.001 for nitrification) incubated in the laboratory. Both net N mineralization and nitrification generally increased with the amount of N addition (Fig. 1).
Soil microbial community level physiological profiles
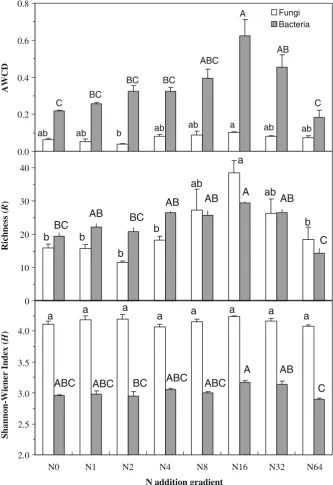
N addition had significant effects on AWCD,Rand H of bacterial communities (P<0.01). All the three parameters tended to increase along the low levels of N addition, peaked at the N addition rate of 16 g N m−2
year−1, and then decreased under the two highest N
addition levels. Bacterial AWCD under the N16 and
N32 treatments were significantly higher than those
under the control and the N64 treatments (P<0.05;
Fig. 2). Bacterial R in the N16 plots significantly
differed from those under the control, N2, and N64
treatments (P<0.05). Bacterial H was also greater under the N16than N2and N64treatments (P<0.05).
Fungal AWCD and R showed similar response patterns with those of bacteria along the N addition gradient (i.e., the greatest values occurring under the N16treatment and declining under the two highest N
addition levels). Differences in fungal AWCD were only detected between the N2 and N16 treatments
(Fig. 2 upper panel). Fungal R under the N16
treatment was significantly greater than those under the N0, N1, N2, N4, and N64treatments (Fig.2middle
panel). In contrast, N addition had little impact on fungal H (Fig. 2 lower panel). No correlations between root biomass of the previous year and bacterial (r=−0.299, P>0.05) or fungal functional diversity (r=−0.088,P>0.05) were observed.
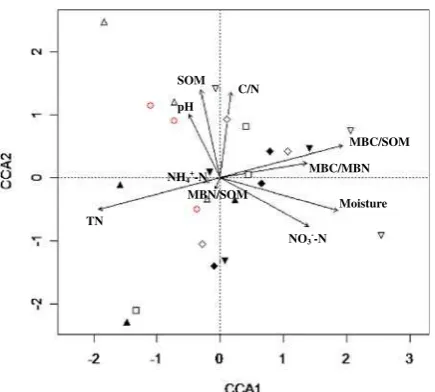
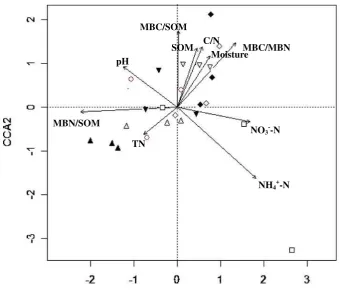
In order to better explain the bacterial and fungal CLPP, we used permutation tests of CCA to identify the controlling soil factors over microbial CLPP. Bacterial CLPP were greatly affected by soil moisture (P<0.05), TN (P<0.05), and MBC/SOM (P<0.05), whereas fungal CLPP were under the influence of NH4+-N (P< 0.001), MBN/SOM (P<0.01), MBC/
SOM (P<0.1), C/N (P<0.1) and MBC/MBN (P< 0.05). In the bacterial CCA biplot (Fig. 3), the N8,
N16, and N32 treatments were set apart from the
control along the first axis, respectively. In the fungal CCA biplot (Fig. 4), the N2, N4, N8, and N16
treatments were separated from the control along the first axis as well.
The substrates of each EcoPlate or FF plate can be divided into six different groups: polymers, d
cd cd bc
bcd ab
abc a
D
CD CD
BC BCD
A
BC B
0.0 0.5 1.0 1.5 2.0
N0 N1 N2 N4 N8 N16 N32 N64 N addition gradient
N transformation rate
(mg kg
-1 d -1)
Net N mineralization Nitrification
Fig. 1 Changes in net N mineralization and nitrification along the gradient of N addition. Data in the columns followed by the same capital letter (nitrification) or lower case letter (net N mineralization) are not significantly different (Turkey’s HSD test;P>0.05)
Table 1 Average soil microbial biomass and physicochemical characteristics values ± standard error with ANOVA results (n=4)
MBC (mg kg−1) MBN (mg kg−1) MBC/MBN NH4+- N (mg kg−1) NO3−-N (mg kg−1) pH SOM (g kg−1)
N0 273.92±59.97ab 88.02±2.95ab 3.18±0.77a 2.33±0.48b 7.30±0.52e 7.21±0.03ab 51.16±1.75a N1 285.71±23.06ab 91.50±2.71a 3.14±0.29a 2.61±0.72b 9.83±0.63de 7.23±0.05ab 50.26±3.56a N2 172.02±18.66b 93.69±5.40a 1.89±0.24a 1.95±0.11b 10.00±0.63de 7.29±0.03a 39.09±1.88a N4 287.49±50.23ab 86.05±4.09ab 3.43±0.66a 2.56±0.43b 11.45±0.44dc 7.24±0.01ab 52.26±3.69a N8 271.67±84.46ab 83.60±1.87ab 3.21±0.95a 2.57±0.80b 14.06±1.25c 7.20±0.01ab 49.38±1.91a N16 384.96±32.02a 81.31±3.18ab 4.82±0.53a 2.10±0.13b 18.09±0.66b 7.06±0.08b 60.18±15.91a N32 248.69±17.20ab 73.23±3.56b 3.42±0.25a 1.88±0.19b 24.20±0.57a 6.49±0.06c 51.71±2.20a N64 165.89±47.18b 36.01±1.65c 4.49±1.16a 8.60±0.27a 24.48±0.96a 6.03±0.08d 45.85±2.47a
carbohydrates, carboxylic acids, amino acids, amine/ amides, and miscellaneous. The CCA shows that the changes in polymers [Tween40 (P<0.05) and glycogen (P<0.001)], carbohydrates [D-Mannitol (P<0.05) and N-Acetyl-D-glucosamine (P<0.05)], carboxylic acids [D-Glucosaminic acid (P<0.05) and α-Keto butyric
acid (P<0.001)], amino acids [L-Arginine (P<0.05)
and L-Phenylalanine (P<0.01)], and miscellaneous [Glucose-1-phosphate (P<0.01) and D,L-α-Glycerol
phosphate (P< 0.001)] accounted greatly for the variations in bacterial CLPP, while the changes of carboxylic acids [Sebacic acid (P< 0.01), Fumaric acid (P< 0.05), N-Acetyl-L-glutamic acid (P< 0.01),
and Quinic acid (P< 0.01) and carbohydrates [D -Sorbitol (P< 0.01), D-Fructose (P< 0.01), L-Sorbose
(P< 0.05), D-Galactose (P< 0.05), D-Tagatose (P<
0.05) and Maltitol (P< 0.05)] accounted largely for the variations in fungal CLPP.
0 10 20 30 40
Richness (
R
)
b b
b
b b
ab
ab A
BC BC
AB
AB AB AB
C a
0.0 0.2 0.4 0.6 0.8
AWCD
Fungi Bacteria
C BC
BC BC
ABC A
AB
C
ab ab b ab ab a ab ab
2.0 2.5 3.0 3.5 4.0
N0 N1 N2 N4 N8 N16 N32 N64
N addition gradient
Shannon-Wiener Index (
H
)
a a a a a a a a
ABC ABC BC ABC ABC
A AB
C
Fig. 2 Changes in bacterial
Discussion
The effects of N addition on soil microbial biomass and activities
Soil microorganisms can be both C and N limited (Michelsen et al. 1999; Gallardo and Schlesinger 1992; Hines et al.2006). Under low soil N availabil-ity, plants and soil microorganisms compete for N during the growing season (Zak et al.1990; Williams et al. 2001). However, the non-growing season sampling in our study avoided competition between plants and soil microorganisms. In addition, no significant responses of MBN to enhancement of soil N availability were observed, even in such an N deficient steppe (Table1). Thus, N limitation for soil microbes is hardly possible in our study.
On the other hand, improved N availability and supplies might have shifted soil microbes from N limitation to C limitation (Fisk and Schmidt 1996; Johnson et al.1998) and possibly led to decreases in microbial biomass under the high N addition levels (Table1). The positive linear MBC–SOM relationship
observed in this study also supports the C-limitation hypothesis. However, contrary to this hypothesis, plant aboveground biomass in the previous years increased with the amount of N addition (Li et al., unpublished data), and there were no close correla-tions between MBC and root biomass, suggesting that C limitation to soil microbial biomass growth in the highest N addition plots could not occur either.
As mentioned above, neither N nor C availability appears to be driving microbial community response in the high level of N addition. Instead, change in soil pH greatly impact soil microbial growth and activities (Schimel and Weintraub 2003; Wang et al. 2006; Kemmitt et al. 2006). N fertilizer application in grasslands can stimulate nitrification and accumula-tion of NO3− (Xu and Coventry2003), and result in
soil acidification (Christie and Beattie1989; Malhi et al. 1998). In fact, both increased nitrification (Fig.1) and significant decreases in soil pH (Table 1) were observed in the study site under the N addition treatments of N32 and N64. Lower pH can suppress
microbial activities (Soderstrom et al. 1983; Schimel and Weintraub2003; Wang et al.2006) and growth of soil microorganisms (Kemmitt et al. 2006), and consequently leads to reductions in microbial biomass under the high N addition levels (Table 1).
The effects of N addition on soil microbial community level physiological profiles
Although they cannot reflect in situ functions of soil microorganisms, microbial CLPP do reflect the potentials of microbial metabolic diversity in soils and is useful for analyzing physiological character-istics of microbial community (Bardgett and Shine 1999; Mijangos et al.2006). In addition, the findings from Biolog assay can mirror the changes in microbial biomass (Johnson et al. 1998). Our study used Biolog data and attempted to detect the potential substrate utilization of microbial community. Similar to the responses of microbial biomass C along the N addition gradient, the CLPP of soil bacteria (AWCD, R, and H) and soil fungi (AWCD and R) peaked at 16 g N m−2year−1, and then declined under the higher
N addition levels (Fig.2). The separations of bacterial and fungal CLPP at the rate of 16 g N m−2 year−1
from the control in the CCA ordination biplots (Figs. 3 and 4) indicate significant differences in microbial CLPP between N16 treatments and the NO3
--N
Moisture TN
MBC/SOM C/N
MBC/MBN SOM
pH
NH4+-N MBN/SOM
Fig. 3 CCA ordination biplot of bacterial CLPP for the 24
control as well. The above observations strongly suggest that there was an N loading threshold between the rates of 16 and 32 g N m−2 year−1 for
microbial responses in the study site. In other systems, contrasting responses of microorganisms to lower and higher N addition were also observed (Lee and Caporn1998; Williams et al.2000; Sarathchandra et al. 2001; Schmidt et al. 2004). In these systems, there may be a similar N loading threshold, beyond which microorganisms will shift their responses from positive to negative.
Changes in bacterial and fungal AWCD over the N addition gradient suggest that different organisms are active at different N levels. In fact, we observed separations of bacterial and fungi groups in different N-addition level from those in the control plots based on the CCA loadings (Figs.3and4). Variations in the MBC/MBN between 3 and 6 for bacteria (Table 1) suggest that bacterial groups are dominant in the
study area (Jenkinson 1988). Hence, changes in soil bacteria may largely contribute to the changes in microbial community in the temperate steppe. Similar to observations in other ecosystems (Williams et al. 2001; Grayston et al. 2004), the changes in soil bacterial CLPP occur across a wide range of substrate utilization (i.e., polymers, carbohydrates, carboxylic acids, amino acids, and so on), indicating that bacteria at different N levels are utilizing different C re-sources. Generally, bacteria are adapted to utilize the type of available carbon sources easily decomposed (Grayston et al. 1998; Baudoin et al.2001; Schutter and Dick2001), and hence changes in labile substrate along the N addition gradient are likely to be the main determinant that causes changes in potential substrate utilization of bacteria in soils (Bossio and Scow1995; Gomez et al.2006). The close correlation of bacterial CLPP with MBC/SOM supports the above conclu-sion. In addition, bacterial utilization of N-containing
NO3
--N
NH4+-N MBC/MBN SOM
MBC/SOM C/N
Moisture pH
TN MBN/SOM
Fig. 4 CCA ordination biplot of fungal CLPP for the 24
surveyed plots receiving 0 (hollow circle), 1 (hollow triangle pointed upward), 2 (filled triangle pointed upward), 4 (hollow diamond), 8 (filled diamond), 16 (hollow triangle pointed downward), 32 (filled triangle pointed downward), and 64 g N m−2year−1(hollow square). The distances between the symbols
compounds (e.g., amino acid) is usually consistent with changes in soil organic N (Johnson et al.1998; Grayston et al.2004), so that changes in soil organic N due to N addition may be another driving force of changes in bacterial CLPP in the study site. Different from bacterial groups, only two types of C sources not containing nitrogen (i.e., carboxylic acids and carbohydrates) utilized by fungi varied with N addition, indicating that N addition only impacts the activities of fungi that utilize these C sources in the temperate steppe. Additionally, the variances in fungal CLPP were greatly interpreted by soil active organic matter (MBC/SOM), inorganic N, C/N, and MBC/MBN, demonstrating that the balance between C and N is another important factor regulating potential substrate utilization of fungi besides sub-strate availability.
Independent responses of soil microorganisms on plant communities
Plants and soil microorganisms are generally con-sidered to be dependent on each other. On one hand, plants provide C substrates for soil micro-organisms. On the other hand, plants depend on microorganisms to obtain soil available nutrients. Therefore, it is expected that plants and soil microorganisms may be coupled with each other in response to environmental perturbation. However, we observed an N optimum in microbial biomass and functional diversity whereas aboveground bio-mass of plant showed consistent increases along the N addition gradient (Li et al., unpublished data), suggesting the independent responses of soil microbes on plant communities in our study site. No close correlations between soil microbial CLPP and root biomass also support the observations of the independent responses of soil microbes. Further study is needed to examine the possible underlying mechanisms for the above observations.
Conclusions
The deleterious environmental condition in soils deriving from the significant decline of pH could be largely responsible for the decline in microbial biomass and functional diversity. In support to our hypothesis, there is a critical N loading level between
the rates of 16 and 32 g N m−2 year−1in the study
site, beyond which microbial community would shift their responses to N addition. The balance and availability of C and N in soils are likely to be the main factors driving potential substrate utilization of microbial community. Additionally, the responses of soil microbial communities to N addition are inde-pendent on plant communities in the temperate steppe.
Acknowledgements This study was supported by a grant
from the National Natural Science Foundation of China to K.M. (30590382/C011108). We also wish to extend our thanks to the staff of Duolun Restoration Ecology Experimentation and Demonstration Station. We are also grateful to Shihuan Song for his assistance in sample collection, Peili Song for help in measuring soil microbial biomass, Xiangcheng Mi, Yan Zhu and Guiquan Gong for their help in data analysis, and Yu Liang, Qingmin Pan, Weixing Liu and Chen Lu for their valuable advice.
References
Bardgett RD, Shine A (1999) Linkages between plant litter diversity, soil microbial biomass and ecosystem function in temperate grasslands. Soil Biol Biochem 31:317–321 Bardgett RD, Streeter TC, Cole L, Hartley IR (2002) Linkage
between soil biota, nitrogen availability, and plant nitrogen uptake in a mountain ecosystem in the Scottish Highlands. Appl Soil Ecol 19:121–134
Baudoin E, Benizri E, Guckert A (2001) Metabolic fingerprint of microbial communities from distinct maize rhizosphere compartments. Eur J Soil Biol 37:85–93
Bossio DA, Scow KM (1995) Impact of carbon and flooding on metabolic diversity of microbial communities in soils. Appl Environ Microbiol 61:4043–4050
Bradley K, Drijber RA, Knops J (2006) Increased N availability in grassland soils modifies their microbial communities and decreases the abundance of arbuscular mycorrhizal fungi. Soil Biol Biochem 38:1583–1595
Brookes PC, Landman A, Pruden G, Jenkinson DS (1985) Chloroform fumigation and the release of soil nitrogen: a rapid direct extraction method to measure microbial biomass nitrogen in soil. Soil Biol Biochem 17:837–842 Buyer JS, Roberts DP, Millner P, Russek-Cohen E (2001)
Analysis of fungal communities by sole carbon source utilization profiles. J Microbiol Methods 45:53–60 Christensen L, Coughenour MB, Ellis JE, Chen ZZ (2004)
Vulnerability of the Asian typical steppe to grazing and climate change. Clim Change 63:351–368
Christie P, Beattie JAM (1989) Grassland soil microbial biomass and accumulation of potentially toxic metals from long-term slurry application. J Appl Ecol 26:597–612 Classen AT, Boyle SI, Haskins KE, Overby ST, Hart SC (2003)
Donbranic JK, Zak JC (1999) A microtiter plate procedure for evaluating fungal functional diversity. Mycologia 91:756–765 Fisk MC, Schmidt SK (1996) Microbial responses to nitrogen additions in alpine tundra soil. Soil Biol Biochem 28:751–755 Frey SD, Knorr M, Parrent JL, Simpson RT (2004) Chronic nitrogen enrichment affects the structure and function of the soil microbial community in temperate hardwood and pine forests. For Ecol Manag 196:159–171
Gallardo A, Schlesinger WH (1992) Carbon and nitrogen limitations of soil microbial biomass in desert ecosystems. Biogeochemistry 18:1–17
Gallo M, Amonette R, Lauber C, Sinsabaugh RL, Zak DE (2004) Microbial community structure and oxidative enzyme activity in nitrogen-amended north temperate forest soils. Microb Ecol 48:218–229
Garland JL, Mills A (1991) Classification and characterization of heterotrophic microbial communities on the basis of patterns of community-level sole-carbon-source utiliza-tion. Appl Environ Microb 57:2351–2359
Gomez E, Ferreras L, Toresani S (2006) Soil bacterial functional diversity as influenced by organic amendment application. Bioresour Technol 97:1484–1489
Grayston SJ, Wang SQ, Campbell CD, Edwards AC (1998) Selective influence of plant species on microbial diversity in the rhizosphere. Soil Biol Biochem 30:369–378 Grayston SJ, Campbell CD, Bardgett RD, Mawdsley JL, Clegg
CD, Ritz K, Griffiths BS, Rodwell JS, Edwards SJ, Davies WJ, Elston DJ, Millard P (2004) Assessing shifts in microbial community structure across a range of grasslands of differing management intensity using CLPP, PLFA and community DNA techniques. Appl Soil Ecol 25:63–84 Hines J, Megonigal JP, Denno RD (2006) Nutrient subsidies to
belowground microbes impact aboveground food web interactions. Ecology 87:1542–1555
Jenkinson DS (1988) The determination of microbial biomass carbon and nitrogen in soil. In: Wilson JR (ed) Advances in nitrogen cycling in agri-cultural ecosystems. CAB International, Wallingford, pp 368–386
Johnson D, Leake JR, Lee JA, Campbell CD (1998) Changes in soil microbial biomass and microbial activities in response to 7 years simulated pollutant nitrogen deposition on a heathland and two grasslands. Environ Pollut 103:239–250 Kalembasa SJ, Jenkinson DS (1973) A comparative study of titrimetric and gravimetric methods for the determination of organic carbon in soil. J Sci Food Agric 24:1085–1090 Kemmitt SJ, Wright D, Goulding KWT, Jones DL (2006) pH regulation of carbon and nitrogen dynamics in two agricultural soils. Soil Biol Biochem 38:898–911 Lee BJA, Caporn SJM (1998) Ecological effects of atmospheric
reactive nitrogen deposition on semi-natural terrestrial ecosystems. New Phytol 139:127–134
Liu P, Huang JH, Han XG, Sun OJ, Zhou ZY (2006) Differential responses of litter decomposition to increased soil nutrient and water between two contrasting grassland plant species of Inner Mongolia, China. Appl Soil Ecol 34:266–275
Malhi SS, Nyborg M, Harapiak JT (1998) Effects of long-term N fertilizer-induced acidification and liming on micronutrients in soil and in bromegrass hay. Soil Tillage Res 48:98–101 Michelsen A, Graglia E, Schmidt IK, Jonasson S, Sleep D,
Quarmby C (1999) Differential responses of grass and a
dwarf shrub to long-term changes in soil microbial biomass C, N and P following factorial addition of NPK fertilizer, fungicide and labile carbon to a heath. New Phytol 143:523–538
Mijangos I, Pérez R, Albizu I, Garbisu C (2006) Effects of fertilization and tillage on soil biological parameters. Enzyme Microb Technol 40:100–106
Robertson GP, Wedin D, Groffman PM, Blair JM, Holland EA, Nadelhoffer KJ, Harris D (1999) Soil carbon and nitrogen availability. In: Robertson GP, Bledsoe CS, Coleman DC, Sollins P (eds) Standard soil methods for long-term ecological research. Oxford University Press, New York, pp 258–265 Sarathchandra SU, Ghani A, Yeates GW, Burch G, Cox NR
(2001) Effect of nitrogen and phosphate fertilizers on microbial and nematode diversity in pasture soils. Soil Biol Biochem 33:953–964
Schimel JP, Weintraub MN (2003) The implication of exoen-zyme activity on microbial carbon and nitrogen limitation in soil: a theoretical model. Soil Biol Biochem 35:549–563 Schmidt SK, Lipson DA, Ley RE, Fisk MC, West AE (2004) Impacts of chronic nitrogen additions vary seasonally and by microbial functional group in tundra soils. Biogeo-chemistry 69:1–17
Schutter M, Dick R (2001) Shifts in substrate utilization potential and structure of soil microbial communities in response to carbon substrates. Soil Biol Biochem 33:1481–1491 Soderstrom B, Baath E, Lundgern B (1983) Decrease in soil
microbial activity and biomass owing to nitrogen amend-ments. Can J Microbiol 29:1500–1506
Stevens CJ, Dise NB, Mountford JO, Gowing DJ (2004) Impact of nitrogen deposition on the species richness of grasslands. Science 303:1876–1879
Vance ED, Brookes PC, Jenkinson DS (1987) An extraction method for measuring soil microbial biomass C. Soil Biol Biochem 19:703–707
Wang AS, Angle JS, Chaney RL, Delorme TA, McIntosh M (2006) Changes in soil biological activities under reduced soil pH during Thlaspi caerulescens phytoextraction. Soil Biol Biochem 38:1451–1461
Williams BL, Grayston SJ, Reid EJ (2000) Influence of synthetic sheep urine on the microbial biomass, activity and community structure in two pastures in the Scottish uplands. Plant Soil 225:175–185
Williams MA, Rice CW, Owensby CE (2001) Nitrogen competition in a tallgrass prairie ecosystem exposed to elevated carbon dioxide. Soil Sci Soc Am J 65:340–346 Xu RK, Coventry DR (2003) Soil pH changes associated with
lupin and wheat plant materials incorporated in a red-brown earth soil. Plant Soil 250:113–119
Yuan ZY, Li LH, Han XG, Huang JH, Jiang GM, Wan SQ, Zhang WH, Chen QS (2005) Nitrogen resorption from senescing leaves in 28 plant species in a semi-arid region of northern China. J Arid Environ 63:191–202
Yuan ZY, Li LH, Han XG, Chen SP, Wang ZW, Chen QS, Bai WM (2006) Nitrogen response efficiency increased mono-tonically with decreasing soil resource availability: a case study from a semiarid grassland in northern China. Oecologia 148:564–572