Table of Contents
Cover
Additional praise for
Taming the Big Data Tidal
Wave
Wiley & SAS Business Series
Title page
Copyright page
Dedication
Foreword
Preface
Acknowledgments
PART ONE: The Rise of Big Data
WHAT IS BIG DATA?
IS THE “BIG” PART OR THE “DATA” PART
MORE IMPORTANT?
HOW IS BIG DATA DIFFERENT?
HOW IS BIG DATA MORE OF THE SAME?
RISKS OF BIG DATA
WHY YOU NEED TO TAME BIG DATA
THE STRUCTURE OF BIG DATA
EXPLORING BIG DATA
MOST BIG DATA DOESN’T MATTER
FILTERING BIG DATA EFFECTIVELY
MIXING BIG DATA WITH TRADITIONAL
DATA
THE NEED FOR STANDARDS
TODAY’S BIG DATA IS NOT
TOMORROW’S BIG DATA
WRAP-UP
CHAPTER 2: Web Data: The Original Big Data
WEB DATA OVERVIEW
WRAP-UP
CHAPTER 3: A Cross-Section of Big Data Sources
and the Value They Hold
AUTO INSURANCE: THE VALUE OF
TELEMATICS DATA
MULTIPLE INDUSTRIES: THE VALUE OF
TEXT DATA
MULTIPLE INDUSTRIES: THE VALUE OF
TIME AND LOCATION DATA
RETAIL AND MANUFACTURING: THE
VALUE OF RADIO FREQUENCY
IDENTIFICATION DATA
UTILITIES: THE VALUE OF SMART-GRID
DATA
GAMING: THE VALUE OF CASINO CHIP
TRACKING DATA
INDUSTRIAL ENGINES AND EQUIPMENT:
THE VALUE OF SENSOR DATA
VIDEO GAMES: THE VALUE OF
TELEMETRY DATA
NETWORK DATA
WRAP-UP
PART TWO: Taming Big Data: The
Technologies, Processes, and Methods
CHAPTER 4: The Evolution of Analytic Scalability
A HISTORY OF SCALABILITY
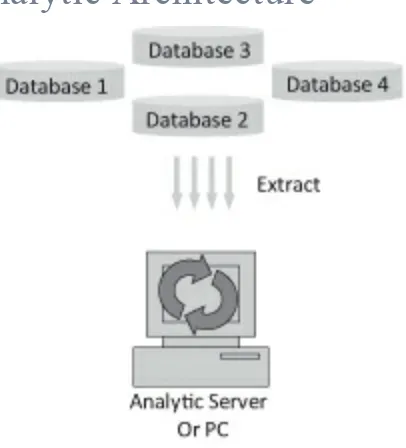
THE CONVERGENCE OF THE ANALYTIC
AND DATA ENVIRONMENTS
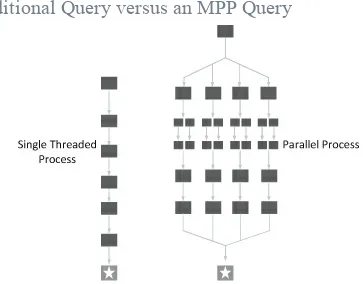
MASSIVELY PARALLEL PROCESSING
SYSTEMS
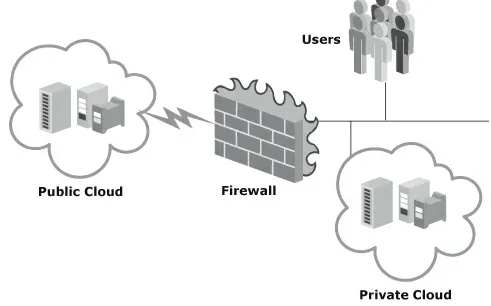
CLOUD COMPUTING
GRID COMPUTING
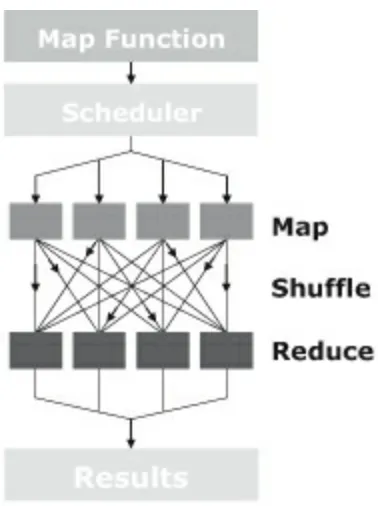
MAPREDUCE
IT ISN’T AN EITHER/OR CHOICE!
WRAP-UP
CHAPTER 5: The Evolution of Analytic Processes
THE ANALYTIC SANDBOX
WRAP-UP
CHAPTER 6: The Evolution of Analytic Tools and
Methods
THE EVOLUTION OF ANALYTIC
METHODS
THE EVOLUTION OF ANALYTIC TOOLS
WRAP-UP
PART THREE: Taming Big Data: The
People and Approaches
CHAPTER 7: What Makes a Great Analysis?
ANALYSIS VERSUS REPORTING
ANALYSIS: MAKE IT G.R.E.A.T.!
CORE ANALYTICS VERSUS ADVANCED
ANALYTICS
LISTEN TO YOUR ANALYSIS
FRAMING THE PROBLEM CORRECTLY
STATISTICAL SIGNIFICANCE VERSUS
BUSINESS IMPORTANCE
COMPUTING STATISTICS
WRAP-UP
CHAPTER 8: What Makes a Great Analytic
Professional?
WHO IS THE ANALYTIC PROFESSIONAL?
THE COMMON MISCONCEPTIONS ABOUT
ANALYTIC PROFESSIONALS
EVERY GREAT ANALYTIC
PROFESSIONAL IS AN EXCEPTION
THE OFTEN UNDERRATED TRAITS OF A
GREAT ANALYTIC PROFESSIONAL
IS ANALYTICS CERTIFICATION NEEDED,
OR IS IT NOISE?
WRAP-UP
CHAPTER 9: What Makes a Great Analytics Team?
ALL INDUSTRIES ARE NOT CREATED
EQUAL
JUST GET STARTED!
THERE’S A TALENT CRUNCH OUT THERE
TEAM STRUCTURES
WHO SHOULD BE DOING ADVANCED
ANALYTICS?
WHY CAN’T IT AND ANALYTIC
PROFESSIONALS GET ALONG?
WRAP-UP
PART FOUR: Bringing It Together: The
Analytics Culture
CHAPTER 10: Enabling Analytic Innovation
BUSINESSES NEED MORE INNOVATION
TRADITIONAL APPROACHES HAMPER
INNOVATION
DEFINING ANALYTIC INNOVATION
ITERATIVE APPROACHES TO ANALYTIC
INNOVATION
CONSIDER A CHANGE IN PERSPECTIVE
ARE YOU READY FOR AN ANALYTIC
INNOVATION CENTER?
WRAP-UP
SETTING THE STAGE
OVERVIEW OF THE KEY PRINCIPLES
WRAP-UP
Conclusion: Think Bigger!
About the Author
Additional praise for
Taming the Big
Data Tidal Wave
This book is targeted for the business managers who wish to leverage the opportunities that big data can bring to their business. It is written in an easy flowing manner that motivates and mentors the non-technical person about the complex issues surrounding big data. Bill Franks continually focuses on the key success factor … How can companies improve their business through analytics that probe this big data? If the tidal wave of big data is about to crash upon your business, then I would recommend this book.
—Richard Hackathorn, President, Bolder Technology, Inc.
Most big data initiatives have grown both organically and rapidly. Under such conditions, it is easy to miss the big picture. This book takes a step back to show how all the pieces fit together, addressing varying facets from technology to analysis to organization. Bill approaches big data with a wonderful sense of practicality—”just get started” and “deliver value as you go” are phrases that characterize the ethos of successful big data organizations.
—Eric Colson, Vice President of Data Science and Engineering, Netflix
Bill Franks is a straight-talking industry insider who has written an invaluable guide for those who would first understand and then master the opportunities of big data.
Wiley & SAS Business Series
The Wiley & SAS Business Series presents books that help senior-level managers with their critical management decisions.
Titles in the Wiley & SAS Business Series include:
Activity-Based Management for Financial Institutions: Driving Bottom-Line Results by Brent Bahnub
Branded! How Retailers Engage Consumers with Social Media and Mobility by Bernie Brennan and Lori Schafer
Business Analytics for Customer Intelligence by Gert Laursen
Business Analytics for Managers: Taking Business Intelligence beyond Reporting by Gert Laursen and Jesper Thorlund
Business Intelligence Competency Centers: A Team Approach to Maximizing Competitive Advantage by Gloria J. Miller, Dagmar Brautigam, and Stefanie Gerlach
Business Intelligence Success Factors: Tools for Aligning Your Business in the Global Economy by Olivia Parr Rud
Case Studies in Performance Management: A Guide from the Experts
by Tony C. Adkins
CIO Best Practices: Enabling Strategic Value with Information Technology, Second Edition by Joe Stenzel
Credit Risk Assessment: The New Lending System for Borrowers, Lenders, and Investors by Clark Abrahams and Mingyuan Zhang
Credit Risk Scorecards: Developing and Implementing Intelligent Credit Scoring by Naeem Siddiqi
Customer Data Integration: Reaching a Single Version of the Truth,
by Jill Dyche and Evan Levy
Demand-Driven Forecasting: A Structured Approach to Forecasting
Enterprise Risk Management: A Methodology for Achieving Strategic Objectives by Gregory Monahan
Executive’s Guide to Solvency II by David Buckham, Jason Wahl, and Stuart Rose
Fair Lending Compliance: Intelligence and Implications for Credit Risk Management by Clark R. Abrahams and Mingyuan Zhang
Foreign Currency Financial Reporting from Euros to Yen to Yuan: A Guide to Fundamental Concepts and Practical Applications by Robert Rowan
Information Revolution: Using the Information Evolution Model to Grow Your Business by Jim Davis, Gloria J. Miller, and Allan Russell
Manufacturing Best Practices: Optimizing Productivity and Product Quality by Bobby Hull
Marketing Automation: Practical Steps to More Effective Direct Marketing by Jeff LeSueur
Mastering Organizational Knowledge Flow: How to Make Knowledge Sharing Work by Frank Leistner
Performance Management: Finding the Missing Pieces (to Close the Intelligence Gap) by Gary Cokins
Performance Management: Integrating Strategy Execution, Methodologies, Risk, and Analytics by Gary Cokins
Retail Analytics: The Secret Weapon by Emmett Cox
Social Network Analysis in Telecommunications by Carlos Andre Reis Pinheiro
The Business Forecasting Deal: Exposing Bad Practices and Providing Practical Solutions by Michael Gilliland
The Data Asset: How Smart Companies Govern Their Data for Business Success by Tony Fisher
Thomas and Mike Barlow
The New Know: Innovation Powered by Analytics by Thornton May
The Value of Business Analytics: Identifying the Path to Profitability
by Evan Stubbs
Visual Six Sigma: Making Data Analysis Lean by Ian Cox, Marie A Gaudard, Philip J. Ramsey, Mia L. Stephens, and Leo Wright
For more information on any of the above titles, please visit
Copyright © 2012 by Bill Franks. All rights reserved. Published by John Wiley & Sons, Inc., Hoboken, New Jersey.
Published simultaneously in Canada.
No part of this publication may be reproduced, stored in a retrieval system, or transmitted in any form or by any means, electronic, mechanical, photocopying, recording, scanning, or otherwise, except as permitted under Section 107 or 108 of the 1976 United States Copyright
Act, without either the prior written permission of the Publisher, or authorization through payment of the appropriate per-copy fee to the Copyright Clearance Center, Inc., 222 Rosewood Drive, Danvers, MA
01923, (978) 750-8400, fax (978) 646-8600, or on the Web at
www.copyright.com. Requests to the Publisher for permission should be addressed to the Permissions Department, John Wiley & Sons, Inc., 111 River Street, Hoboken, NJ 07030, (201) 748-6011, fax (201) 748-6008, or
online at www.wiley.com/go/permissions.
Limit of Liability/Disclaimer of Warranty: While the publisher and author have used their best efforts in preparing this book, they make no
representations or warranties with respect to the accuracy or
completeness of the contents of this book and specifically disclaim any implied warranties of merchantability or fitness for a particular purpose.
No warranty may be created or extended by sales representatives or written sales materials. The advice and strategies contained herein may not be suitable for your situation. You should consult with a professional where appropriate. Neither the publisher nor author shall be liable for any loss of profit or any other commercial damages, including but not limited
to special, incidental, consequential, or other damages.
For general information on our other products and services or for technical support, please contact our Customer Care Department within
Wiley also publishes its books in a variety of electronic formats. Some content that appears in print may not be available in electronic books. For
more information about Wiley products, visit our web site at
www.wiley.com.
Library of Congress Cataloging-in-Publication Data:
Franks, Bill
Taming the big data tidal wave: finding opportunities in huge data streams with advanced analytics / Bill Franks.
pages cm. — (Wiley & SAS business series) Includes bibliographical references and index.
ISBN 978-1-118-20878-6 (cloth); ISBN 978-1-118-22866-1 (ebk); ISBN 978-1-118-24117-2 (ebk); ISBN 978-1-118-26588-8 (ebk)
1. Data mining. 2. Database searching. I. Title. QA76.9.D343.F73 2012
Foreword
Like it or not, a massive amount of data will be coming your way soon. Perhaps it has reached you already. Perhaps you’ve been wrestling with it for a while—trying to figure out how to store it for later access, address its mistakes and imperfections, or classify it into structured categories. Now you are ready to actually extract some value out of this huge dataset by analyzing it and learning something about your customers, your business, or some aspect of the environment for your organization. Or maybe you’re not quite there, but you see light at the end of the data management tunnel.
In either case, you’ve come to the right place. As Bill Franks suggests, there may soon be not only a flood of data, but also a flood of books about big data. I’ll predict (with no analytics) that this book will be different from the rest. First, it’s an early entry in the category. But most importantly, it has a different content focus.
Most of these big-data books will be about the management of big data: how to wrestle it into a database or data warehouse, or how to structure and categorize unstructured data. If you find yourself reading a lot about Hadoop or MapReduce or various approaches to data warehousing, you’ve stumbled upon—or were perhaps seeking—a “big data management” (BDM) book.
This is, of course, important work. No matter how much data you have of whatever quality, it won’t be much good unless you get it into an environment and format in which it can be accessed and analyzed.
analysis, or other sources of big data. Even before the recent big data era, many organizations have gotten caught up in data management for years (and sometimes decades) without ever getting any real value from their data in the form of better analysis and decision-making.
This book, then, puts the focus squarely where it belongs, in my opinion. It’s primarily about the effective analysis of big data, rather than the BDM topic, per se. It starts with data and goes all the way into such topics as how to frame decisions, how to build an analytics center of excellence, and how to build an analytical culture. You will find some mentions of BDM topics, as you should. But the bulk of the content here is about how to create, organize, staff, and execute on analytical initiatives that make use of data as the input.
In case you have missed it, analytics are a very hot topic in business today. My work has primarily been around how companies compete on analytics, and my books and articles in these areas have been among the most popular of any I’ve written. Conferences on analytics are popping up all over the place. Large consulting firms such as Accenture, Deloitte, and IBM have formed major practices in the area. And many companies, public sector organizations, and even nonprofits have made analytics a strategic priority. Now people are also very excited about big data, but the focus should still remain on how to get such data into a form in which it can be analyzed and thus influence decisions and actions.
Bill Franks is uniquely positioned to discuss the intersection of big data and analytics. His company, Teradata, compared to other data warehouse/data appliance vendors, has always had the greatest degree of focus within that industry segment on actually analyzing data and extracting business value from it. And although the company is best known for enterprise data warehouse tools, Teradata has also provided a set of analytical applications for many years.
embedding analysis within the data warehouse environment itself, are for large-volume analytical applications such as real-time fraud detection and large-scale scoring of customer buying propensities. Bill Franks is the chief analytics officer for the partnership and therefore has had access to a large volume of ideas and expertise on production-scale analytics and “in-database processing.” There is perhaps no better source on this topic.
So what else is particularly interesting and important between these covers? There are a variety of high points:
Chapter 1 provides an overview of the big data concept, and explains that “size doesn’t always matter” in this context. In fact, throughout the book, Franks points out that much of the volume of big data isn’t useful anyway, and that it’s important to focus on filtering out the dross data.
The overview of big data sources in Chapter 3 is a creative, useful catalog, and unusually thorough. And the book’s treatment of web data and web analytics in Chapter 2 is very useful for anyone or any organization wishing to understand online customer behavior. It goes well beyond the usual reporting-oriented focus of web analytics.
Chapter 4, devoted to “The Evolution of Analytical Scalability,” will provide you with a perspective on the technology platforms for big data and analytics that I am pretty sure you won’t find anywhere else on this earth. It also puts recent technologies like MapReduce in
perspective, and sensibly argues that most big data analytics efforts will require a combination of environments.
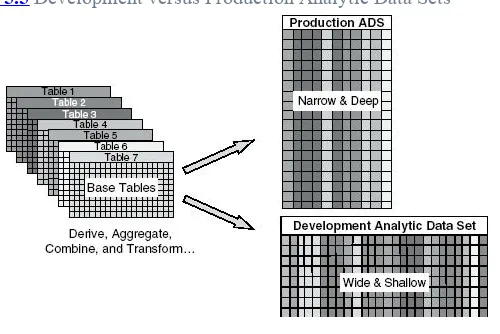
This book has some up-to-the-minute content about how to create and manage analytical data environments that you also won’t find anywhere else. If you want the best and latest thinking about
“analytic sandboxes” and “enterprise analytic data sets” (that was a new topic for me, but I now know what they are and why they’re important), you’ll find it in Chapter 5. This chapter also has some important messages about the need for model and scoring
Chapter 6 has a very useful discussion of the types of analytical software tools that are available today, including the open source package R. It’s very difficult to find commonsense advice about the strengths and weaknesses of different analytical environments, but it is present in this chapter. Finally, the discussion of ensemble and commodity analytical methods in this chapter is refreshingly easy to understand for nontechnical types like me.
Part Three of the book leaves the technical realm for advice on how to manage the human and organizational sides of analytics. Again, the perspective is heavily endowed with good sense. I particularly liked, for example, the emphasis on the framing of decisions and
problems in Chapter 7. Too many analysts jump into analysis without thinking about the larger questions of how the problem is being
framed.
Someone recently asked me if there was any description of analytical culture outside of my own writings. I said I didn’t know of any, but that was before I read Part Four of Franks’s book. It ties analytical culture to innovation culture in a way that I like and have never seen before.
Although the book doesn’t shrink from technical topics, it treats them all with a straightforward, explanatory approach. This keeps the book accessible to a wide audience, including those with limited technical backgrounds. Franks’s advice about data visualization tools summarizes the tone and perspective of the entire book: “Simple is best. Only get fancy or complex when there is a specific need.”
you’ve already bought it, get busy and read!
Preface
You receive an e-mail. It contains an offer for a complete personal computer system. It seems like the retailer read your mind since you were exploring computers on their web site just a few hours prior. …
As you drive to the store to buy the computer bundle, you get an offer for a discounted coffee from the coffee shop you are getting ready to drive past. It says that since you’re in the area, you can get 10% off if you stop by in the next 20 minutes. …
As you drink your coffee, you receive an apology from the manufacturer of a product that you complained about yesterday on your Facebook page, as well as on the company’s web site. …
Finally, once you get back home, you receive notice of a special armor upgrade available for purchase in your favorite online video game. It is just what is needed to get past some spots you’ve been struggling with. …
Sound crazy? Are these things that can only happen in the distant future? No. All of these scenarios are possible today! Big data. Advanced analytics. Big data analytics. It seems you can’t escape such terms today. Everywhere you turn people are discussing, writing about, and promoting big data and advanced analytics. Well, you can now add this book to the discussion.
and anticipation of the business and consumer benefits that analyzing it will yield over time.
Big data is the next wave of new data sources that will drive the next wave of analytic innovation in business, government, and academia. These innovations have the potential to radically change how organizations view their business. The analysis that big data enables will lead to decisions that are more informed and, in some cases, different from what they are today. It will yield insights that many can only dream about today. As you’ll see, there are many consistencies with the requirements to tame big data and what has always been needed to tame new data sources. However, the additional scale of big data necessitates utilizing the newest tools, technologies, methods, and processes. The old way of approaching analysis just won’t work. It is time to evolve the world of advanced analytics to the next level. That’s what this book is about.
Taming the Big Data Tidal Wave isn’t just the title of this book, but rather an activity that will determine which businesses win and which lose in the next decade. By preparing and taking the initiative, organizations can ride the big data tidal wave to success rather than being pummeled underneath the crushing surf. What do you need to know and how do you prepare in order to start taming big data and generating exciting new analytics from it? Sit back, get comfortable, and prepare to find out!
INTENDED AUDIENCE
to approach the creation and evolution of a world-class advanced analytics ecosystem in today’s big data environment. A wide range of readers will find this book to be of value and interest. Whether you are an analytics professional, a businessperson who uses the results that analysts produce, or just someone with an interest in big data and advanced analytics, this book has something for you.
The book will not provide deeply detailed technical reviews of the topics covered. Rather, the book aims to be just technical enough to provide a high-level understanding of the concepts discussed. The goal is to enable readers to understand and begin to apply the concepts while also helping identify where more research is desired. This book is more of a handbook than a textbook, and it is accessible to non-technical readers. At the same time, those who already have a deeper understanding of the topics will be able to read between the lines to see the more technical implications of the discussions.
OVERVIEW OF THE
CONTENTS
PART ONE: THE RISE OF BIG
DATA
Part One is focused on what big data is, why it is important, and the benefits of analyzing it. It covers a total of 10 big data sources and how those sources can be applied to help organizations improve their business. If readers are unclear when picking up the book about what big data is or how broadly big data applies, Part One will provide clarity.
Chapter 1: What Is Big Data and Why Does It Matter? This chapter begins with some background on big data and what it is all about. It then covers a number of considerations related to how organizations can make use of big data. Readers will need to understand what is in this chapter as much as anything else in the book if they are to help their organizations tame the big data tidal wave successfully.
Chapter 2: Web Data: The Original Big Data. Probably the most widely used and best-known source of big data today is the detailed data collected from web sites. The logs generated by users navigating the web hold a treasure trove of information just waiting to be analyzed. Organizations across a number of industries have integrated detailed, customer-level data sourced from their web sites into their enterprise analytics environments. This chapter explores how that data is enhancing and changing a variety of business decisions.
PART TWO: TAMING BIG
DATA: THE TECHNOLOGIES,
PROCESSES, AND METHODS
Part Two focuses on the technologies, processes, and methods required to tame big data. Major advances have increased the scalability of all three of those areas over the years. Organizations can’t continue to rely on outdated approaches and expect to stay competitive in the world of big data. This part of the book is by far the most technical, but should still be accessible to almost all readers. After reading these chapters, readers will be familiar with a number of concepts that they will come across as they enter the world of analyzing big data.
Chapter 4: The Evolution of Analytic Scalability. The growth of data has always been at a pace that strains the most scalable options available at any point in time. The traditional ways of performing advanced analytics were already reaching their limits before big data. Now, traditional approaches just won’t do. This chapter discusses the convergence of the analytic and data environments, massively parallel processing (MPP) architectures, the cloud, grid computing, and MapReduce. Each of these paradigms enables greater scalability and will play a role in the analysis of big data.
widely consumed by users and applications.
PART THREE: TAMING BIG
DATA: THE PEOPLE AND
APPROACHES
Part Three is focused on the people that drive analytic results, the teams they belong to, and the approaches they use to ensure that they provide great analysis. The most important factor in any analytics endeavor, including the analysis of big data, is having the right people in the driver’s seat who are following the right analysis principles. After reading Part Three, readers will better understand what sets great analysis, great analytic professionals, and great analytics teams apart from the rest.
Chapter 7: What Makes a Great Analysis? Computing statistics, writing a report, and applying a modeling algorithm are each only one step of many required for generating a great analysis. This chapter starts by clarifying a few definitions, and then discusses a variety of themes that relate to creating great analysis. With big data adding even more complexity to the mix than organizations are used to dealing with, it’s more crucial than ever to keep the principles discussed in this chapter in mind.
Chapter 8: What Makes a Great Analytic Professional? Skill in math, statistics, and programming are necessary, but not sufficient, traits of a great analytic professional. Great analytic professionals also have traits that are often not the first things that come to most people’s minds. These traits include commitment, creativity, business savvy, presentation skills, and intuition. This chapter explores why each of these traits are so important in defining a great analytic professional and why they can’t be overlooked.
PART FOUR: BRINGING IT
TOGETHER: THE ANALYTICS
CULTURE
Part Four focuses on some well-known underlying principles that must be applied for an organization to successfully innovate with advanced analytics and big data. While these principles apply broadly to other disciplines as well, the focus will be on providing a perspective on how the principles relate to advanced analytics within today’s enterprise environments. The concepts covered will be familiar to readers, but perhaps not the way that the concepts are applied to the world of advanced analytics and big data.
Chapter 10: Enabling Analytic Innovation. This chapter starts by reviewing some of the basic principles behind successful innovation. Then, it applies them to the world of big data and advanced analytics through the concept of an analytic innovation center. The goal is to provide readers with some tangible ideas of how to better enable analytic innovation and the taming of big data within their organizations.
Acknowledgments
Many people deserve credit for assisting me in getting this book written. Thanks to my colleagues at Teradata, SAS, and the International Institute for Analytics, who encouraged me to write this, as well as to the authors I know who helped me to understand what I was getting into.
I also owe a big thanks to the people who volunteered to review and provide input on the book as I developed it. Reading hundreds of pages of rough drafts isn’t exactly a party! Thanks for the great input that helped me tune the flow and message.
A last thanks goes to all of the analytic professionals, business professionals, and IT professionals who I have worked with over the years. You have all helped me learn and apply the concepts in this book. Without getting a chance to see these concepts in action in real situations, it wouldn’t have been possible to write about them.
CHAPTER 1
What Is Big Data and Why Does It
Matter?
Perhaps nothing will have as large an impact on advanced analytics in the coming years as the ongoing explosion of new and powerful data sources. When analyzing customers, for example, the days of relying exclusively on demographics and sales history are past. Virtually every industry has at least one completely new data source coming online soon, if it isn’t here already. Some of the data sources apply widely across industries; others are primarily relevant to a very small number of industries or niches. Many of these data sources fall under a new term that is receiving a lot of buzz: big data.
Big data is sprouting up everywhere and using it appropriately will drive competitive advantage. Ignoring big data will put an organization at risk and cause it to fall behind the competition. To stay competitive, it is imperative that organizations aggressively pursue capturing and analyzing these new data sources to gain the insights that they offer. Analytic professionals have a lot of work to do! It won’t be easy to incorporate big data alongside all the other data that has been used for analysis for years.
WHAT IS BIG DATA?
There is not a consensus in the marketplace as to how to define big data, but there are a couple of consistent themes. Two sources have done a good job of capturing the essence of what most would agree big data is all about. The first definition is from Gartner’s Merv Adrian in a Q1, 2011
Teradata Magazine article. He said, “Big data exceeds the reach of commonly used hardware environments and software tools to capture, manage, and process it within a tolerable elapsed time for its user population.”1 Another good definition is from a paper by the McKinsey
Global Institute in May 2011: “Big data refers to data sets whose size is beyond the ability of typical database software tools to capture, store, manage and analyze.”2
These definitions imply that what qualifies as big data will change over time as technology advances. What was big data historically or what is big data today won’t be big data tomorrow. This aspect of the definition of big data is one that some people find unsettling. The preceding definitions also imply that what constitutes big data can vary by industry, or even organization, if the tools and technologies in place vary greatly in capability. We will talk more about this later in the chapter in the section titled “Today’s Big Data Is Not Tomorrow’s Big Data.”
A couple of interesting facts in the McKinsey paper help bring into focus how much data is out there today:
$600 today can buy a disk drive that will store all of the world’s music.
There are 30 billion pieces of information shared on Facebook each month.
Fifteen of 17 industry sectors in the United States have more data per company on average than the U.S. Library of Congress.3
ABOUT VOLUME
While big data certainly involves having a lot of data, big data doesn’t refer to data volume alone. Big data also has increased velocity (i.e., the rate at which data is transmitted and received), complexity, and variety compared to data sources of the past.
Big data isn’t just about the size of the data in terms of how much data there is. According to the Gartner Group, the “big” in big data also refers to several other characteristics of a big data source.4 These aspects
include not just increased volume but increased velocity and increased variety. These factors, of course, lead to extra complexity as well. What this means is that you aren’t just getting a lot of data when you work with big data. It’s also coming at you fast, it’s coming at you in complex formats, and it’s coming at you from a variety of sources.
IS THE “BIG” PART OR THE
“DATA” PART MORE
IMPORTANT?
It is already time to take a brief quiz! Stop for a minute and consider the following question before you read on: What is the most important part of the term big data? Is it (1) the “big” part, (2) the “data” part, (3) both, or (4) neither? Take a minute to think about it and once you’ve locked in your answer, proceed to the next paragraph. In the meantime, imagine the “contestants are thinking” music from a game show playing in the background.
Okay, now that you’ve locked in your answer let’s find out if you got the right answer. The answer to the question is choice (4). Neither the “big” part nor the “data” part is the most important part of big data. Not by a long shot. What organizations do with big data is what is most important. The analysis your organization does against big data combined with the actions that are taken to improve your business are what matters.
Having a big source of data does not in and of itself add any value whatsoever. Maybe your data is bigger than mine. Who cares? In fact, having any set of data, however big or small it may be, doesn’t add any value by itself. Data that is captured but not used for anything is of no more value than some of the old junk stored in an attic or basement. Data is irrelevant without being put into context and put to use. As with any source of data big or small, the power of big data is in what is done with that data. How is it analyzed? What actions are taken based on the findings? How is the data used to make changes to a business?
Doesn’t Matter, many big data sources have a far higher percentage of useless or low-value content than virtually any historical data source. By the time you trim down a big data source to what you actually need, it may not even be so big any more. But that doesn’t really matter, because whether it stays big or whether it ends up being small when you’re done processing it, the size isn’t important. It’s what you do with it.
IT ISN’T HOW BIG IT IS. IT’S HOW YOU
USE IT!
We’re talking about big data of course! Neither the fact that big data is big nor the fact that it is data adds any inherent value. The value is in how you analyze and act upon the data to improve your business.
The first critical point to remember as we start into the book is that big data is both big and it’s data. However, that’s not what’s going to make it exciting for you and your organization. The exciting part comes from all the new and powerful analytics that will be possible as the data is utilized. We’re going to talk about a number of those new analytics as we proceed.
HOW IS BIG DATA
DIFFERENT?
There are some important ways that big data is different from traditional data sources. Not every big data source will have every feature that follows, but most big data sources will have several of them.
sources, there was always a person involved. Consider retail or bank transactions, telephone call detail records, product shipments, or invoice payments. All of those involve a person doing something in order for a data record to be generated. Somebody had to deposit money, or make a purchase, or make a phone call, or send a shipment, or make a payment. In each case, there is a person who is taking action as part of the process of new data being created. This is not so for big data in many cases. A lot of sources of big data are generated without any human interaction at all. A sensor embedded in an engine, for example, spits out data about its surroundings even if nobody touches it or asks it to.
Second, big data is typically an entirely new source of data. It is not simply an extended collection of existing data. For example, with the use of the Internet, customers can now execute a transaction with a bank or retailer online. But the transactions they execute are not fundamentally different transactions from what they would have done traditionally. They’ve simply executed the transactions through a different channel. An organization may capture web transactions, but they are really just more of the same old transactions that have been captured for years. However, actually capturing browsing behaviors as customers execute a transaction creates fundamentally new data which we’ll discuss in detail in Chapter 2.
Sometimes “more of the same” can be taken to such an extreme that the data becomes something new. For example, your power meter has probably been read manually each month for years. An argument can be made that automatic readings every 15 minutes by a Smart Meter is more of the same. It can also be argued that it is so much more of the same and that it enables such a different, more in-depth level of analytics that such data is really a new data source. We’ll discuss this data in Chapter 3.
what you get when people make a posting. It can be difficult to work with such data at best and very, very ugly at worst. We’ll discuss text data in Chapters 3 and 6. Most traditional data sources were designed up-front to be friendly. Systems used to capture transactions, for example, provide data in a clean, preformatted template that makes the data easy to load and use. This was driven in part by the historical need to be highly efficient with space. There was no room for excess fluff.
BIG DATA CAN BE MESSY AND UGLY
Traditional data sources were very tightly defined up-front. Every bit of data had a high level of value or it would not be included. With the cost of storage space becoming almost negligible, big data sources are not always tightly defined up-front and typically capture everything that may be of use. This can lead to having to wade through messy, junk-filled data when doing an analysis.
Last, large swaths of big data streams may not have much value. In fact, much of the data may even be close to worthless. Within a web log, there is information that is very powerful. There is also a lot of information that doesn’t have much value at all. It is necessary to weed through and pull out the valuable and relevant pieces. Traditional data sources were defined up-front to be 100 percent relevant. This is because of the scalability limitations that were present. It was far too expensive to have anything included in a data feed that wasn’t critical. Not only were data records predefined, but every piece of data in them was high-value. Storage space is no longer a primary constraint. This has led to the default with big data being to capture everything possible and worry later about what matters. This ensures nothing will be missed, but also can make the process of analyzing big data more painful.
THE SAME?
As with any new topic getting a lot of attention, there are all sorts of claims about how big data is going to fundamentally change everything about how analysis is done and how it is used. If you take the time to think about it, however, it really isn’t the case. It is an example where the hype is going beyond the reality.
The fact that big data is big and poses scalability issues isn’t new. Most new data sources were considered big and difficult when they first came into use. Big data is just the next wave of new, bigger data that pushes current limits. Analysts were able to tame past data sources, given the constraints at the time, and big data will be tamed as well. After all, analysts have been at the forefront of exploring new data sources for a long time. That’s going to continue.
Who first started to analyze call detail records within telecom companies? Analysts did. I was doing churn analysis against mainframe tapes at my first job. At the time, the data was mind-boggling big. Who first started digging into retail point-of-sale data to figure out what nuggets it held? Analysts did. Originally, the thought of analyzing data about tens to hundreds of thousands of products across thousands of stores was considered a huge problem. Today, not so much.
The analytical professionals who first dipped their toe into such sources were dealing with what at the time were unthinkably large amounts of data. They had to figure out how to analyze it and make use of it within the constraints in place at the time. Many people doubted it was possible, and some even questioned the value of such data. That sounds a lot like big data today, doesn’t it?
analysts and data scientists will simply be exploring new and unthinkably large data sets to uncover valuable trends and patterns as they have always done. For the purposes of this book, we’ll include both traditional analysts and data scientists under the umbrella term “analytic professionals.” We’ll also cover these professionals in much more detail in Chapters 7, 8, and 9. The key takeaway here is that the challenge of big data isn’t as new as it first sounds.
YOU HAVE NOTHING TO FEAR
In many ways, big data doesn’t pose any problems that your
organization hasn’t faced before. Taming new, large data sources that push the current limits of scalability is an ongoing theme in the world of analytics. Big data is simply the next generation of such data. Analytical professionals are well-versed in dealing with these situations. If your organization has tamed other data sources, it can tame big data, too.
Big data will change some of the tactics analytic professionals use as they do their work. New tools, methods, and technologies will be added alongside traditional analytic tools to help deal more effectively with the flood of big data. Complex filtering algorithms will be developed to siphon off the meaningful pieces from a raw stream of big data. Modeling and forecasting processes will be updated to include big data inputs on top of currently exiting inputs. We’ll discuss these topics more in Chapters 4, 5, and 6.
RISKS OF BIG DATA
Big data does come with risks. One risk is that an organization will be so overwhelmed with big data that it won’t make any progress. The key here, as we will discuss in Chapter 8, is to get the right people involved so that doesn’t happen. You need the right people attacking big data and attempting to solve the right kinds of problems. With the right people addressing the right problems, organizations can avoid spinning their wheels and failing to make progress.
Another risk is that costs escalate too fast as too much big data is captured before an organization knows what to do with it. As with anything, avoiding this is a matter of making sure that progress moves at a pace that allows the organization to keep up. It isn’t necessary to go for it all at once and capture 100 percent of every new data source starting tomorrow. What is necessary is to start capturing samples of the new data sources to learn about them. Using those initial samples, experimental analysis can be performed to determine what is truly important within each source and how each can be used. Building from that base, an organization will be ready to effectively tackle a data source on a large scale.
Perhaps the biggest risk with many sources of big data is privacy. If everyone in the world was good and honest, then we wouldn’t have to worry much about privacy. But everyone is not good and honest. In fact, in addition to individuals, there are also companies that are not good and honest. There are even entire governments that are not good and honest. Big data has the potential to be problematic here. Privacy will need to be addressed with respect to big data, or it may never meet its potential. Without proper restraints, big data has the potential to unleash such a groundswell of protest that some sources of it may be shut down completely.
and posted online. It isn’t a stretch to say that if data is being stored, somebody will try and steal it. Once the bad guys get their hands on data they will do bad things with it. There have also been high-profile cases of major organizations getting into trouble for having ambiguous or poorly defined privacy policies. This has led to data being used in ways that consumers didn’t understand or support, causing a backlash. Both self-regulation and legal self-regulation of the uses of big data will need to evolve as the use of big data explodes.
Self-regulation is critical. After all, it shows that an industry cares. Industries should regulate themselves and develop rules that everyone can live with. Self-imposed rules are usually better and less restrictive than those created when a government entity steps in because an industry didn’t do a good job of policing itself.
PRIVACY WILL BE A HUGE ISSUE WITH
BIG DATA
Given the sensitive nature of many sources of big data, privacy concerns will be a major focal point. Once data exists, dishonest people will try to use it in ways you wouldn’t approve of without your consent. Policies and protocols for the handling, storage, and application of big data are going to need to catch up with the
analysis capabilities that already exist. Be sure to think through your organization’s approach to privacy up front and make your position totally clear and transparent.
having their data captured and analyzed.
WHY YOU NEED TO TAME
BIG DATA
Many organizations have done little, if anything, with big data yet. Luckily, your organization is not too far behind in 2012 if you have ignored big data so far, unless you are in an industry, such as ecommerce, where analyzing big data is already standard. That will change soon, however, as momentum is picking up rapidly. So far, most organizations have missed only the chance to be on the leading edge. That is actually just fine with many organizations. Today, they have a chance to get ahead of the pack. Within a few years, any organization that isn’t analyzing big data will be late to the game and will be stuck playing catch up for years to come. The time to start taming big data is now.
It isn’t often that a company can leverage totally new data sources and drive value for its business while the competition isn’t doing the same thing. That is the huge opportunity in big data today. You have a chance to get ahead of much of your competition and beat them to the punch. We will continue to see examples in the coming years of businesses transforming themselves with the analysis of big data. Case studies will tell the story about how the competition was left in the dust and caught totally off guard. It is already possible to find compelling results being discussed in articles, at conferences, and elsewhere today. Some of these case studies are from companies in industries considered dull, old, and stodgy. It isn’t just the sexy, new industries like ecommerce that are involved. We’ll look at a variety of examples of how big data can be used in Chapters 2 and 3.
Your organization needs to start taming big data now. As of today, you’ve only missed the chance to be on the bleeding edge if you’ve ignored big data. Today, you can still get ahead of the pack. In a few years, you’ll be left behind if you are still sitting on the
sidelines. If your organization is already committed to capturing data and using analysis to make decisions, then going after big data isn’t a stretch. It is simply an extension of what you are already doing today.
The fact is that the decision to start taming big data shouldn’t be a big stretch. Most organizations have already committed to collecting and analyzing data as a core part of their strategy. Data warehousing, reporting, and analysis are ubiquitous. Once an organization has bought into the idea that data has value, then taming and analyzing big data is just an extension of that commitment. Don’t let a naysayer tell you it isn’t worth exploring big data, or that it isn’t proven, or that it’s too risky. Those same excuses would have prevented any of the progress made in the past few decades with data and analysis. Focus those who are uncertain or nervous about big data on the fact that big data is simply an extension of what the organization is already doing. There is nothing earth-shatteringly new and different about it and nothing to fear.
THE STRUCTURE OF BIG
DATA
book.
Most traditional data sources are fully in the structured realm. This means traditional data sources come in a clear, predefined format that is specified in detail. There is no variation from the defined formats on a day-to-day or update-to-update basis. For a stock trade, the first field received might be a date in a MM/DD/YYYY format. Next might be an account number in a 12-digit numeric format. Next might be a stock symbol that is a three- to five-digit character field. And so on. Every piece of information included is known ahead of time, comes in a specified format, and occurs in a specified order. This makes it easy to work with.
Unstructured data sources are those that you have little or no control over. You are going to get what you get. Text data, video data, and audio data all fall into this classification. A picture has a format of individual pixels set up in rows, but how those pixels fit together to create the picture seen by an observer is going to vary substantially in each case. There are sources of big data that are truly unstructured such as those preceding. However, most data is at least semi-structured.
Semi-structured data has a logical flow and format to it that can be understood, but the format is not user-friendly. Sometimes semi-structured data is referred to as multi-semi-structured data. There can be a lot of noise or unnecessary data intermixed with the nuggets of high value in such a feed. Reading semi-structured data to analyze it isn’t as simple as specifying a fixed file format. To read semi-structured data, it is necessary to employ complex rules that dynamically determine how to proceed after reading each piece of information.
Web logs are a perfect example of semi-structured data. Web logs are pretty ugly when you look at them; however, each piece of information does, in fact, serve a purpose of some sort. Whether any given piece of a web log serves your purposes is another question. See Figure 1.1 for an example of a raw web log.
Figure 1.1 Example of a Raw Web Log
WHAT STRUCTURE DOES YOUR BIG
DATA HAVE?
Many sources of big data are actually semi-structured or multi-structured, not unstructured. Such data does have a logical flow to it that can be understood so that information can be extracted from it for analysis. It just isn’t as easy to deal with as traditional
structured data sources. Taming semi-structured data is largely a matter of putting in the extra time and effort to figure out the best way to process it.
There is logic to the information in the web log even if it isn’t entirely clear at first glance. There are fields, there are delimiters, and there are values just like in a structured source. However, they do not follow each other consistently or in a set way. The log text generated by a click on a web site right now can be longer or shorter than the log text generated by a click from a different page one minute from now. In the end, however, it’s important to understand that semi-structured data does have an underlying logic. It is possible to develop relationships between various pieces of it. It simply takes more effort than structured data.
incorporate it into their analytical processes. Truly unstructured data can be much harder to tame and will remain a challenge for organizations even as they tame semi-structured data.
EXPLORING BIG DATA
Getting started with big data isn’t difficult. Simply collect some big data and let your organization’s analytics team start exploring what it offers. It isn’t necessary for an organization to design a production-quality, ongoing data feed to start. It just needs to get the analytics team’s hands and tools on some of the data so that exploratory analysis can begin. This is what analysts and data scientists do.
There is an old rule of thumb that 70 to 80 percent of the time developing an analysis is spent gathering and preparing data and only 20 to 30 percent is spent analyzing it. Expect that those guidelines will be low when initially working with big data. Analytic professionals will initially probably spend at least 95 percent, if not close to 100 percent, of their time just figuring out a big data source before they can even think about doing in-depth analysis with it.
It is important to understand that that’s okay. Figuring out what a data source is all about is an important part of the analysis process. It may not be glamorous or exciting, but iteratively loading data, examining what it looks like, and adjusting the load processes in order to better target the data that is needed are immensely important. Without completing those steps, it won’t be possible to proceed to the analysis phase.
something of value, no matter how small, will keep people interested in the process and help them see that there is progress being made. A cross-functional team can’t get started and a year later claim they are still figuring out how to do something with big data. It is necessary to come up with some ideas, even if they are small, and make something happen quickly.
DELIVER VALUE AS YOU GO
It will take a lot of effort to figure out how to apply a source of big data to your business. An organization’s analytic professionals and their business sponsors must be sure to look for ways to deliver small, quick wins as they go. It will demonstrate to the
organization that progress is being made and will build support for further efforts. Such wins can also generate a solid return on
investment.
A great example comes from a European retailer. The company wanted to start leveraging detailed web log data. As they built complex, long-term processes to capture the data, they first put in place a few simple processes. They started by identifying what products each customer browsed. The browsing information was used for a basic follow-up e-mail campaign that sent each customer a message if they left the site after viewing products, but did not end up purchasing them. This simple exercise generated a huge amount of revenue for the organization.
MOST BIG DATA DOESN’T
MATTER
The fact is that most big data just doesn’t matter. That sure sounds harsh, doesn’t it? But it’s not meant to be. As we have already discussed, a big data stream is going to be large in terms of volume, velocity, variety, and complexity. Much of the content of a big data stream won’t matter for any given purpose, and some of it won’t matter much at all. Taming the big data tidal wave isn’t about getting all the water from the wave nicely controlled in a swimming pool. It’s more like sipping water from a hose: You slurp out just what you need and let the rest run by.
Within a big data feed there will be some information that has long-term strategic value, some that will be useful only for immediate and tactical use, and some data that won’t be used for anything. A key part of taming big data is to determine which pieces fall into which category.
A great example of this is related to the radio frequency identification (RFID) tags we discuss in Chapter 3 that are being placed today on pallets of products when they are shipped. For expensive items, tags are even being placed on individual items. Eventually, tagging is going to move to individual items as the rule rather than the exception. Today, that is cost prohibitive in most cases, so the tags are often placed on each pallet. The tags make it easier to track where the pallets are, when they are loaded and unloaded, and where they are stored.
Imagine a warehouse with tens of thousands of pallets. Each pallet has an RFID tag. RFID readers query the warehouse every 10 seconds saying, basically, “Who is out there?” Each of the pallets responds back: “I am.” Let’s discuss how in this case big data starts to be narrowed down very quickly.
here. I’m here. I’m here.” Upon completion of each of the 10 second polls taken, it’s very well worth the effort to parse through all the replies and identify any pallets that have had a change in status. This way, it can be validated that any changes were expected, and action can be taken if a pallet changed status unexpectedly.
Once a pallet actually leaves the warehouse, it is no longer responding. After validating that the pallet was expected to leave when it did, all of the intermediate “I’m here” records really don’t matter. Over time, all that really matters are the date and time when the pallet entered the warehouse and the date and time when it left. If those times are three weeks apart, it only makes sense to keep the two time stamps associated with the entry and exit of the pallet. All of the responses at 10 second intervals in between, saying “I’m here. I’m here. I’m here,” have no long-term value whatsoever, but it was necessary to collect them. It was necessary to analyze each at the moment it was generated. But the responses outside the first and last have no long-term value. They can be safely thrown away once the pallet is gone.
GET READY TO THROW DATA AWAY
One key to taming big data will be to identify what pieces matter. There will be pieces that have long-term strategic use, pieces that have short-term tactical use, and pieces that don’t matter at all. It will seem odd to let a lot of data slip past, but that is par for the course with big data. Throwing data away will take some getting used to.
interactions with. The tags, which are not seen by the user, will report back that a user has done something. Since only tagged items are reported, most browsing information is ignored from the start. The problem is if a request to have a new promotional image tagged is inadvertently missed, there will be no ability to go back and analyze interactions with that image. It has to be tagged before a user browses. It is possible to add a tag later, but only activity from that point forward will be captured.
There are newer methodologies that will parse through raw web logs and enable the identification of anything that occurred without having predefined it. These methods are log-based since they leverage a raw web log directly. The value of this is that if you realize later that you forgot to capture interactions with the promotion image, you can go and parse through the data again and pull it out. In this case, nothing is thrown away up front, but what to keep will need to be determined at the time of analysis. That is an important capability and is why keeping some historical big data, as long as it is cost-effective to do so, makes sense. How much historical data can be kept will depend on the size of a data feed and how much storage is reasonably available. It is a good idea to leave as much flexibility as possible within those constraints by keeping as much history as available storage will economically allow.
FILTERING BIG DATA
EFFECTIVELY
transformed (T) through various aggregations, functions, and combinations to get it into a usable state. Last, the data is loaded (L) into whatever environment will be leveraged to analyze the data. That is the process of ETL.
Let’s go back to the analogy we discussed earlier: sipping water out of a hose. When you’re drinking water out of a hose, you don’t really care which parts of the stream of water get in your mouth. With big data, you care very much about which parts of the data stream get captured. It will be necessary to explore and understand the entire data stream first. Only then can you filter down to the pieces that you need. This is why the up-front effort to tame big data can take so long.
SIPPING FROM THE HOSE
Working with big data is a lot like taking a drink from a hose.
Most of the data will run past, just like most of the water does. The goal is to sip the right amount of data out of the data stream as it flows past, not to try and drink it all. By focusing on the important pieces of the data, it makes big data easier to handle and keeps efforts focused on what is important.
Analytic processes may require filters on the front end to remove portions of a big data stream when it first arrives. There will be other filters along the way as the data is processed. For example, when working with a web log, a rule might be to filter out up front any information on browser versions or operating systems. Such data is rarely needed except for operational reasons. Later in the process, the data may be filtered to specific pages or user actions that need to be examined for the business issues to be addressed.
to succeed. Traditional structured data doesn’t require as much effort in these areas since it is specified, understood, and standardized in advance. With big data, it is necessary to specify, understand, and standardize it as part of the analysis process in many cases.
MIXING BIG DATA WITH
TRADITIONAL DATA
Perhaps the most exciting thing about big data isn’t what it will do for a business by itself. It’s what it will do for a business when combined with an organization’s other data.
Browsing history, for example, is very powerful. Knowing how valuable a customer is and what they have bought in the past across all channels makes web data even more powerful by putting it in a larger context. We’ll explore this in detail in Chapter 2.
Smart-grid data is very powerful for a utility company. Knowing the historical billing patterns of customers, their dwelling type, and other factors makes data from a smart meter even more powerful by putting it in a larger context. We’ll look at this in Chapter 3.
The text from customer service online chats and e-mails is powerful. Knowing the detailed product specifications of the products being discussed, the sales data related to those products, and historical product defect information makes that text data even more powerful by putting it in a larger context. We’ll explore this topic from different perspectives in Chapters 3 and 6.
together since they are in one location. They are no longer completely separate. For example, do certain employees increase customer value through their interactions more than others? Such questions are much easier to answer if the data is all in one place. As big data is added in, it just continues to evolve the number and magnitude of problems that can be addressed as ever more types of data can be combined together to add new perspectives and contexts.
MIX IT UP!
The biggest value in big data can be driven by combining big data with other corporate data. By putting what is found in big data in a larger context, the quantity and quality of insights will increase exponentially. This is why big data needs to be folded into an overall data strategy as opposed to having a stand-alone big data strategy.
This is why it is critically important that organizations don’t develop a big data strategy that is distinct from their traditional data strategy. That will fail. Big data and traditional data are both pieces of the overall strategy. To succeed, organizations need to develop a cohesive strategy where big data isn’t a distinct, standalone concept. Rather, big data must be simply another facet of an enterprise data strategy. From the start, it is necessary to think through and plan not just how to capture and analyze big data by itself, but also how to use it in combination with other corporate data and as a component of a more holistic approach to corporate data.
THE NEED FOR STANDARDS
structured over time, and individual organizations will fine-tune their big data feeds to be friendlier for analysis. But more important, there will be a move toward industry standards. While text data like e-mail or social media commentary can’t be controlled very much on the input end, it is
possible to standardize the approaches to interpreting such data and using it for analytics. This is already starting to happen.
For example, what words are “good” and what words are “bad”? What contexts exist where the default rules don’t apply? Which e-mails are worth exhaustive parsing and analysis, and which can be processed minimally? Standards for the production and generation of big data will develop, as will the standards for the processing and analysis of big data. Both the input and output sides will be addressed. As a result, life will get easier for those tasked with taming it. It will take time and many of the standards that develop will be more of a set of commonly accepted best practices among practitioners than formally stated rules or policies from an official standards organization. Nevertheless, standardization will increase.
STANDARDIZE TO THE EXTENT POSSIBLE
While text data like e-mail can’t be controlled very much on the input end, it is possible to standardize the approaches to
interpreting such data and using it for analytics. You won’t be able to standardize everything about big data, but you can standardize enough to make life much easier. Focus on standardizing the use of big data as much as on standardizing the input feed itself.
smart-grid data will be much more manageable than if every utility had just started creating data in their own way without thinking it through ahead of time with their peers.
TODAY’S BIG DATA IS NOT
TOMORROW’S BIG DATA
As discussed at the start of the chapter, the accepted definitions of big data are somewhat “squishy.” There is no specific, universal definition in terms of what qualifies as big data. Rather, big data is defined in relative terms tied to available technology and resources. As a result, what counts as big data to one company or industry may not count as big data to another. A large e-commerce company is going to have a much “bigger” definition of big data than a small manufacturer will.
More important, what qualifies as big data will necessarily change over time as the tools and techniques to handle it evolve alongside raw storage size and processing power. Household demographic files with hundreds of fields and millions of customers were huge and tough to manage a decade or two ago. Now such data fits on a thumb drive and can be analyzed by a low-end laptop. As what qualifies as high volume, high velocity, high variety, and high complexity evolves, so will big data.
“BIG” WILL CHANGE
What’s big data today won’t be considered big data tomorrow any more than what was considered big a decade ago is considered big today. Big data will continue to evolve. What is impossible or
unthinkable today in terms of data volume, velocity, variety, and complexity won’t be so years down the road. That’s how it has always been, and it will continue as such in the era of big data.