AN ASSESSMENT OF TRANSPORT POLICY FOR
TOURISM CITY
—CASE STUDY: FOREIGN USERS SATISFACTION
OF TRANSJOGJA—
Aleksander PURBA
1, Fumihiko NAKAMURA
2, Shinji TANAKA
3, Peamsook SANIT
4Ryo ARIYOSHI
51Doctoral Student, Graduate School of Urban Innovation, Yokohama National University
(79-5 Tokiwadai, Hodogaya-ku, Yokohama, Kanagawa 240-8501, Japan) E-mail: [email protected]
2Member of JSCE, Professor, Graduate School of Urban Innovation, Yokohama National University
(79-5 Tokiwadai, Hodogaya-ku, Yokohama, Kanagawa 240-8501, Japan) E-mail: [email protected]
3Member of JSCE, Associate Professor, Graduate School of Urban Innovation, Yokohama National University
(79-5 Tokiwadai, Hodogaya-ku, Yokohama, Kanagawa 240-8501, Japan) E-mail: [email protected]
4Researcher, Graduate School of Urban Innovation, Yokohama National University
(79-5 Tokiwadai, Hodogaya-ku, Yokohama, Kanagawa 240-8501, Japan) E-mail: [email protected]
5Member of JSCE, Research Associate, Graduate School of Urban Innovation, Yokohama National University
(79-5 Tokiwadai, Hodogaya-ku, Yokohama, Kanagawa 240-8501, Japan) E-mail: [email protected]
The Jogjakarta economy is largely dependent on education and tourism industry. The emerging domi-nance of private transport has reached to a degrading traffic conditions. Severe traffic congestions and high level of air pollution have been affecting the attractiveness of Jogjakarta, a popular tourism city in Indo-nesia. Unless a new approach of urban transport system development, it is feared that the amount of visitors will keep declining and hence affecting the city economy. From the awareness of the increasingly complex issues, the Ministry of Transportation of Indonesia enacted a decree No 51 of 2007 promoting pilot cities for land transport improvement. This paper originally examines the existing transport policy framework before and after new transit, TransJogja, implementation. The impact of service quality policies on visitor’s will-ingness to take trip by transit is then investigated by using SEM model. From organizational structure point of view, there are only two institutions in terms of urban public transport management at city level, i.e. the city government as the regulator and operators as the service provider. There is no direct relation between the two institutions that can be used to develop the system and to encourage the number of passengers. More than two years after TransJogja was launched, the Cities Development Initiative for Asia (CDIA) was ap-pointed to undertake a review of the urban transport plans for Jogjakarta and the surrounding urban area, however, over three years later the provincial, city and regency governments are in complete support of the strategy of the conducted research and in particular the improvements proposed. According to SEM results, rather than TranJogja service quality, the information and English guidance factor is the main consideration for the foreign users to travel by the transit.
Key Words : Tourism city, Foreign users, Satisfaction, Service quality, SEM
1. INTRODUCTION
The lack of sustainable transport policy imple-mentation might be common in most of Asian de-veloping cities even they already know much of
aspects. The present transport policies are aiming at GHG reduction, and the enhancement of the transport safety and social equality, and deal with major issues such as securing investment finances, improvement of governance, and utilization of so-phisticated technologies. Based on the results of such researches, transport projects involving spe-cific practical measures have been carried out, and significant efforts have been made to develop sus-tainable transport systems.
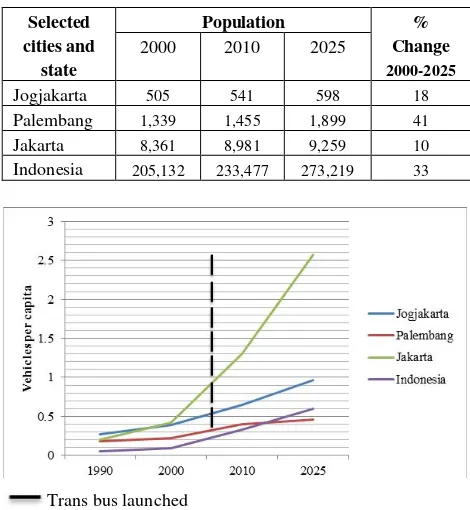
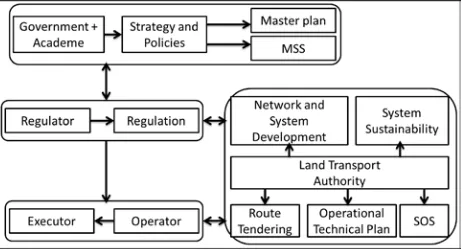
It is inevitable that an increasing in population generates higher in travel demand. Indonesia as one of the most populated countries in the world next after China, India, and USA are facing a large number of travel demand (see Table 1). In the period 2000 to 2025, for example, the city of Palembang as the second largest city in Sumatra and capital of South Sumatra province has a growth rate of more than 40%. The city is estimated to be occupied to almost two million inhabitants2). In the same period, Jogjakarta has a growth rate of 18%, whose figure is almost double from Jakarta (10%)3). Nowadays, Indonesia deals with an explosive growth in vehicle ownership and utilization. An increased road length and new roads generate faster and longer trips, more trips by car and higher car ownership all of which trigger to more traffic congestion and pollution (see Fig 1 and Fig 2).
Meanwhile the mode share of walking, cycling, public transport, private car, motorcycle and non-motorized varies very significantly across cities (see Fig 3). The Ministry of Transportation (MoT) database finds evidence of public transport mode shares as low as 16% in Jogjakarta and as high as 58.9% in Palembang. Jakarta itself is 39.1%, much higher than Jogjakarta and lower than Palembang4). Much of the variation can be explained by factors such as urban density, relative prices and speeds of public versus private transport and the reach and quality of the public transport network. Even within a same region, cities which are close each others can have significantly different mode shares due to a result of the different policies and history of de-velopment of the systems.
One notable difference between developed and developing countries, particularly those in Indone-sian cities, is the importance of powered two-wheelers where the mode share is as high as 52% in Jogjakarta, 21.1 % in Palembang and 13.1% in Jakarta. From the awareness of the increasingly complex issues, the Ministry of Transportation of Indonesia enacted a decree No 51 of 2007 promoting pilot cities for land transport improvement5). The
decree mandates the pilot city candidates to reflect
Table 1 Growth in selected cities and state (population in 000s).
Selected cities and
state
Population %
Change 2000-2025
2000 2010 2025
Jogjakarta 505 541 598 18
Palembang 1,339 1,455 1,899 41
Jakarta 8,361 8,981 9,259 10
Indonesia 205,132 233,477 273,219 33
Trans bus launched
Fig 1 Forecast changes in vehicles ownership per capita.
Trans bus launched
Fig 2 Forecast changes in motorcycles ownership per capita.
Fig 3 Modal share in selected cities and capital
ca-pacity, funding caca-pacity, human resource availabil-ity and transportation master plan. From the target of thirty pilot cities by 2014, to date, twenty seven cities have signed a memorandum of understanding with MoT and launched more than twenty new transit systems across the region, including TransJakarta as the pioneer of the program. TransJogja of Jogjakarta is included in the MoT program.
This paper examines the existing transport policy framework before and after new transit implemen-tation and its impact regarding service quality by focusing on the foreign users only in famous tourism city of Jogjakarta. The next step is to explore users’ satisfaction with new transit in order to see if the transport policies are related to user satisfaction as well, and to propose implications for the future by testing some hypotheses related to the service qual-ity, information and English guidance, satisfaction, and willingness take trip by transit.
This paper begins by providing some brief in-formation about transport policy framework at city level and its impact regarding service quality, fol-lowed by a concise explanation of the methodology and data collection. Estimation results of the model, accompanied by the significance tests, are also presented. The final section provides some con-cluding comments.
2. TRANSJOGJA CHARACTERISTICS
In contrast to other regions in Indonesia, the Jogjakarta economy is largely dependent on educa-tion and tourism industry. Recent data shows, many university students live in Jogjakarta and surround-ing areas; approximately 51,000 students and 2,400 lecturers attend the University of Gadjah Mada alone6). Other big universities with more than 10,000 students are Jogjakarta State University, Islamic Indonesia University, and Atma Jaya University, respectively7). Moreover, Jogjakarta is ranked after Bali as the most visited tourist place, making its city as the center for tourism, though the two most prominent attractions are Borobudur and Prambanan that lie 42 km and 17 km away. These two temples draw the majority of Jogjakarta’s international tourists to the city and each receives about 1.1 mil-lion visitors annually.
Only the Sultan palace and historical surrounding areas, which are the most visited international tourist attraction in the city, attracted 152,843 foreign tourists in 20108). In addition to a legacy of historic structures, Jogjakarta is commonly known as the cultural heart of Java and is blessed with rich
tradi-tions of music, dance, and theatre, as well as a vari-ety of craft industries, including leather, batik, pot-tery, painting, and silver. Recent years, the golf course is also capturing attention for some foreign tourists visiting Jogjakarta, mainly from South Ko-rea and Japan, because the cost of playing golf in this city is cheaper than in many other countries.
There are a number of travel agencies providing charter bus rental services which are the fastest and most convenient to get to the tourist spots for the city and its surrounding areas, including Borobudur and Prambanan. However, the emerging dominance of private transport has reached to a degrading traffic conditions. Severe traffic congestions and high level of air pollution has been affecting the attrac-tiveness of the city in Indonesia. To cope with these situations, in 2008 the provincial government began to operate the new transit system of TransJogja. The new financing approach for urban transportation operation is named buys the service system. Under the system, the provincial government buys the ser-vice provided by operator based on Rupiah per travel-km. The Rupiah unit per travel-km is calcu-lating based on operational costs. All revenue from the service operation is collected by the provincial transportation authority to be used for paying the operational expenses. When deficit occurs (opera-tional income < opera(opera-tional expenses), the subsidy mechanism is employed. But in surplus condition, it will be used for developing the system. Unfortu-nately, after a few years of operation, number of passengers has gradually decreased as the service quality also has simultaneously declined. In fact, during five years of the contract the provincial government allocates funding to local transport au-thority about Rp 30 billion annually for operating subsidies of TransJogja.
3. ASSESSING TRANSPORT POLICY
FRAMEWORK
(1) Organization plan
Indeed, developing implementation strategy for long term plan of urban public transportation is one of the important components. The implementation is also used as the learning process to improve the sustainable system. There is no assurance that the production of academic document is a perfect result. Reviewing from countries succeeded in imple-menting transit system, it can be concluded that each of the implementation step highly depends on the government’s role and allocated fund.
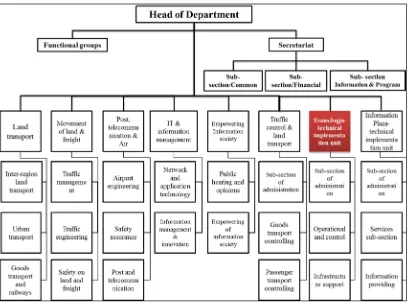
the government to undertake from planning to im-plementation. They are organization plan, financial plan, procurement, construction and implementation plans, and monitoring and evaluation, respectively. Further, in providing urban transport services, four institutions should be established i.e. strategy and policy institution, regulation institution, manage-ment institution and operator. They are related to the system and correlated to each other9).
Unfortunately, there are only two institutions in terms of urban public transport management at city level in Indonesia i.e. the city government as the regulator and operators as the service provider. There is no direct relation between the two institu-tions that can be used to develop the system. The reason is the existing operators consist of individu-als who own the fleets instead of professional en-terprises. Referring to such conditions, good moni-toring and evaluating system would be quite difficult to create proper services (Fig 4).
As the diagram shows, government is assisted by academics to develop the public transport strategy and policy, in which will be put into the master plan and Minimum Service Standard (MSS). The strategy and policy are adjusted with the need on the fields. The master plan and MSS are then strengthened with regulation (the decree) released by the regulator to be officially implemented. Official regulation must be flexible in nature in proportion to both technical and cultural condition on the field.
Hereafter, official regulation is used as the foundation by Land Transport Authority to set out the network and system development, sustainable system plan, service operational standards (SOS), implementation technical plan (operational) and the route tender process (operator selection). In its development, the regulation is also adjusted to the development and sustainable plans. Operator itself is selected from procurement tender undertake by the management body of urban transportation10). Ideally, the selected operator should be an enterprise capable of operating one or more routes within the city. In providing its service operation, operator must comply with standard operational procedure and prevailing official regulation. The development of service operation can also be used as inputs for the management to develop the standard, development plans and sustainable plans.
Responsibilities for urban transport, however, need to be comprehensively assigned to a lead agency to overcome the problems of poor coordina-tion and execucoordina-tion. This generally means that
Fig 4 Organizational system of urban public transport.
several actions need to be taken across different sectors and multiple subsystems, but in a well-integrated manner. This requires comprehen-sive and integrated thinking about land use planning, environmental quality, energy, services for the poor and physically disadvantaged, and so on11).
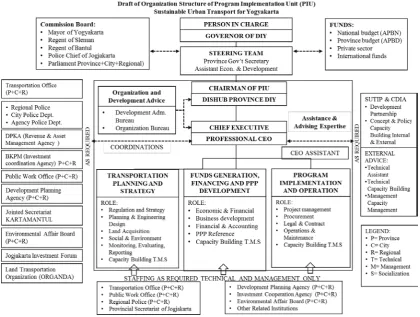
Fig 5 Organizational structure of transport department.
(2) Proposed organization structure
In November 2000 or more than two years after TransJogja was launched, the Cities Development Initiative for Asia was appointed to undertake a review of the urban transport plans for Jogjakarta and the surrounding urban area3). The main objec-tives of this study are; firstly, to establish an urban transport sector strategy for Jogjakarta and recom-mend the necessary policy and regulatory frame-work improvements to implement the strategy. The purpose of this strategy is to help the government of Jogjakarta to form a long-term vision for sustainable urban transport development which will support Jogjakarta’s economic development and social wellbeing. Secondly, to strengthen the capacity of key institutions involved in the management and service delivery of the urban transport sector, in-cluding local and provincial level agencies as ap-plicable. The purpose of this is to help ensure the benefits proposed by the investments are actually realized.
It formulated a sustainable urban transport sector strategy and high priority investment package for the greater Jogjakarta urban area in province. It is the result of a detailed, collaborative effort between the provincial and city governments, the Cities Devel-opment Initiative for Asia (CDIA)3) and its Con-sultants, the Sustainable Urban Transport
Im-provement Project (SUTIP), and a wide range of government and other community based stakehold-ers12).
Both the provincial and city governments have subsequently expressed strong commitment to im-plement the transport strategy and deliver the rec-ommended transport infrastructure improvements.
This will dramatically improve the city’s urban transport modes, and contribute significantly to Jogjakarta’s attractiveness and urban amenity. As such, this initiative reflects fully the needs and de-sires of a wide range of stakeholders.
Fig 6 Proposed ofPIUorganizational structure.
However, over three years later these provincial, city and regency governments are in complete sup-port of the strategy of the conducted research and in particular the improvements proposed. PIU as a proposed lead agency has not been established; the transportation department as lead agency has not changed, and there has been no change in terms of transport policy framework.
Meanwhile, the development of international tourism, together with the steady increase of Jogja-karta’s student population over the last decade, has changed the appearance of the city. As the impact of a foreign oriented consumer culture, the city has a lot of star-rated transnational chain hotels such as No-votel, Ibis, Hyatt and Sheraton. Unfortunately, the strength of Jogjakarta’s tourism lies in some aspects, including poor image of urban public transport which is unsafe and uncomfortable.
In order to measure the service level, authors ex-plore user perceptions of new transit operation, re-garding service quality, information and English guidance, satisfaction, and willingness take trip by transit expressed by the foreign tourists of Jogjakarta TransJogja. Authors’ proposed a path analysis with structural equation modelling (SEM) due to its useful to researchers as a multivariate technique combining
regression, factor analysis, and analysis of variance to estimate interrelated dependence relationships simultaneously.
4. METHODOLOGY
(1) Structural equation models
It is inevitable, the structural equation modelling (SEM) method spread rapidly as a consequence of the rapid development of specific packages, like LISREL13), 14),15) and AMOS16). The presence of these packages has encouraged some applications in dif-ferent contexts. This approach enables the modelling of a phenomenon by considering both the unob-served latent construct and the obunob-served indicators that describe the phenomenon.
Originally, SEM are made up of two components, i.e. the first describes the relationship between en-dogenous and exogenous latent variables, and per-mits the evaluations of both direction and strength of the causal effects among these variables (latent var-iable model); the second component describes the relationship between latent and observed variables (measurement model).
traditional methods like correlation and regression in many ways. First, both regression and path analysis are based on linear statistical models. Second, sta-tistical tests associated with both methods are valid if certain assumptions are met. Regression methods assume a normal distribution and path analysis as-sumes multivariate normality. Third, neither ap-proach offers a test of causality.
Traditional statistical methods normally utilize one statistical test to determine the significance of the analysis, R Square for regression analysis. Structural equation modeling, however, relies on several statistical tests to determine the adequacy of model fit to the data. The chi-square test indicates the amount of difference between expected and observed covariance matrices. A chi-square value close to zero indicates little difference between the expected and observed covariance matrices. In addition, the probability level must be greater than 0.05 when chi square is close to zero.
The Comparative Fit Index (CFI) is equal to the discrepancy function adjusted for sample size. CFI ranges from 0 to 1 with a larger value indicating better model fit. Acceptable model fit is indicated by a CFI value of 0.90 or greater.
Root Mean Square Error of Approximation (RMSEA) is related to residual in the model. RMSEA values range from 0 to 1 with a smaller RMSEA value indicating better model fit. Accepta-ble model fit is indicated by an RMSEA value of 0.06 or less. If model fit is acceptable, the parameter es-timates are examined.
The SEM model was developed according to previous research conducted by authors17). Authors add information and English guidance and willing-ness take trip by transit as the main determinants since the city is favored by international visitors.
In order to evaluate TransJogja service quality, the respondent was asked about three important minants with nine attributes, in which each deter-minant factor has three attributes (Table 2). In all question, respondents were asked to rate each at-tribute on a five point scale of satisfaction, ranging from very dissatisfied to very satisfied. Furthermore, the last one is a question regarding the willingness to take trip or re-use TransJogja for foreign tourists. The respondent asks whether he or she will make use of city transit bus on the next trip. For each question, the respondent was shown several prerequisites, such as if service quality improved, the services satisfy, and the service is safer. In all question, respondents were asked to rate each attribute on a five point scale of willingness, ranging from strongly disagree to strongly agree.
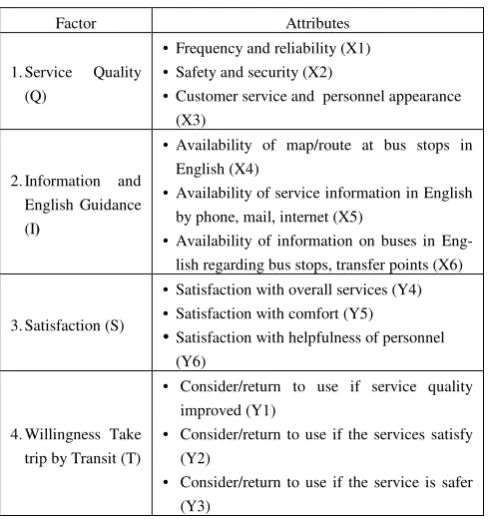
Table 2 Factor and attribute of services.
Factor Attributes
1. Service Quality (Q)
• Frequency and reliability (X1) • Safety and security (X2)
• Customer service and personnel appearance (X3)
2. Information and English Guidance (I)
• Availability of map/route at bus stops in English (X4)
• Availability of service information in English by phone, mail, internet (X5)
• Availability of information on buses in Eng-lish regarding bus stops, transfer points (X6)
3. Satisfaction (S)
• Satisfaction with overall services (Y4) • Satisfaction with comfort (Y5)
•Satisfaction with helpfulness of personnel (Y6)
4. Willingness Take trip by Transit (T)
• Consider/return to use if service quality improved (Y1)
• Consider/return to use if the services satisfy (Y2)
• Consider/return to use if the service is safer (Y3)
These attributes are similar to any other meas-urement taken by other researchers, but this research argues that a specific attribute selected for measuring the performance of new transit service in famous tourist city of Indonesia exists. This difference fluences the way user’s measure performance, in-cluding their expressions of willingness or return to use. We can deduce from this logic some hypotheses to test using structural equation modeling. These are that information and English guidance is positively related to satisfaction, that information and English guidance is positively related to willingness take trip by transit. Then, that service quality is positively related to satisfaction, that satisfaction is positively related to willingness take trip by transit, and that service quality is positively related to willingness take trip by transit.
(2) Data collection
staying, spending money, and complaints during the visit (see Table 3 and Fig 7).
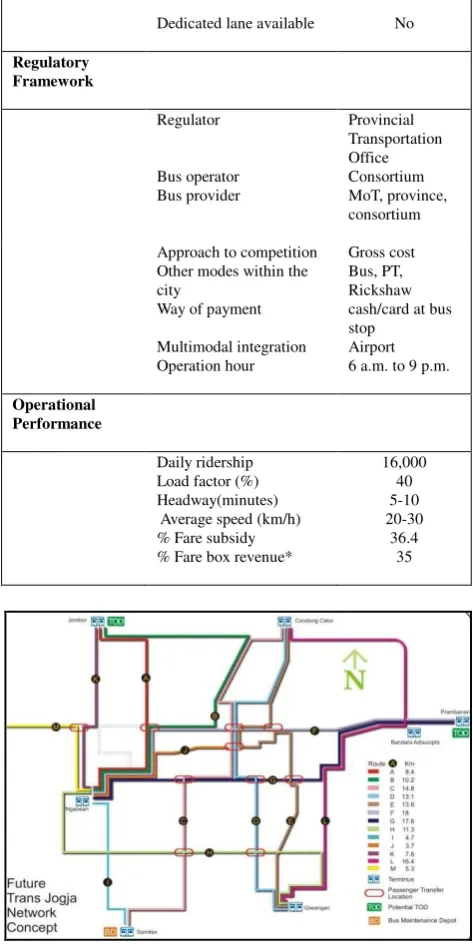
Jogja Tugu Trans Limited, a consortium transit agency manages the city transit lines. Generally, the service is available from 6 a.m. to 9 p.m. but a service frequency is delivering without timetable (Table 3). Based on field survey, the service frequency is var-ying from twenty five to sixty minutes depend on level of congestion along route and also weather conditions, since the buses running in the mix traffic. In rainy season, the travel time tends to be longer because of some roads are flooded, causing delay that exceeds normal travel time.
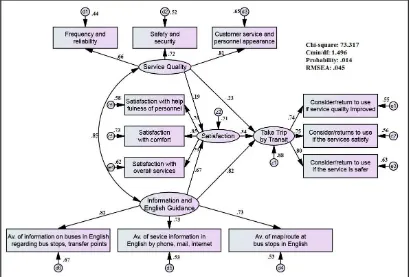
(3)Foreign user characteristics
Though the respondent is not significantly spread between male and female, the majority of the foreign transit users is male (59% of the sample). According to region origin, most of the interviewed foreign users are from Europe (36%), ASEAN/Asia Pacific (31%) and North America (30%). Moreover, nearly 40% of respondents claimed to visit Jogjakarta for the second time, 26% is the first visit and 24% is the third visit, indicating that the city is a famous tourism destination for foreign visitors.
The majority of respondent interests regarding culture (38%) follow by nature (25%), adventure (19%), and family (18%) as the reason for their visit to Jogjakarta. Further, about 41% of the sample stated that Borobudur and Prambanan as the main purpose of the visit, followed by Sultan palace (22%), golf course (15%), museum (13%), and beach (9%). However, in practice they may visit more than two or three tourist spots, because nearly half of the respondents (47%) with length of stay 5 to 6 nights, 23% with length of stay 7 nights or more, 18% with length of stay 3 to 4 nights, and 12% with length of stay 1 to 2 nights.
Three and four-stars hotel is a favorite accom-modation for respondents (64%); the total local spend per visitor per day of most respondent is $500 to $1,000 (44%), followed by $1,000 to $1,500 (21%), $500 (18%), and more than $1,500 (17%).
To success of tourism industry depends on a set of elements, including a more sustainable and holistic approach to local environmental management. However, these preconditions have not been fully implemented in Jogjakarta; according to the survey results, the most common complaints by respondents related to travel/tourism are less information on in-ternet (28%), security (27%), transportation (23%), signs in English (17%), and book/brochure and tour guide (5%) as described in Table 4.
Table 3 Transit Service Characteristics.
Urban Area
Year of implementation Number of fleets Number of routes Bus capacity Average length/route Number of bus stop/route
Dedicated lane available
2008
Approach to competition Other modes within the city
Way of payment
Multimodal integration Operation hour
Gross cost Bus, PT, Rickshaw cash/card at bus stop Average speed (km/h) % Fare subsidy
Table 4 Foreign Tourist Characteristics. Central & South America
Africa times have you visited this city
once
Which of these destinations
Length of stay in nights per visitor per day
up to $500 $500 to 1,000 $1,000 to 1,500 more than $1,500
38 to travel/ tour-ism
security less information on
in-ternet poor transportation
signs in English books/brochures and tour
guide
5. USER PERCEPTION OF NEW TRANSIT OPERATION
In this paper, path analysis was employed to re-veal the relationship among variables. Parameter estimates for foreigner user of TransJogja is pre-sented in Table 5 and Fig 7, respectively. The model has the chi-square as much as 73.317 (df = 49) re-sulting in the models being rejected at .05. This model has the normed chi-square (chi-square/df) as much as 1.496 or less than two as a perfect fit. The values of the NFI, IFI, and CFI for the model are 0.947, 0.982, and 0.981, respectively, which these values are near one, meaning the model is a perfect fit. Further, the RMSEA of this model is 0.045, with
Table 5 Parameter estimates by foreign users.
Parameter Standardized
1. Satisfaction ← Service quality 2. Satisfaction ← Information and English guidance
3. Take trip by transit ← Service quality 4. Take trip by transit ←Information and English guidance
5. Take trip by transit ←Satisfaction 6. Frequency and reliability ← Service quality
7. Safety and security ← Service quality 8. Customer service and personnel ap-pearance ← Service quality
9. Availability of map/route at bus stops in English ←Information and English guid-ance
10.Availability of service information in English by phone, mail, internet ← Infor-mation and English guidance
11.Availability of service information on buses in English regarding bus stops, transfer points ←
Information and English guidance 12.Consider/return to use if service quality improved ← Take trip by transit 13.Consider/return to use if the service satisfy ← Take trip by transit
14.Consider/return to use if service is safer ← Take trip by transit
15.Satisfaction with comfort ← Satisfac-tion
16.Satisfaction with helpfulness of per-sonnel ← Satisfaction
17.Satisfaction with overall services ← Satisfaction
Chi-square= 73.317; df= 49; Cmin/df= 1.496; Goodness of fit Probability level= .014; NFI= .947; IFI= .982;
CFI= .981; RMSEA= .045
***significant at 1%; **significant at 5%; *significant at 10%
value near to zero as a perfect fit. Based on these results, it is clear that the model has a good fitness, since all parameter fit values are obtained, which implies a good fit model.
Referring to Standardized Regression Weights in
Table 5, it is clear that all determinants of Service
Fig 7 Direct and indirect relationship among variables.
Furthermore, the two structural equations resulted by foreign users model are as follow:
Satisfaction = +
= + +
As the survey was administered to international visitors at a famous tourist destination, most re-spondents declared that they liked information and English guidance aspect more than service quality. In terms of satisfaction, respondent stated that nearly seventy percent of user satisfaction is solely influ-enced by information factor compared to less than twenty percent by service quality and about ten percent by other factors. Furthermore, the re-spondents have been demonstrated that the infor-mation and English guidance factor is the main consideration for taking trip by transit. In other words, the more improve information and English guidance is offered, the more increased satisfied customers as well as to increase travelers’ willing-ness to use transit.
All standardized loading estimates for factors of service quality are significant and range from 0.66 (frequency and reliability) up to 0.81 (customer service and personnel appearance). The highest
magnitude of satisfaction is the satisfaction with comfort (0.85), whereas the lowest is the satisfaction with helpfulness of personnel (0.76). While all standardized loading estimates for factors of infor-mation and English guidance are significant and range from 0.73 (availability of map/route at bus stops in English) up to 0.82 (availability of infor-mation on buses in English regarding bus stops, transfer points). The willingness take trip by transit construct has three factors, with consider/return using if the service is safer reaching the highest magnitude (0.80) and consider/return using if ser-vice quality improved as the lowest (0.74).
There are five hypotheses in which two regression weights are significant at 1% (p < 0.01), while three regression weights are significant at 5% (p < 0.05). The first hypothesis, which positively relates the information and English guidance with satisfaction, is statistically significant, supported by the positive value. This implies that the better the information and English guidance, the more satisfy the users are likely to be to this transit. This result looked natural, but needed to be tested to establish the proposed measurement construct. The second hypothesis, regarding the positive relationship between infor-mation and English guidance and willingness take trip by transit is also statistically supported. It stands to reason that better information and English guid-ance would increase transit users’ willingness take trip, also.
0.820
Information & English guidance
0.343
Satisfaction
0.670
Information & English guidance
0.194
Service quality
Willingness takes trip by transit
-0.226
The third hypothesis regarding the positive rela-tionship between service quality and satisfaction is also statistically supported. It stands to reason that higher service quality would be increase transit us-ers’ satisfaction as well. The fourth hypothesis concerning the positive relationship between satis-faction and willingness take trip by transit is also statistically supported, meaning the better infor-mation and English guidance would increase transit users’ willingness take trip by transit.
The fifth hypothesis, the relationship between service quality and willingness take trip by transit is confirmed by statistically significant negative value (-0.23). The last hypothesis supports the finding that foreign users do not perceive the service quality as main consideration in the use of transit since the quality service perception in developed and devel-oping countries are totally different.
Indeed, Jogjakarta has a unique and interesting cultural background. Its people’s hospitality and the beautiful tourism objects have brought Jogjakarta to be internationally well-known. However, city has not sufficient and adequate information and English guidance on what foreign tourists need to go to travel.
6. CONCLUSIONS AND IMPLICATIONS
This paper developed and applied a conceptual framework highlighting the transport policy that influence service quality in order to evaluate the current progress of new transit system projects in Indonesian cities.
In in terms of urban public transport management, however, there are only two of four institutions at city level in Indonesia i.e. the city government as the regulator and operators as the service provider. There is no direct relation between the two institu-tions that can be used to develop the system. Over five years of transit operation, the provincial, city and regency governments are in complete support of the strategy of the conducted research and in par-ticular the improvements proposed.
An inadequate organization structure of urban public transport in Jogjakarta has been thwarted effective urban transport management especially service quality. According to SEM results, rather than TranJogja service quality, the information and English guidance factor is the main consideration for the foreign users to travel by the transit.Based on the results of SEM analysis, the transport policies are interrelated to user satisfaction as well.
In order to maintain city culture and tourism re-sorts, more attentions are needed to keep the city
image as a livable, comfortable, safe and environ-mental friendly place. Urban transit system itself is considered as an additional tourism product, which adds to the total tourist experience. However, de-spite high investment costs and potential value, some urban transit systems are still not favored by international visitors as shown in this paper. Whereas, in order to attract more users, including international visitors, transport service providers should focus on understanding customer motivation, behavior, and satisfaction.
The next step is to enhance service performance of TransJogja to a level comparable to that of private transport, by improving efficiency in planning and operation stages. Then, the city should be able to establish and strengthen the city international image by establishment a comprehensive understandable and bilingual information system. And, to develop consumers oriented transportation system by priori-tizing to safety, convenience, and comfort, followed by undertake benchmarking with other international cities.
ACKNOWLEDGMENT: The authors would like
to acknowledgement general support of “Research on Low Carbon Transportation in Asia Project” supported by Ministry of Environment, Japan.
REFERENCES
1) Deakin, E. : Sustainability Development and Sustainability Transportation: Strategies for Economic Prosperity, Envi-ronmental Quality, and Equity, Working Paper, 2001-03. 2) Cities Development Initiative for Asia (CDIA):
Pre-Feasibility Study in Urban Transport Project, Palem-bang, Indonesia. PFS Report Executive Summary, March 2011.
3) Cities Development Initiative for Asia (CDIA): Pre-Feasibility Study in Urban Transport. Yogyakarta, Indonesia. Final Report – Executive Summary, July 2011. 4) Japan International Cooperation Agency (JICA)-Badan Perencanaan Pembangunan Nasional (BAPPENAS) : The Studi on Jabodetabek Urban Transportation Policy Inte-gration (JUTPI, Commuter Survey in Jabodetabek, 2010. 5) Ministry of Transport, Decree No 51/2007: Land Transport
Pilot Implementation Guidelines (Pedoman Penyeleng-garaan Percontohan Transportasi Darat), September 2007. 6) www.ugm.ac.id/ .
7) http://www.carikampus.com/index.php
8) Center for Tourism Studies, Gadjah Mada University: Satisfaction of tourists in the tourist destination of Jogja-karta) (Kepuasan wisatawan di daerah tujuan wisata kota Jogjakarta), October 2014.
Mada University, February 2006.
10) Centre for Research and Development of Land Transport (Puslitbang Hubdat), Ministry of Transport. : Monitoring and System Evaluation of Public Transport (Sistem Mon-itoring dan Evaluasi Angkutan Umum Perkotaan), 2005. 11) The World Bank Group. Institutional Labyrinth, designing
a way out for improving urban transport services: lessons from current practice, 2013
12) Sustainable Urban Transport Improvement Project (SUTIP), Indonesian Ministry of National Development Planning (BAPPENAS) and German Federal Ministry for Economic Cooperation and Development (BMZ), 2009-2016
13) Joreskog, K. G., and Sorbom, D. : PRELIS: A program for multivariate data screening and data summarization. A
preprocessor for LISREL. Chicago: SSI, Inc., 1988. 14) Joreskog, K. G., and Sorbom, D. : LISREL 7: A guide to
the program and application. Chicago: SPSS, Inc., 1989. 15) Joreskog, K. G., and Sorbom, D. : LISREL 8: Scientific
Software International. Chicago: SPSS, Inc., 1995. 16) Arbuckle, J.L., and Worthke, W. : Amos 4.0 User’s Guide,
Small Water Corporation,Chicago, IL., 1999.