Accounting Research Journal
Cont inuous disclosure and inf ormat ion asymmet ry Mark Russell
Article information:
To cite this document:
Mark Russell , (2015)," Continuous disclosure and information asymmetry ", Accounting Research Journal, Vol. 28 Iss 2 pp. 195 - 224
Permanent link t o t his document :
http://dx.doi.org/10.1108/ARJ-11-2013-0085 Downloaded on: 25 March 2017, At : 04: 39 (PT)
Ref erences: t his document cont ains ref erences t o 48 ot her document s. To copy t his document : permissions@emeraldinsight . com
The f ullt ext of t his document has been downloaded 1816 t imes since 2015*
Users who downloaded this article also downloaded:
(2015),"The effect of financial crisis on auditor conservatism: US evidence", Accounting Research Journal, Vol. 28 Iss 2 pp. 160-171 http://dx.doi.org/10.1108/ARJ-06-2013-0033
(2015),"Earnings management, funding and diversification strategies of banks in Africa", Accounting Research Journal, Vol. 28 Iss 2 pp. 172-194 http://dx.doi.org/10.1108/ARJ-07-2013-0045
Access t o t his document was grant ed t hrough an Emerald subscript ion provided by emerald-srm: 602779 [ ]
For Authors
If you would like t o writ e f or t his, or any ot her Emerald publicat ion, t hen please use our Emerald f or Aut hors service inf ormat ion about how t o choose which publicat ion t o writ e f or and submission guidelines are available f or all. Please visit www. emeraldinsight . com/ aut hors f or more inf ormat ion.
About Emerald www.emeraldinsight.com
Emerald is a global publisher linking research and pract ice t o t he benef it of societ y. The company manages a port f olio of more t han 290 j ournals and over 2, 350 books and book series volumes, as well as providing an ext ensive range of online product s and addit ional cust omer resources and services.
Emerald is both COUNTER 4 and TRANSFER compliant. The organization is a partner of the Committee on Publication Ethics (COPE) and also works with Portico and the LOCKSS initiative for digital archive preservation.
*Relat ed cont ent and download inf ormat ion correct at t ime of download.
Continuous disclosure and
information asymmetry
Mark Russell
UQ Business School, The University of Queensland, St. Lucia, Australia
Abstract
Purpose– This paper aims to examine whether firms with high information asymmetry disclose more information under a continuous disclosure regime, and, second, the paper examines whether continuous disclosures reduce information asymmetry.
Design/methodology/approach– The study models relations between continuous disclosures and information asymmetry using ordinary least squares regression and two-stage least squares regression.
Findings– The study finds firms with high information asymmetry disclose more information. Further, the study finds that disclosure in the presence of high information asymmetry increases asymmetry. Finally, while bad news increases information asymmetry, the disclosure of firm-specific good and bad news is associated with reduced information asymmetry.
Originality/value– The paper identifies conditions under which Continuous Disclosure Regime increases information in markets and influences information asymmetry.
Keywords Information asymmetry, Continuous disclosure, Firm performance expectations
Paper typeResearch paper
1. Introduction
This paper evaluates whether firms with higher information asymmetry disclose more information under the Australian Continuous Disclosure Regime (CDR), and second, whether continuous disclosures reduce information asymmetry. Regulators require continuous disclosure from companies in an expanding number of countries and stock exchanges: Australia, Canada, New Zealand, Germany, New Zealand, Singapore, Hong Kong Stock Exchange, London Stock Exchange, New York Stock Exchange, American Stock Exchange and NASDAQ (Oesterle, 1998;Table I).
The study is motivated by the increased regulation of disclosure in markets to alleviate information asymmetry. Information asymmetry leads to the inefficient allocation of investment resources, adverse selection, insider trading and other negative outcomes (Lev, 1988; Verrecchia, 2001). The limited CDR studies produce mixed empirical evidence on the effect of continuous disclosure on information asymmetry (Brown et al., 1999; Poskitt, 2005). This CDR evidence reflects the multifaceted relation between disclosure and information asymmetry in international studies
The author is grateful for helpful comments on this paper from Pete Clarkson, Greg Clinch, Dan Collins, Robert Czernkowski, Dan Dhaliwal, Jere Francis, Zoltan Matolcsy, Stephen Taylor, Terry Walter, Joe Weber, Peter Wells, Anne Wyatt and participants at the AFAANZ Conference 2010 in Christchurch, the American Accounting Association Annual Meeting 2010 in San Francisco, and the University of Technology Sydney seminar series. The author acknowledges financial support from the UTS School of Accounting and FIRN. Data supplied by the Securities Industry Research Centre Asia-Pacific on behalf of the ASX and Aspect Financial.
The current issue and full text archive of this journal is available on Emerald Insight at: www.emeraldinsight.com/1030-9616.htm
Disclosure
and
information
asymmetry
195
Received 26 November 2013 Revised 31 May 2014 Accepted 15 August 2014
Accounting Research Journal Vol. 28 No. 2, 2015 pp. 195-224 © Emerald Group Publishing Limited 1030-9616 DOI10.1108/ARJ-11-2013-0085
Table
I.
Comparison
of
market
disclosure
regulations
across
exchanges
Country
Monitoring and/or enforcement
agency Statutory regulation
Securities exchange
regulation Disclosure principle
Australia Australian Security and Investment
Commission co-regulates with the Australian Securities Exchange
Corporations Act (Cth) 2001
ASX Listing rules 3.1 Continuous disclosure of
price-sensitive information
Canada Canadian Securities
Administrators. Financial and Securities Commissions: British Columbia, Alberta, Saskatchewan, Manitoba, Ontario, Québec, New Brunswick, Nova Scotia
National Instrument 51-102
Continuous disclosure of material changes that would reasonably be expected to have a significant impact on market price or value
Securities Acts: (Ontario British Columbia, Alberta, Manitoba) United
Kingdom
Financial Services Authority UK Listing Authority,
Listing Rule 9 (London Stock Exchange)
Continuous disclosure of information reasonably likely to have a
significant effect on price
Germany Federal Securities Supervisory
Office
Securities Trading Act 1994, section 15
Disclose any information that could significantly influence the company’s stock price
Hong Kong Securities and Futures Commission Securities and Futures
Ordinance (Part XIVA)
A listed corporation must, after any inside information likely to have a material effect on price has come to its knowledge, disclose the information to the public
(continued)
ARJ
28,2
196
Table
I.
Country
Monitoring and/or enforcement
agency Statutory regulation
Securities exchange
regulation Disclosure principle
New Zealand Securities Commission of NZ Securities Markets Act
(NZ) 1988
NZX Listing rules 10.1.1 Continuous disclosure of
price-sensitive information
Singapore Monetary Authority of Singapore Securities and Futures
Act, section 203
SGX Listing Rulebooks Mainboard Rules Chapter 7 Part 2
Disclosure of information likely to materially affect the price or value of securities
United States NYSE Listed Company
Manual section 202.05
Release quickly to the public any news or information which might reasonably be expected to materially affect the market for its securities NASDAQ Listing Rules
5250
Disclosure of any material information that would reasonably be expected to affect the value of their securities or influence investors’ decisions
197
Disclosure
and
information
asymmetry
(Van Buskirk, 2012). Nevertheless, Australian CDR provides a data-rich environment to reconcile conflicting disclosure studies and clarify the unknown effects of continuous disclosure.
The key contribution from this paper is to identify conditions under which CDR reduces information asymmetry and increases disclosure. First, the study provides evidence that firms with high information asymmetry disclose more information. Second, the study indicates that disclosure in the presence of high information asymmetry increases asymmetry. Finally, while bad news is likely to increase information asymmetry, the disclosure of firm-specific good and bad news is associated with reduced information asymmetry.
The remainder of the paper is organized as follows. Section 2 reviews the Australian setting for continuous disclosure, the background literature and develops the hypotheses. Section 3 describes the research design, the empirical models and variables. The results are presented in Section 4, and Section 5 finishes the paper with conclusions.
2. Institutional background and hypothesis development 2.1 Continuous disclosure regulation
The Australian CDR commenced in September 1994 following prominent corporate failures that involved delayed disclosure and a perceived lack of transparency in the Australian stock market (Commonwealth Government Report of the Australian House of Representatives Standing Committee on Legal and Constitutional Affairs, 1991). The continuous disclosure rules are contained inASX Listing Rule 3.1as follows:
Once an entity is or becomes aware of any information concerning it that a reasonable person would expect to have a material effect on the price or value of the entity’s securities, the entity must immediately tell the ASX that information.
A reasonable person would be taken to expect information to have a material effect on the price or value of securities if the information would, or would be likely to, influence persons who commonly invest in securities in deciding whether or not to subscribe for, or buy or sell, the first mentioned securities (Section 677, Corporations Act 2001 (Cth)). Listing Rule 3.1B provides exceptions to continuous disclosure which require confidentiality, reasonableness and one or more of the following conditions:
• a breach of law to disclose;
• an incomplete proposal or negotiation; • matters of supposition;
• information generated for the internal management purpose; and • the information is a trade secret.
The Australian CDR is principle-based and differs from the bright-line specification of classes of information to be disclosed under other regimes. As illustrated inTable I, a number of countries and stock exchanges have continuous disclosure regimes.
2.2 CDR and managerial disclosure incentives
Despite disclosure regulation, managers have incentives to selectively disclose information. For example, managers disclose timely good news but delay or withhold bad news (Kothari et al., 2009). The selective disclosure of information and CDR
ARJ
28,2
198
“exception” clauses have raised questions about the operation of the CDR (Cassidy and Chapple, 2003; Hsu, 2009). Applying the CDR requires management judgment on price-sensitivity and price discovery in at least three dimensions. First, management must decide what information is price-sensitive and second whether information is exempt from disclosure. Third, management must decide the content and presentation of the information to be disclosed.
A number of studies consider the possibility that managers retain discretion in CDR disclosure (Brownet al., 1999;Hsu, 2009;Hsuet al., 2012). It is likely that CDR operates in line with earlier evidence that firms disclose by reference to their economic characteristics rather than strictly following disclosure rules (Frost and Pownall, 1994). Notwithstanding management incentives to selectively disclose, studies also suggest that CDR increased disclosure to change the Australian information environment.Hsu
et al.(2012)study the properties of analyst forecasts under the CDR as it evolved from 1988 to 2001.Hsu et al.(2012)find evidence suggesting changes in analyst forecast properties, and after 1998, forecast dispersion deteriorated for small firms. Nevertheless,
Corlettet al. (2000)suggest that CDR increased the disclosure of information. More specifically,Neagle and Tyskin (2001)examine regulatory activity and find small firms, loss firms and some industries are more likely to receive ASX price queries.Chanet al.
(2007)andDunstanet al.(2010)both find management earnings forecasts are associated with CDR.
The discretionary content and format of disclosure available to managers under CDR, and the conflicting incentives to disclose, potentially influence the impact of a mandatory disclosure regime on firms. Nevertheless, the study expects the economic benefits to the firm from increased disclosure and lower information asymmetry (Jung and Kwon, 1988;Healyet al., 1999), and CDR compliance pressure, to give management incentives to disclose under CDR:
H1. Firms with higher information asymmetry disclose more information under CDR.
2.3 Implications of the continuous disclosure regime for information asymmetry The disclosure benefits for the firm from lower information asymmetry include the convergence of investor beliefs, stock liquidity increases and lower price volatility (Lev, 1988). Nevertheless, higher day-to-day information asymmetry will persist for firms with more uncertain investments, longer-term projects and transactions (Affleck-Graves et al., 2002; Miller, 2002). Furthermore, disclosure may increase short-term information asymmetry for many firms. For example, disclosures may be costly for investors to process, or induce additional uncertainties and divergent opinions (Leeet al., 1993;Krinsky and Lee, 1996;Bamberet al., 2011). Unexpectedly, disclosure may also increase the information advantage of sophisticated investors (Indjejikian, 1991).
Australian studies are mixed on whether CDR disclosure reduces information asymmetry (Brownet al., 1999;Poskitt, 2005).Brownet al.(1999)find a significant association between CDR disclosure and information asymmetry but only for small companies and for companies performing relatively poorly. However,Brownet al.(1999)
recognize data sample limitations of the 1994-1996 post-CDR data available for their study. To study the effects of disclosure on informed trading,Poskitt (2005)uses the probability of informed trading (PIN) model (Easleyet al., 1996). He finds no evidence
199
Disclosure
and
information
asymmetry
that price-sensitive disclosures are associated with lower information based trading in the post-2002 period.
Consistent with the economic theory of disclosure consequences in markets (Leuz and Verrecchia, 2000), the study expects CDR disclosure to reduce information asymmetry. Nevertheless, in line with event studies (Krinsky and Lee, 1996), the study also expects CDR disclosure events to conditionally increase information asymmetry for firms with high pre-existing information asymmetry. This leads to the following hypotheses:
H2. Price-sensitive disclosure under CDR reduces information asymmetry. H3. Price-sensitive disclosure under CDR for firms with high information
asymmetry increases information asymmetry.
3. Empirical analysis 3.1 Sample and data
The initial sample includes all companies listed on the Australian Securities Exchange (ASX) between 1996 and 2006 with at least one year of market trading data. The sample for each test is determined by the model and measure of information asymmetry. Information asymmetry is measured annually and daily. The daily measurement of information asymmetry is affected by the large number of small firms in the ASX with thinly traded shares and zero trading days. To address these adverse trading effects, a daily sub-sample is based on the largest 500 ASX-listed firms over the period of 1996-2006, selected to exclude the firm-days with zero trading, zero price volatility and abnormally large bid-ask spreads (where a bid or ask has no corresponding ask or bid, respectively).
Price-sensitive disclosures come from the Securities Industry Research Centre of Asia-Pacific (SIRCA) signal G database. Financial and other company data and equity betas are from Aspect Huntley’s Fin Analysis database. Stock price and trading data for the ASX Securities Exchange Automated Trading System (SEATS) are from SIRCA databases. The bid-ask spreads for the ASX’s order-driven market come from SIRCA’s ASX Intra-day database, while the daily trading volume data and prices come from SIRCA’s ASX Daily database. Financial analyst data comes from I/B/E/S. The ASX’s industry classification is used until September 2002, after which the study uses the Standard and Poor’s Global Industry Classification System (GICS) as adopted by ASX in 2002.
3.2 Price-sensitive disclosure measure
The SIRCA Signal G database maintains ASX company announcements. The ASX announcements include those labeled price-sensitive, and other regulated and voluntary announcements. The announcements are categorized by the ASX using 19 primary codes:
(1) takeover announcements; (2) shareholder details; (3) periodic reports;
(4) quarterly activities report; (5) quarterly cash flow report; (6) issued capital;
(7) asset acquisition and disposal;
ARJ
28,2
200
(8) notice of meeting;
(9) stock exchange announcement; (10) dividend announcement; (11) progress report;
(12) company administration;
(13) notice of call (Contributing shares); (14) other;
(15) chairman’s address; (16) letter to shareholders; (17) ASX query;
(18) structured products; and
(19) commitments test entity quarterly reports.
Similar toBrownet al.(1999), the study measures price-sensitive disclosure (Disclosurei) as the number of price-sensitive disclosures recorded by the ASX for firmiaggregated for daydand yeart.
3.3 Information asymmetry measures
Information asymmetry measures include the bid-ask spread, trading volume and price volatility, as used in the financial literature (Leuz and Verrecchia, 2000).
Bid-Ask Spread – bid-ask spread is measured as the ratio of the quoted bid-ask spread to the quoted midpoint price for daydfor firmi:
AskPricei,d ⫺BidPricei,d
1
2(AskPricei,d⫹ BidPricei,d)
The measure is time-weighted where the weighting procedure is based on the number of seconds the quotation exists in each interval. Glosten and Milgrom (1985) model information asymmetry as a function of the bid-ask spread with a market maker. In markets such as the ASX that use electronic orders instead of a market maker, information asymmetry is also captured by the bid-ask spread (Brockman and Chung, 1999). The literature suggests that disclosure is positively associated with a lower bid-ask spread (Healyet al., 1999;Leuz and Verrecchia, 2000). A negative association is expected between bid-ask spread and price-sensitive disclosure under CDR.
Stock Price Volatility– Lower stock return volatility is associated with lower levels of private information held by insiders reflecting lower uncertainty associated with the stock (French and Roll, 1986). Price volatility is measured with the standard deviation of daily stock returns (RET_Volatility). A negative association is expected between stock price volatility and price-sensitive disclosures.
Trading Volume–Diamond and Verrecchia (1991)show that when investors’ beliefs converge, trading volume in the firm’s stock increases. Easleyet al. (1996) present complementary evidence that high volume stocks have lower information-based trading. Trading volume is measured with the natural logarithm of the share volume
201
Disclosure
and
information
asymmetry
traded for firm i (Ln(Volume)). A positive association is expected between trading volume and price-sensitive disclosures.
3.4 Empirical models
3.4.1H1– continuous disclosure.Disclosure Model (1) is tested jointly with information asymmetry Model (3) using a two-stage least squares regression model (2SLS):
Disclosurei,t⫽ ␣0⫹ ␣1Info_Asymmetryi,t⫹␣2Ln(Size)i,t⫹␣4Issuei,t
⫹␣5Performancei,t⫹ ␣6Leveragei,t⫹ ␣7Analysti,t
⫹␣8Earn_Chgi,t⫹
兺
␣jIndustryi,t⫹ i(1)
Where:
Disclosurei,t ⫽the annual number of price-sensitive firm disclosures for firmi for yeart;
Info_Asymmetryi,t⫽the annual average of bid-ask spread, stock return volatility or annual aggregate of trading volume for firmi;
bid-ask spread (Bid-ask spread) is measured as the ratio of the quoted bid-ask spread to the quoted midpoint price:
AskPricei,d ⫺BidPricei,d
1
2(AskPricei,d⫹ BidPricei,d)
The measure is time-weighted, where the weighting procedure is based on the number of seconds the quotation exists in each interval, measured for firmifor dayd, averaged annually;
⫽trading volume (Ln(Volume)) equals the natural logarithm of the aggregate stock trading volume for firmi, measured for yeart;
⫽stock price volatility (RET_Volatility) equals the standard deviation of time-weighted trade to the trade price for firmi for daydwhere standard deviation⫽(1/(n⫺1)冱[Price⫺Mean Price]2)1/2;n⫽the number of stock prices for firm i, mean stock price⫽mean stock price for firmicalculated for daydon a time-weighted basis;
Ln(Size)i,t ⫽the natural logarithm of the market value of equity computed as ordinary shares on issue multiplied by daily stock price for firmiat year-endt;
Issuei,t ⫽the yearly change in the number of outstanding common shares, scaled by the average total shares outstanding for yearstandt⫺
1;
Performancei,t ⫽net profit after tax before abnormal items for yeartscaled by average total assets for yearstandt⫺1;
Leveragei,t ⫽the total non-current liabilities for yeartdivided by average total assets for yearstandt⫺1;
ARJ
28,2
202
Analysti,t ⫽analysts’ following is an indicator variable taking the value of 1 if sell-side analysts provide a public stock recommendation (buy, hold or sell) for the stock at financial year-endt;
Earn_Chgi,t ⫽change in net profit after tax before abnormal items for yeart scaled by average total assets for yearstandt⫺1 for firmi; and Industryi,t ⫽an indicator variable equal to 1 for an ASX industry group up to 2002 and GICS classification after 2002, and 0 otherwise for firmi for yeart.
The dependent variable in Model (1) is the financial-year aggregate of firmiprice-sensitive disclosures. The independent variables in Model (1) include determinants of disclosure measured at financial-year end: firm size (Size) (Lang and Lundholm, 1993); financing transactions proxied by Leverage and Issue (Myers and Majluf, 1984); Analysts’ following (Analyst) (Bhushan, 1989); performance (Performance) (Lang and Lundholm, 1993); changes in performance (Earn_Chg); and industry (Clinch and Sinclair, 1987). The variablesearnings changeandinformation asymmetryreflect the evidence that when perceived investor information asymmetry is high, a firms’ disclosure increases (Lang and Lundholm, 1993).
3.4.2H2andH3– information asymmetry and continuous disclosure parsimonious model.The parsimonious information asymmetry Model (2) is tested using ordinary least squares (OLS) regression. In Model (2), information asymmetry is measured on day d⫹1 and price-sensitive disclosure is measured on dayd.The study also runs Model (2) with information asymmetry measured on day d, to examine the speed of any adjustment in the firm’s information asymmetry metrics, and found (untabulated) weaker but qualitatively similar results.
Info_Asymmetryi,d⫹1⫽ ␣0⫹ ␣1Disclosurei,d⫹ ␣2Info_Asymmetryi,d⫺1
⫹␣3Disclosurei,d ⫻ Info_Asymmetryi,d⫺1 ⫹␣kControlsi,d⫹ i
(2)
Where:
Info_Asymmetryi,d ⫽Information asymmetry is measured using three methods: bid-ask spread, trading volume and stock return volatility;
daily bid-ask spread is measured as the ratio of the quoted bid-ask spread to the quoted midpoint price.
AskPricei,d ⫺BidPricei,d
1
2(AskPricei,d⫹ BidPricei,d)
The measure is time-weighted, where the weighting procedure is based on the number of seconds the quotation exists in each interval, measured for firmifor dayd,d⫺1 andd⫹1;
Trading volume (Ln(Volume)) equals the natural logarithm of the daily share volume for firmi, measured for dayd,d⫺1 andd⫹1; and
203
Disclosure
and
information
asymmetry
Stock price volatility (RET_Volatility) equals the standard deviation of time-weighted trade to the trade price for firmi fordaydwhere standard deviation⫽(1/(n⫺1)冱[Price⫺ Mean Price]2)1/2;n⫽the number of stock prices for firmi.
The dependent variable in Model (2) is the bid-ask spread, trading volume or price volatility, measured for firm i at day d ⫹ 1. MODEL (2) includes the number of price-sensitive disclosures (Disclosure) for dayd, and an interaction term (Disclosurei,d⫻ Info_Asymmetryi,d⫺1). Model (2) also includes daydtrading volume (Ln(Volumei,d)) and stock return volatility (RET_Volatilityi,d) in some estimations as control variables because of the correlations between the market-based variables (Brownet al., 1999;Leuz and Verrecchia, 2000).
3.4.3 H2 and H3 – information asymmetry and continuous disclosure full model. Information asymmetry Models (3) and (4) are tested with OLS regressions. Second, to evaluate the possibility of bias from the non-random sampling of endogenous firm disclosure, the study tests Model (3) with Model (1) in a two-stage least squares regression.
Info_Asymmetryi,t⫽ ␣0⫹ ␣1Disclosurei,t⫹␣2Ln(Size)i,t⫹␣3Leveragei,t
⫹ ␣4MBVi,t⫹␣5E_Pi,t⫹ ␣6Sales_Growthi,t
⫹ ␣7Asset_Growthi,t⫹ ␣8Earn_Chgi,t⫹ ␣9Accrual_Chgi,t ⫹ ␣10RET_Volatilityi,t⫹␣11Ln(Volume)i,t
⫹ ␣12OwnerConci,t⫹ ␣13Betai,t⫹ ␣14RET_Mkti,t⫹ i
(3)
Info_Asymmetryi,t⫽ ␣0⫹ ␣1Disclosurei,t⫹␣2Ln(Size)i,t⫹␣3Leveragei,t
⫹ ␣4MBVi,t⫹␣5E_Pi,t⫹ ␣6Sales_Growthi,t
⫹ ␣7Asset_Growthi,t⫹ ␣8Earn_Chgi,t⫹ ␣9Accrual_Chgi,t ⫹ ␣10RET_Volatilityi,t⫹␣11Ln(Volume)i,t
⫹ ␣12OwnerConci,t⫹ ␣13Betai,t⫹ ␣14RET_Mkti,t ⫹ ␣gDisclosurei,t ⫻ FirmExpectationProxiesi,t⫹ i
(4)
Where the additional variables are measured as:
MBVi,d ⫽the market value of the equity for firmiusing the stock price at financial year-endt, divided by the accounting book value of equity measured for firmifor yeart;
E_Pi,d ⫽the earnings to price ratio equals the company’s reported earnings per share before abnormal items for firmiat financial year-endt divided by stock price at financial year-endtfor firmi;
SalesGrowthi,t⫽sales growth equals the change in operating revenue for firmifor yeartscaled by the average total assets for yearstandt⫺1; AssetGrowthi,t⫽asset growth equals the change in total assets for firmifor yeart
scaled by average total assets for yearstandt⫺1;
Accrual_Chgi,t⫽the change in accruals equals the change in earnings before tax, net interest, abnormal and significant items minus Cash Flow from
ARJ
28,2
204
Operations for firmifor yeart, scaled by average total assets for yearstandt⫺1;
OwnConci,t ⫽ownership concentration is the percentage of common shares on issue held by the top 20 shareholders measured at financial year-endtfor firmi;
Betai,t ⫽ beta is the equity beta measured as the standard deviation of market adjusted share returns over 2 years for firmifor yeartas computed by Aspect Huntley; and
RET_Mkti,d ⫽market return is the annualized value-weighted average price return on all stocks in the SIRCA share price and price relatives dataset.
Information asymmetry is modeled as a function of the firm’s growth rate, performance and information environment (Affleck-Graves et al., 2002; Brownet al., 2009). The information environment includes firm size, leverage and investment opportunities (Lang and Lundholm, 1993;Leuz and Verrecchia, 2000). FollowingPenman (1996)and
Tasker (1998), investment opportunities and growth are measured using the market-to-book value of equity ratio (MBV), sales growth (Sales Growth) and asset growth (Asset Growth). Expectations of earnings growth are measured using the price-earnings ratio, inverted to earnings-price ratio (E_P) to avoid small or zero values in the denominator (Penman, 1996). Earnings changes are included because earnings that change may be less informative than persistent earnings (Earn_Chg). Changes in accruals (Accruals_Chg) are defined as the change in the difference between earnings and operating cash flows scaled by total assets. The divergence between earnings and cash flow is linked to earnings management (Leeet al., 1999).
Finally, studies suggest that firms with volatile earnings have disclosure incentives to reduce information asymmetry (Miller, 2002). Model (4), therefore, includes interactions between disclosure and performance expectations measured by the market-to-book value of equity ratio, earnings-to-price ratio and changes in earnings and accruals as proxies for risk and growth (Disclosure ⫻ firm performance expectations).
Leuz and Verrecchia (2000) and Brown et al. (1999) find specific information environment associations between trading volume, firm size, stock return volatility, market index inclusion and ownership concentration. The study therefore includes stock beta (Beta), ownership concentration (OwnConc) and stock market return (RET_Mkt) in some estimations of Models (3) and (4).
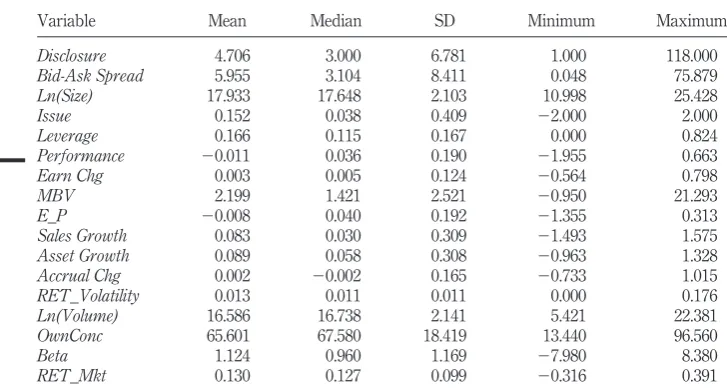
3.5 Descriptive statistics
Table IIpresents descriptive statistics for the variables in Models (1) and (3) using the sample of all ASX-listed companies. The disclosure and firm size Ln(Size) variables show wide variation. Leverage also varies widely between 0 and 82 per cent of average total assets. Owner concentration varies from 13.5 per cent of ordinary stock held by the top 20 shareholders to 96.5 per cent. The MBV minimum reflects a negative book value of equity up to a maximum value of 21.3. The mean MBV of 2.2 indicates the average sample firm is expected to grow while a small number of firms have very high expected future growth.
Table III presents descriptive statistics for the disclosure and information asymmetry variables in Model (2). The daily data sample contains the largest 500 ASX-listed companies by size.Table IIIindicates that 90 per cent of all firm days have
205
Disclosure
and
information
asymmetry
zero price-sensitive disclosures, while 9 per cent of the firm days have one price-sensitive disclosure.
Table IVreports correlations among the variables in the disclosure Model (1). Price-sensitive disclosure is negatively correlated with bid-ask spread consistent with disclosure-reducing information asymmetry (Leuz and Verrecchia, 2000). However, continuous disclosures are positively correlated with return volatility, indicating that information may also exacerbate uncertainty (Lee et al., 1993).
Table II.
Descriptive statistics for the variables in models (1), (3)-(4)
Variable Mean Median SD Minimum Maximum
Disclosure 4.706 3.000 6.781 1.000 118.000 Bid-Ask Spread 5.955 3.104 8.411 0.048 75.879 Ln(Size) 17.933 17.648 2.103 10.998 25.428 Issue 0.152 0.038 0.409 ⫺2.000 2.000 Leverage 0.166 0.115 0.167 0.000 0.824 Performance ⫺0.011 0.036 0.190 ⫺1.955 0.663 Earn Chg 0.003 0.005 0.124 ⫺0.564 0.798
MBV 2.199 1.421 2.521 ⫺0.950 21.293
E_P ⫺0.008 0.040 0.192 ⫺1.355 0.313
Sales Growth 0.083 0.030 0.309 ⫺1.493 1.575 Asset Growth 0.089 0.058 0.308 ⫺0.963 1.328 Accrual Chg 0.002 ⫺0.002 0.165 ⫺0.733 1.015 RET_Volatility 0.013 0.011 0.011 0.000 0.176 Ln(Volume) 16.586 16.738 2.141 5.421 22.381 OwnConc 65.601 67.580 18.419 13.440 96.560
Beta 1.124 0.960 1.169 ⫺7.980 8.380
RET_Mkt 0.130 0.127 0.099 ⫺0.316 0.391
Notes: Disclosureis the number of annual price-sensitive disclosures announced by firmito the ASX under the Continuous Disclosure regulations for firmi Bid-Ask Spreadis the annual average bid-ask spread divided by the mid-point price computed by summing intraday quoted spreads;Ln(Size)is the natural logarithm of the market value of equity computed as ordinary shares on issue for firmiat financial year-endtmultiplied by stock price att;Issueis change in ordinary shares on issue divided by average ordinary shares for yearstandt⫺1;Leverageis total non-current liabilities for yeartscaled by the average total assets for yearstandt⫺1; performance is net profit after tax before abnormal items divided by average total assets for yearstandt⫺1;Earn_Chgis the change in net profit after tax before abnormal items scaled by average total assets for firmifor yearstandt⫺1;MBVis the market value of firmiattdivided by the book value of equity for yeart;E_Pis reported earnings per share before abnormal items scaled by share price att;Sales_Growthis the change in operating revenue scaled by the average total assets for firmifor yeart;Asset_Growthis the change in total assets scaled by the average total assets for firmifor yeart;Accrual_Chgis the change in income before tax, net interest, abnormal items minus cash flows from operations scaled by the average total assets for firm ifor yeart; RET_Volatilityis the annual average standard deviation of the stock return;Log(Volume)is the natural logarithm of annual stock volume trade for firmi;OwnConcis the shares held by the top twenty shareholders divided by the total issued ordinary shares for year x;Betais the monthly equity rate of return divided by the market return index measured as deviation from risk free rate for the previous 20 months;RET_Mktis the annualized value-weighted average price return on all stocks in the SIRCA share price and price relatives dataset. All outliers deleted at 1 and 99% level except for disclosure Ln(Size),Issue,Ln(Volume), Performance, Beta and RET mkt; sample of ASX firms based over the period 1996-2006 comprising approximately 5,249 firm-year observations
ARJ
28,2
206
Table III.
Descriptive statistics for the measures used to estimate model (2) bid-ask
Variable Mean Median SD Minimum Maximum
Disclosurei,d 0.049 0.000 0.248 0.000 13.000
Bid-Ask Spreadi,d 1.901 1.114 2.371 0.026 18.833
Ln(Volume)i,d 10.777 11.564 3.733 0.000 19.410
RET_Volatilityi,d 0.015 0.012 0.019 0.000 5.295
Notes: Disclosurei,dis price-sensitive disclosure measured as the daily number of price-sensitive firm
disclosures announced by ASX for firmifor dayd;Info_Asymmetryi,dis measured daily using three
different variables:Bid-AskSpread, trading volume and stock return volatility; daily bid ask spread (Bid-Ask Spread) as defined in Section 3.3 is measured as the ratio of the quoted bid-ask spread to the quoted midpoint price and then time-weighted, where the weighting procedure is based on the number of seconds the quotation exists in each interval, measured for firm ifor day d; trading volume (Ln(Volume)) equals the natural logarithm of the daily share volume for firmi, measured for dayd; stock price volatility (RET_Volatility) equals the standard deviation of the time-weighted trade to the trade price for firmiand daydwhere standard deviation⫽(1/(n⫺1)兺[Price – Mean Price]2)1/2 andn⫽the number of stock prices for firmi; samples are based on the largest 500 ASX-listed firms over the period 1996-2006, selected to exclude the firm-days with zero trading, zero price volatility, and abnormally large bid-ask spreads (where a bid or ask has no corresponding ask or bid respectively). The descriptive statistics of model (2) comprise approximately 859,432 firm-days; pooled data for the largest 500 ASX firms for 1996-2006,n⫽859,432
Table IV.
Correlations for the measures used to estimate model (1) Pearson
correlations Spearman
correlation A B C D E F G H I
A.Disclosure 1 ⫺0.239 0.237 0.395 0.343 0.076 0.045 0.153 0.038 B.Bid-Ask Spread ⫺0.493 1 ⫺0.286 ⫺0.513 ⫺0.589 ⫺0.111 ⫺0.169 ⫺0.144 ⫺0.014 C.RET_Volatility 0.452 ⫺0.310 1 0.675 0.058 0.076 ⫺0.291 ⫺0.023 ⫺0.071 D.Ln(Volume) 0.532 ⫺0.598 0.775 1 0.509 0.083 ⫺0.095 0.168 ⫺0.009 E.Ln(Size) 0.430 ⫺0.882 0.160 0.463 1 0.074 0.337 0.361 0.044 F.Issue 0.145 ⫺0.147 0.215 0.174 0.071 1 0.008 0.090 ⫺0.006 G.Performance 0.065 ⫺0.384 ⫺0.256 ⫺0.069 0.430 ⫺0.040 1 0.205 0.336 H.Leverage 0.182 ⫺0.342 ⫺0.046 0.152 0.402 0.029 0.244 1 0.025 I.Earn Chg 0.074 ⫺0.122 ⫺0.082 ⫺0.002 0.123 0.021 0.477 0.063 1
Notes: Disclosureis the number of annual price-sensitive disclosures announced by firmito the ASX under the Continuous Disclosure regulations for firmi Bid-Ask Spreadis the annual average bid-ask spread divided by the mid-point price computed by summing intraday quoted spreads;RET_Volatility is the annual average standard deviation of the stock return;Log(Volume)is the natural logarithm of annual stock volume trade for firmi;Ln(Size)is the natural logarithm of the market value of equity computed as ordinary shares on issue for firmiat financial year-endtmultiplied by stock price att;Issue is change in ordinary shares on issue divided by average ordinary shares for years tand t⫺1; performance is net profit after tax before abnormal items divided by average total assets for yearstand t⫺1;Leverageis total non-current liabilities for yeartscaled by the average total assets for yearstand t⫺1;Earn_Chgis the change in net profit after tax before abnormal items scaled by average total assets for firmifor yearstandt⫺1; sample of ASX firms based over the period 1996-2006 comprising approximately 5,249 firm year observations
207
Disclosure
and
information
asymmetry
Consistent with the determinants of disclosure literature, disclosure is positively correlated with firm size and leverage (Myers and Majluf, 1984;Lang and Lundholm, 1993).
Table Vreports correlations among the variables in the parsimonious Model (2). The information asymmetry measures for the bid-ask spread (bid-ask spread) for day d,d⫺1 andd⫹1 are all negatively correlated with price-sensitive disclosures for day d (Disclosure), while the trading volume (Ln(Volume)) and return volatility (RET_Volatility) measures are all positively correlated with price-sensitive disclosures for dayd.
Table VI reports correlations among the variables in the information asymmetry Model (3).
The bid-ask spread is negatively correlated with price-sensitive disclosure, trading volume, size, leverage and earnings price ratio, consistent with prior evidence of higher information asymmetry for firms with lower disclosure (Welker, 1995), lower trading volume (Leuz and Verrecchia, 2000), smaller size (Hasbrouck, 1991) and negative or ambiguous information about performance (Brownet al., 2009;Nget al., 2010). Trading volume (Ln(Volume)) is positively correlated with price-sensitive disclosure and size and leverage, consistent with lower information asymmetry for firms with more price-sensitive disclosure and greater firm size and leverage.
4. Results
4.1 Information asymmetry and price-sensitive disclosure 2SLS tests of Models (1) and (3)
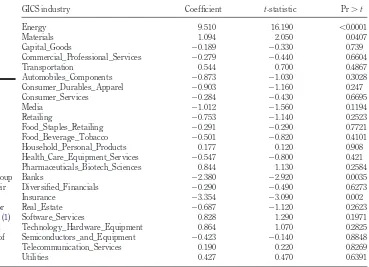
Table VIIpresents the 2SLS regression results of testing Models (1) and (3) (Table VIII). The disclosure Model (1) results give preliminary support for H1. Continuous disclosure is positively associated with bid-ask spread; hence, firms with higher information asymmetry are likely to increase disclosure (Lang and Lundholm, 1993). The additional first-stage results show continuous disclosure is associated with trading volume but not with stock return volatility. Return volatility has many influences, and firms with high price volatility may not possess enough information to continuously disclose, as indicated by the low median of the disclosure variable in the descriptive statistics. Untabulated OLS regression results of testing Model (1) are consistent with 2SLS results.
The second-stage 2SLS results of using information asymmetry Model (2) are mixed with bid-ask spread, return volatility and trading volume, all positively associated with continuous disclosure. While theLn(Volumed⫹1) regression result is predicted, the other
two results are unexpected. The overall effect of disclosure appears to be an increase in information asymmetry. The literature indicates that conditioning further disclosure tests on the firm’s level of information asymmetry or uncertainty may reconcile mixed results (Rogerset al., 2009;Brownet al., 2009).
Table VII also shows that information asymmetry is a function of the firm’s information environment. The results show significant coefficient estimates for firm size, leverage and growth expectations measured by the market value to book value of equity ratio, earnings to price ratio, sales and asset growth rates (Smith and Watts, 1992;
Lang and Lundholm, 1993;Penman, 1996;Affleck-Graveset al., 2002).
ARJ
28,2
208
Table
V.
Correlations
for
the
measures
used
to
estimate
model
(
2
)
bid-ask
Pearson correlations Spearman
correlation A B C D E F G H I J
A.Disclosurei,d 1 ⫺0.024 ⫺0.029 ⫺0.026 0.070 0.058 0.076 0.075 0.029 0.062
B.Bid-Ask Spreadi,d ⫺0.033 1 0.850 0.850 ⫺0.520 ⫺0.479 ⫺0.505 0.015 0.004 ⫺0.007
C.Bid-Ask Spreadi,d⫺1 ⫺0.039 0.912 1 0.784 ⫺0.506 ⫺0.520 ⫺0.486 ⫺0.010 0.015 ⫺0.013
D.Bid-Ask Spreadi,d⫹1 ⫺0.040 0.912 0.885 1 ⫺0.478 ⫺0.474 ⫺0.517 0.004 ⫺0.007 0.019
E.Ln(Volume)i,d 0.096 ⫺0.560 ⫺0.552 ⫺0.544 1 0.704 0.702 0.362 0.280 0.280
F.Ln(Volume)i,d⫺1 0.074 ⫺0.545 ⫺0.560 ⫺0.543 0.845 1 0.684 0.283 0.361 0.269
G.Ln(Volume)i,d⫹1 0.099 ⫺0.551 ⫺0.546 ⫺0.559 0.844 0.826 1 0.280 0.271 0.361
H.RET_Volatilityi,d 0.079 ⫺0.046 ⫺0.078 ⫺0.068 0.562 0.484 0.477 1 0.427 0.425
I.RET_Volatilityi,d⫺1 0.044 ⫺0.068 ⫺0.046 ⫺0.080 0.478 0.562 0.467 0.578 1 0.391
J.RET_Volatilityi,d⫹1 0.075 ⫺0.077 ⫺0.084 ⫺0.045 0.483 0.470 0.562 0.577 0.551 1
Notes: As indicated by the subscripts, information asymmetry measures in model (2) are computed on a daily basis and include measures for dayd⫹1, dayd⫺1, and dayd;Disclosurei,dis price-sensitive disclosure measured as the daily number of price-sensitive firm disclosures announced by ASX for firm
ifor dayd;Info_Asymmetryi,dis measured daily using three different variables: Bid-Ask Spread, trading volume and stock return volatility; daily bid ask
spread(Bid-Ask Spread)as defined in Section 3.3 is measured as the ratio of the quoted bid-ask spread to the quoted midpoint price and then time-weighted,
where the weighting procedure is based on the number of seconds the quotation exists in each interval, measured for firmifor dayd; trading volume
(Ln(Volume)) equals the natural logarithm of the daily share volume for firmi, measured for dayd; and stock price volatility (RET_Volatility) equals the
standard deviation of the time-weighted trade to the trade price for firmiand daydwhere standard deviation⫽(1/(n⫺1)兺[Price⫺Mean Price]2)1/2 and
n⫽the number of stock prices for firmi; samples are based on the largest 500 ASX-listed firms over the period 1996-2006, selected to exclude the firm-days with zero trading, zero price volatility, and abnormally large bid-ask spread (where a bid or ask has no corresponding ask or bid, respectively). The
correlations inTable Vcomprise approximately 859,432 firm-days
209
Disclosure
and
information
asymmetry
Table
VI.
Correlations
for
the
measures
used
to
estimate
models
(
3
)-(
4
)
Pearson correlations Spearman
correlation A B C D E F G H I J. K. L. M. N. O.
A.Bid-Ask Spread 1 ⫺0.286 ⫺0.513 ⫺0.239 ⫺0.589 ⫺0.144 ⫺0.163 ⫺0.220 ⫺0.103 ⫺0.144 ⫺0.014 0.002 0.307 ⫺0.160 ⫺0.086 B.RET_Volatility ⫺0.310 1 0.675 0.237 0.058 ⫺0.023 0.133 ⫺0.226 ⫺0.024 ⫺0.010 ⫺0.071 ⫺0.009 ⫺0.369 0.415 ⫺0.017 C.Ln(Volume) ⫺0.598 0.775 1 0.395 0.509 0.168 0.144 ⫺0.056 0.022 0.033 ⫺0.009 ⫺0.011 ⫺0.379 0.344 0.039 D.Disclosure ⫺0.493 0.452 0.532 1 0.343 0.153 0.057 0.044 0.026 0.057 0.038 0.003 ⫺0.170 0.114 0.004 E.Ln(Size) ⫺0.882 0.160 0.463 0.430 1 0.361 0.216 0.304 0.106 0.142 0.044 0.008 ⫺0.062 0.071 0.040 F.Leverage ⫺0.342 ⫺0.046 0.152 0.182 0.402 1 ⫺0.023 0.157 0.057 0.167 0.025 0.038 0.104 ⫺0.077 ⫺0.043
G.MBV ⫺0.380 0.168 0.224 0.215 0.389 ⫺0.018 1 0.022 0.084 0.045 0.075 0.020 ⫺0.060 0.119 0.107
H.E_P ⫺0.296 ⫺0.271 ⫺0.105 0.012 0.325 0.302 ⫺0.051 1 0.109 0.256 0.268 0.120 0.084 ⫺0.141 0.019
I.Sales Growth ⫺0.184 ⫺0.014 0.025 0.073 0.185 0.163 0.164 0.233 1 0.268 0.175 0.058 0.026 ⫺0.012 0.023 J.Asset Growth ⫺0.200 ⫺0.024 0.015 0.078 0.197 0.144 0.128 0.250 0.315 1 0.131 0.132 ⫺0.007 0.006 0.051 K.Earns Chg ⫺0.122 ⫺0.082 ⫺0.002 0.074 0.123 0.063 0.151 0.355 0.306 0.205 1 0.336 0.032 ⫺0.015 0.014 L.Accrual Chg ⫺0.033 ⫺0.041 ⫺0.024 0.025 0.042 0.058 0.032 0.138 0.083 0.151 0.291 1 0.000 ⫺0.017 0.023 M.OwnConc 0.295 ⫺0.412 ⫺0.385 ⫺0.240 ⫺0.057 0.125 ⫺0.134 0.128 0.033 0.000 0.046 0.016 1 ⫺0.142 ⫺0.031
N.Beta ⫺0.155 0.475 0.392 0.256 0.116 ⫺0.075 0.133 ⫺0.182 ⫺0.004 0.000 ⫺0.003 ⫺0.020 ⫺0.148 1 ⫺0.013
O.RET_Mkt ⫺0.104 ⫺0.022 0.019 0.030 0.040 ⫺0.057 0.172 ⫺0.042 0.034 0.062 0.042 0.036 ⫺0.033 0.007 1
Notes: Bid-Ask Spreadis the annual average bid-ask spread divided by the mid-point price computed by summing intraday quoted spreads;RET_Volatilityis the annual average standard deviation of the stock return;Log(Volume)is the natural logarithm of annual stock volume trade for firmi;Disclosureis the number of annual price-sensitive disclosures announced by firmito the ASX under the Continuous Disclosure regulations for firmI; Ln(Size)is the natural logarithm of the market value of equity computed as ordinary shares on issue for firmiat financial year-endt
multiplied by stock price att;Leverageis total non-current liabilities for yeartscaled by the average total assets for yearstandt⫺1; performance is net profit after tax before abnormal items divided by average total assets for yearstandt⫺1;MBVis the market value of firmiattdivided by the book value of equity for yeart;E_Pis reported earnings per share before abnormal items scaled by share price att;Sales_Growthis the change in operating revenue scaled by the average total assets for firmifor yeart;Asset_Growthis the change in total assets scaled by the average total assets for firmifor yeart;Earn_Chgis the change in net profit after tax before abnormal items scaled by average total assets for firmifor yearstandt⫺1;Accrual_Chgis the change in income before tax, net interest, abnormal items minus cash flows from operations scaled by the average total assets for firmifor yeart;OwnConcis the shares held by the top twenty shareholders divided by the total issued ordinary shares for year x;Betais the monthly equity rate of return divided by the market return index measured as deviation from risk free rate for the previous 20 months;RET_Mktis the annualized value-weighted average price return on all stocks in the SIRCA share price and price relatives dataset; Sample of ASX firms based over the period 1996-2006 comprising approximately 5,249 firm-year observations
ARJ
28,2
210
Table
VII.
Two-stage
least
squares
estimates
of
disclosure
and
information
asymmetry
disclosure
model
2SLS Estimates
Info asymmetry Expected sign
Bid-Ask Spread Expected sign
Bid-Ask Spread
Expected sign
RET_Volatility Expected
sign RET_Volatility
Expected sign
Ln(Volume) Expected
sign Ln(Volume)
Dependent variable Disclosure Disclosure Disclosure
Intercept ⫺22.675 46.741 ⫺21.485 ⫺0.011 ⫺20.783 8.688
⫺15.760*** 36.850*** ⫺15.100*** ⫺7.080*** ⫺15.920*** 37.490***
Disclosure ⫺ 0.302 ⫺ 0.000 ⫹ 0.126
8.790*** 5.800*** 17.490***
Info asymmetry ⫺ 0.047 ⫺ 8.022 ⫹ 0.515
3.120*** 0.540 6.830***
Issue ⫹ 0.809 ⫹ 0.739 ⫹ 0.759
3.240*** 2.710*** 3.050***
Performance ⫹ 0.669 ⫹ ⫺0.412 ⫹ 0.565
0.880 ⫺0.450 0.750
Analyst ⫹ ⫺0.056 ⫹ ⫺0.150 ⫹ ⫺0.067
⫺0.250 ⫺0.620 ⫺0.300
Ln(Size) ⫹ 1.007 ⫺ ⫺2.045 ⫹ 0.834 ⫺ ⫺0.002 ⫹ 0.921 ⫹ 0.373
13.510*** ⫺30.390*** 10.640*** ⫺26.230*** 13.290*** 28.270***
Leverage ⫹ ⫹ 1.776 ⫹ 2.294 ⫹ 0.000 ⫹ 1.972 0.176
2.970*** 2.950*** 3.360*** ⫺0.320 3.250*** 1.340
MBV ⫹ ⫺0.102 ⫹ 0.005 ⫹ ⫺0.070 ⫹ 0.000 ⫹ ⫺0.102 ⫺ ⫺0.033
⫺2.490** 0.130 ⫺1.510 5.930*** ⫺2.490** ⫺3.710***
(continued)
211
Disclosure
and
information
asymmetry
Table
VII.
2SLS Estimates
Info asymmetry Expected
sign Bid-Ask Spread
Expected sign
Expected
sign RET_Volatility
Expected sign
Expected
sign Ln(Volume)
Expected sign
Dependent variable Disclosure Disclosure Disclosure
E_P ⫺ ⫺0.161 ⫺ ⫺6.084 ⫺ 0.143 ⫺ ⫺0.005 ⫺ ⫺0.384 ⫹ ⫺0.645
⫺0.250 ⫺10.510*** 0.200 ⫺6.420*** ⫺0.610 ⫺5.110***
Sales Growth ⫹ 0.005 ⫹ ⫺0.844 ⫹ 0.054 ⫹ 0.000 ⫹ ⫺0.008 ⫺ 0.018
0.020 ⫺2.700*** 0.160 0.880 ⫺0.030 0.270
Asset Growth ⫹ ⫺0.124 ⫹ ⫺1.085 ⫹ ⫺0.715 ⫹ 0.001 ⫹ ⫺0.173 ⫺ ⫺0.135
⫺0.390 ⫺3.300*** ⫺1.890 2.530** ⫺0.540 ⫺1.880
Earns Chg ⫹ 2.131 ⫹ 1.007 ⫹ 1.572 ⫹ ⫺0.005 ⫹ 2.246** ⫺ 0.346
2.440** 1.140 1.470 ⫺3.910*** 2.570 1.790
Accrual Chg ⫹ ⫺0.089 ⫹ 0.684 ⫹ 0.151 ⫹ 0.001 ⫹ ⫺0.072 ⫺ ⫺0.140
⫺0.150 1.120 0.230 0.990 ⫺0.120 ⫺1.050
RET_Volatility ⫺ 17.222 ⫹ ⫺123.351 ⫺ ⫹ ⫺ 12.688 ⫺ 102.789
1.330 ⫺9.250*** 0.990 44.990***
Ln(Volume) ⫹ 0.538 ⫺ ⫺0.602 ⫹ 0.656 ⫺ 0.004 ⫹
7.120*** ⫺7.470*** 7.540*** 43.390***
OwnConc ⫺ ⫺0.016 ⫹ 0.088 ⫺ ⫺0.006 ⫹ 0.000 ⫺ ⫺0.011 ⫺ ⫺0.011
⫺2.760*** 16.170*** ⫺0.950 ⫺6.600*** ⫺2.050** ⫺9.140***
Beta ⫹ ⫺0.060 ⫹ 0.002
⫺0.510 12.920***
RET_Mkt ⫺ ⫺1.812 ⫺ ⫺0.005
⫺1.850 ⫺4.000***
兺Industry
AdjustedR2 0.324 0.456 0.339 0.598 0.323 0.658
(continued)
ARJ
28,2
212
Table
VII.
2SLS Estimates
Info asymmetry Bid-Ask Spread RET_Volatility Ln(Volume)
Dependent variable Disclosure Bid-Ask Spread Disclosure RET_Volatility Disclosure Ln(Volume)
F-statistic 57.46 321.33 48.68 427.77 58.6 803.27
Observations 4,594 4,594 3,726 3,726 4,594 4,594
Notes: Disclosureis the number of annual price-sensitive disclosures announced by firmito the ASX under the Continuous Disclosure regulations for firmi Bid-Ask Spreadis the annual average bid-ask spread divided by the mid-point price computed by summing intraday quoted spreads;RET_Volatilityis the annual average standard deviation of the stock return;Ln(Volume)is the natural logarithm of annual stock volume trade for firmi;Issueis change in ordinary shares on issue divided by average ordinary shares for yearstandt⫺1;Performanceis net profit after tax before abnormal items divided by average total assets for yearstandt⫺1;Analystis an indicator variable taking the value of 1 if sell-side analysts provide a public stock recommendation (buy, hold or sell) for the stock at financial year-end t, and taking the value of 0 otherwise;Ln(Size)is the natural logarithm of the market value of equity computed as ordinary shares on issue for firmiat financial year-endtmultiplied by stock price att;Leverageis total non-current liabilities for yeartscaled by the average total assets for yearstandt⫺1;MBVis the market value of firmiattdivided by the book value of equity for yeart;E_Pis reported earnings per share before abnormal items scaled by share price att;Sales_Growthis the change in operating revenue scaled by the average total assets for firmifor yeart;Asset_Growthis the change in total assets scaled by the average total assets for firmifor yeart;Earn_Chgis the change in net profit after tax before abnormal items scaled by average total assets for firmifor yearstandt⫺1;Accrual_Chgis the change in income before tax, net interest, abnormal items minus cash flows from operations scaled by the average total assets for firmifor yeart;OwnConcis the shares held by the top twenty shareholders divided by the total issued ordinary shares for year x;Betais the monthly equity rate of return divided by the market return index measured as deviation from risk free rate for the previous 20 months;RET_Mktis the annualized value-weighted average price return on all stocks in the SIRCA share price and price relatives dataset. Coefficient␣reported abovet-statistic; *** significant at 1% level; ** significant at 5% level. Industry dummy variables and their 2SLS estimates are not reported; annual pooled sample of ASX-listed firms for the period 1996-2006
Disclosurei,t⫽␣0⫹␣1Info_Asymmetryi,t⫹␣2Ln(Size)i,t⫹␣3Issuei,t⫹␣4Performancei,t⫹␣5Leveragei,t⫹␣6Analysti,t
⫹␣7Earn_Chgi,t⫹␣8MBVi,t⫹␣9E_Pi,t⫹␣10SalesGrowthi,t⫹␣11AssetGrowthi,t⫹␣12Accrual_Chgi,t
⫹␣13OwnerConci,t⫹␣14Ln(Volume)i,t⫹␣15RET_Volatilityi,t⫹
兺
␣jIndustryi,t⫹ i(1)
Information asymmetry model:
Info_Asymmetryi,t⫹1⫽␣0⫹␣1Disclosurei,t⫹␣2Ln(Size)i,t⫹␣3Leveragei,t⫹␣4MBVi,t⫹␣5E_Pi,t⫹␣6SalesGrowthi,t ⫹␣7AssetGrowthi,t⫹␣8Earn_Chgi,t⫹␣9Accrual_Chgi,t⫹␣10RET_Volatilityi,t⫹␣11Ln(Volume)i,t
⫹␣12OwnerConci,t⫹␣13Betai,t⫹␣14RET_Mkti,t⫹ i
(3)
213
Disclosure
and
information
asymmetry
4.2 Information asymmetry and continuous disclosure tests from parsimonious Model (2)
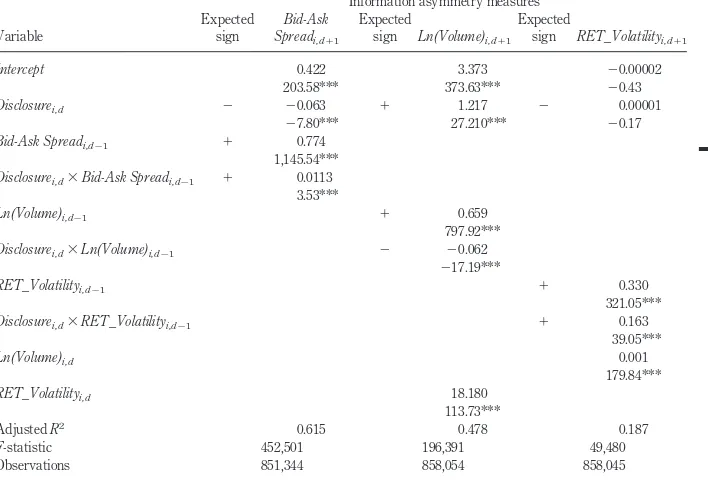
Table IX presents results from parsimonious Model (2) which regress information asymmetry measures on disclosure, and on interactions between disclosure and day d⫺1 information asymmetry.
In columns one and two of Table IX, bid-ask spread and trading volume are negatively and positively associated with disclosure, respectively, consistent withH2. In column three, stock price volatility is not associated with disclosure.Table IXfurther reports the interaction coefficients in Model (2). The study finds positive and significant coefficient estimates for Disclosured ⫻ Bid-AskSpreadd⫺1 and Disclosured ⫻ RET_Volatilityd⫺1, and a negative and significant coefficient estimate forDisclosured⫻ Ln(Volume)d⫺1. The interaction effect is adverse to the disclosure effect, and is
consistent with firms of high pre-existing information asymmetry, exhibiting higher information asymmetry after disclosure. This result is in line with increased information asymmetry in the presence of pre-existing uncertainty surrounding firm performance (Brownet al., 2009;Rogerset al., 2009).
4.3 Information asymmetry and continuous disclosure tests of Model (4)
Table Xpresents the results from Model (4), which includes interactions between disclosure and measures of the performance expectations: MBV ratio, earnings to price ratio and changes in earnings and accruals (Disclosure ⫻ performance expectations).
Table VIII.
GICS industry group variables and their 2SLS estimates reported below for Disclosure model (1) with the Bid-Ask Spread measure of information asymmetry
GICS industry Coefficient t-statistic Pr⬎t
Energy 9.510 16.190 ⬍0.0001
Materials 1.094 2.050 0.0407
Capital_Goods ⫺0.189 ⫺0.330 0.739
Commercial_Professional_Services ⫺0.279 ⫺0.440 0.6604
Transportation 0.544 0.700 0.4867
Automobiles_Components ⫺0.873 ⫺1.030 0.3028
Consumer_Durables_Apparel ⫺0.903 ⫺1.160 0.247
Consumer_Services ⫺0.284 ⫺0.430 0.6695
Media ⫺1.012 ⫺1.560 0.1194
Retailing ⫺0.753 ⫺1.140 0.2523
Food_Staples_Retailing ⫺0.291 ⫺0.290 0.7721
Food_Beverage_Tobacco ⫺0.501 ⫺0.820 0.4101
Household_Personal_Products 0.177 0.120 0.908
Health_Care_Equipment_Services ⫺0.547 ⫺0.800 0.421
Pharmaceuticals_Biotech_Sciences 0.844 1.130 0.2584
Banks ⫺2.380 ⫺2.920 0.0035
Diversified_Financials ⫺0.290 ⫺0.490 0.6273
Insurance ⫺3.354 ⫺3.090 0.002
Real_Estate ⫺0.687 ⫺1.120 0.2623
Software_Services 0.828 1.290 0.1971
Technology_Hardware_Equipment 0.864 1.070 0.2825
Semiconductors_and_Equipment ⫺0.423 ⫺0.140 0.8848
Telecommunication_Services 0.190 0.220 0.8269
Utilities 0.427 0.470 0.6391
ARJ
28,2
214
Table Xresults show an increase in bid-ask spread when disclosure interacts with MBV and E-P. This evidence is consistent with Table IX results that firms with more uncertain investments and growth have information asymmetry increased by price-sensitive disclosure. The results inTable IXalso show that while bid-ask spread is positively associated with earnings change as expected, the change in asymmetry is reduced by disclosure which is consistent withH2.
TheTable Xresults further confirm that disclosure increases return volatility, consistent with 2SLS regression results, but that disclosure also interacts with MBV and E-P to reduce volatility. Overall, the results confirm that the effect of disclosure on information asymmetry is conditional on the firm’s pre-existing asymmetry and performance expectations.
Table IX.
Information asymmetry and price-sensitive disclosure tests from parsimonious model (2) bid-ask Variable
Information asymmetry measures Expected
sign
Bid-Ask Spreadi,d⫹1
Expected
sign Ln(Volume)i,d⫹1
Expected
sign RET_Volatilityi,d⫹1
Intercept 0.422 3.373 ⫺0.00002
203.58*** 373.63*** ⫺0.43
Disclosurei,d ⫺ ⫺0.063 ⫹ 1.217 ⫺ 0.00001
⫺7.80*** 27.210*** ⫺0.17
Bid-Ask Spreadi,d⫺1 ⫹ 0.774
1,145.54*** Disclosurei,d⫻Bid-Ask Spreadi,d⫺1 ⫹ 0.0113
3.53***
Ln(Volume)i,d⫺1 ⫹ 0.659
797.92***
Disclosurei,d⫻Ln(Volume)i,d⫺1 ⫺ ⫺0.062
⫺17.19***
RET_Volatilityi,d⫺1 ⫹ 0.330
321.05***
Disclosurei,d⫻RET_Volatilityi,d⫺1 ⫹ 0.163
39.05***
Ln(Volume)i,d 0.001
179.84***
RET_Volatilityi,d 18.180
113.73***
AdjustedR2 0.615 0.478 0.187
F-statistic 452,501 196,391 49,480 Observations 851,344 858,054 858,045
Notes: Disclosurei,dis price-sensitive disclosure measured as the daily number of price-sensitive firm disclosures announced
by ASX for firmifor dayd; daily bid ask spread (Bid-Ask Spread) as defined in Section 3.3 is measured as the ratio of the quoted bid-ask spread to the quoted midpoint price and then time-weighted, where the weighting procedure is based on the number of seconds the quotation exists in each interval, measured for firmifor dayd; trading volume (Ln(Volume)) equals the natural logarithm of the daily share volume for firmi, measured for dayd; and stock price volatility (RET_Volatility) equals the standard deviation of the time-weighted trade to the trade price for firmiand daydwhere standard deviation⫽ (1/(n⫺1)兺[Price⫺Mean Price]2)1/2 andn⫽the number of stock prices for firmi.Coefficient␣reported above t-statistic. *** significant at 1% level; samples for tests of model (2) comprise the largest 500 ASX-listed firms over the period 1996-2006, selected to exclude the firm-days with zero trading, zero price volatility and abnormally large bid-ask spreads (where a bid or ask has no corresponding ask or bid, respectively)
Info_Asymmetryi,d⫹1⫽␣0⫹␣1Disclosurei,d⫹␣2Info_Asymmetryi,d⫺1⫹␣3Disclosurei,d
⫻Info_Asymmetryi,d⫺1⫹␣kControlsi,d⫹ i
(1)
215
Disclosure
and
information
asymmetry
To examine the association between information asymmetry and price-sensitive disclosure at different levels of pre-existing information asymmetry,Table XIpresents the results of testing Model (2) with the data sample partitioned into deciles ranked on dayd⫺1 stock return volatility.
Table X.
Information asymmetry and price-sensitive disclosure tests from model (4)
Variable
Information asymmetry measures Expected
sign
Bid-Ask Spread
Expected
sign RET_Volatility
Expected
sign Ln(Volume)
Intercept ? 45.300 ? ⫺0.016 ? 9.848
42.500*** ⫺11.980*** 41.840***
Disclosure ⫺ ⫺0.017 ⫺ 0.000 ⫹ 0.077
⫺0.820 4.890*** 14.420***
Ln(Size) ⫺ ⫺1.954 ⫺ ⫺0.002 ⫹ 0.479
⫺33.010*** ⫺27.220*** 37.620***
Leverage ⫺ 2.642 ⫺ 0.000 ⫹ 0.405
4.780*** 0.390 2.800***
MBV ⫹ ⫺0.113 ⫹ 0.000 ⫺ 0.045
⫺2.530** 7.940*** 3.870***
E_P ⫺ ⫺8.440 ⫺ ⫺0.002 ⫹ ⫺1.856
⫺13.420*** ⫺2.700*** ⫺11.410***
Sales Growth ⫹ ⫺1.138 ⫹ 0.001 ⫺ ⫺0.071
⫺3.970*** 1.320 ⫺0.950
Asset Growth ⫹ ⫺1.048 ⫹ 0.001 ⫺ ⫺0.041
⫺3.540*** 2.620*** ⫺0.530
Earns Chg ⫹ 3.283 ⫹ ⫺0.005 ⫺ 0.671
3.370*** ⫺3.450*** 2.640***
Accrual Chg ⫹ 0.679 ⫹ 0.001 ⫺ ⫺0.081
0.960 1.200 ⫺0.440
RET_Volatility ⫹ ⫺94.642 ⫺
⫺7.960***
Ln(Volume) _ ⫺0.535 _ 0.004
⫺7.420*** 52.420***
OwnConc ⫹ 0.085 ⫹ 0.000 ⫺ ⫺0.035
16.730*** ⫺6.900*** ⫺28.480***
Beta 0.002
12.440***
RET_Mkt ⫺0.005
⫺4.330***
Disclosure⫻MBV 0.022 0.000 ⫺0.007
3.400*** ⫺3.030*** ⫺4.060***
Disclosure⫻E_P 0.847 ⫺0.001 ⫺0.085
7.270*** ⫺5.220*** ⫺2.800***
Disclosure⫻EarnChg ⫺0.298 0.000 ⫺0.050
⫺2.080** 0.850 ⫺1.330
Disclosure⫻Accrual_Chg 0.042 0.000 0.014
0.360 ⫺0.020 0.450
AdjustedR2 0.478 0.607 0.447
(continued)
ARJ
28,2
216
In column 1 of Table XI, for the lowest two deciles of price volatility aggregated, price-sensitive disclosure is positively and significantly associated with bid-ask spread at day d ⫹ 1. For columns “2” to “9” inclusive of increasing levels of volatility, price-sensitive disclosure is negatively associated with bid-ask spread.
Turning to the interaction results (Disclosured⫻Bid-Ask Spreadd⫺1), in deciles 1 and 2, there is a negative relation between bid-ask spread and price-sensitive disclosure. Hence, at lower levels of pre-existing stock return volatility, the firms providing more (less) daily price-sensitive disclosure have relatively lower (higher) information asymmetry on day d ⫹ 1. Higher up the volatility deciles, the conditional relation (Disclosured⫻Bid-Ask Spreadd⫺1) becomes positive consistent with the earlier results.
That is, level of uncertainty about future performance is a likely factor in the effect of disclosure on information asymmetry.
Table X.
Variable
Information asymmetry measures
Bid-Ask Spread RET_Volatility Ln(Volume)
F-statistic 301.44 363.04 304.41
Observations 5,249 3,980 5,249
Notes: Bid-Ask Spread is the annual average bid-ask spread divided by the mid-point price computed by summing intraday quoted spreads;RET_Volatilityis the annual average standard deviation of the stock return;Ln(Volume)is the natural logarithm of annual stock volume trade for firmi;Disclosureis the number of annual price-sensitive disclosures announced by firmito the ASX under the Continuous Disclosure regulations for firmi;Ln(Size)is the natural logarithm of the market value of equity computed as ordinary shares on issue for firm iat financial year-endt multiplied by stock price at t;Leverageis total non-current liabilities for yeartscaled by the average total assets for yearstandt⫺1;MBVis the market value of firmiattdivided by the book value of equity for yeart;E_Pis reported earnings per share before abnormal items scaled by share price att;Sales_Growthis the change in operating revenue scaled by the average total assets for firmifor yeart;Asset_Growthis the change in total assets scaled by the average total assets for firmifor yeart;Earn_Chgis the change in net profit after tax before abnormal items scaled by average total assets for firmifor yearstandt⫺1;Accrual_Chgis the change in income before tax, net interest, abnormal items minus cash flows from operations scaled by the average total assets for firmifor yeart;OwnConcis the shares held by the top twenty shareholders divided by the total issued ordinary shares for year x;Betais the monthly equity rate of return divided by the market return index measured as deviation from risk free rate for the previous 20 months;RET_Mktis the annualized value-weighted average price return on all stocks in the SIRCA share price and price relatives dataset. Coefficient␣reported abovet-statistic. *** significant at 1% level; ** significant
at 5% level; annual pooled sample of ASX listed firms for the period 1996-2006
Info_Asymmetryi,t⫹1⫽␣0⫹␣1Disclosurei,t⫹␣2Ln(Size)i,t⫹␣3Leveragei,t⫹␣4MBVi,t
⫹␣5E_Pi,t⫹␣6Sales_Growthi,t⫹␣7Asset_Growthi,t⫹␣8Earn_Chgi,t
⫹␣9Accrual_Chgi,t⫹␣10RET_Volatilityi,t⫹␣11Ln(Volume)i,t
⫹␣12OwnerConci,t⫹␣13Betai,t⫹␣14RET_Mkti,t
⫹␣gDisclosurei