TECHNICAL, COST AND ALLOCATIVE
EFFICIENCY OF RICE, CORN AND SOYBEAN
FARMING IN INDONESIA: DATA ENVELOPMENT
ANALYSIS APPROACH
Rosihan Asmara
1,*, Fahriyah
1, Nuhfil Hanani
11
Faculty of Agriculture, University of Brawijaya, Malang, East Java, Indonesia
*corresponding author: [email protected]
ABSTRACT: This study aimed to analyze technical, cost and allocative efficiency, and to analyze the influence factors on the rice, corn and soybean farming in Indonesia. It used Data Envelopment Analysis (DEA) aiming to minimize the cost of inputs. The results show that the propotion of efficient allocative efficiency levels are about 10.20% for rice farmers, 12.28% for corn farmers and 4.55% for soybean farmers. Additionally, the proportion of farmers having technically efficient are 26.53% for rice farmers, 26.32% for corn farmers, and 36.36% for soybean farmers. The lower allocative efficiency shows that farmers face much difficulty in considering input prices and input allocations in their productions. Moreover, the most dominant factors affecting the technical (TE) and cost (CE) efficiency in rice, corn and soybean farming are land area and extension frequency. Those are definitely important factors in improving farming efficiency. Spesifically for extension program, this study confirms empirically that extension is still one of imperative factors should be considered in agriculture development in Indonesia.
Key words: technical efficiency, Paddy, Maize, Soybean, Data Envelopment Analysis
INTRODUCTION
Rice, corn and soybean are strategic food commodities in Indonesia and farmers mostly cultivate them as the main source of income and the livelihood in rural areas. Considered from the food consumers, rice and corn are especially the major sources of carbohydrates, while soy is the protein source.
Given the importance of these food commodities for consumers and producers, they are determined as the political commodities. Food scarcity will cause food prices to be expensive and affect inflation, which become a political issue then. Therefore, the government attempts constantly to meet the society food demand. If the food availability were unable to be fulfilled by domestic production, then government conducts imports to fill the gap in the market.
Food demands continue to increase in line with the population growth. While production does not meet the food demand, the production
Security Information System (2016) showed that in 2013 the value of rice imports was USD 244.623 millions, corn was USD 935.78 millions and soybean reached USD 1116.09 millions. Therefore, Indonesian government launched the food self-sufficiency policy for addressing the issue. This effort goes in line with population, which continue to increase, whereas the world food supply is getting relatively stagnant.
Technical, Cost, and Allocative Efficiency
Agricultural Socio-Economics Journal Volume 17, Number 02 (2017): 76-80 77
and Brazil are USD 363.271 and USD 508 per ton, respectively. This situation shows that food production by farmers is still less efficient.
Based on these facts, efforts to increase farmer’s production must be accompanied by the increase of farming efficiency, one of which is to conduct technical and allocative efficiency by optimally using farm inputs. Therefore, it is important to do a study on technical and allocative efficiency of food farming in Indonesia, as well as the necessity to identify factors affecting technical efficiency in rice farming. This study used Data Envelopment Analysis (DEA) with the main objective of minimizing the production cost, so that the technical, cost and allocative efficiency would be obtained. The result of study is intended to provide appropriate information to increase productivity and to support rice self-sufficiency program.
RESEARCH METHODS
Sample of this study was collected using multistage sampling. Three regencies in East Java were selected. They are Jember, Tuban, and Banyuwangi regencies. Each of them is the center of rice, corn Tuban with 57 corn farmers, and Banyuwangi with 44 soybean farmers. farmers, then we used the liner program as follows:
Minimize θλθ ……….. (1) (TE), yi is the production number of i-th farmers, xi is vector Nx1 from the number of inputs for i-th model of linear programming was formulated in the form of minimizing production costs.
Where wi is the vector of input prices from farmers
and xi * (calculated by linear programming) is the vector which was minimized from the cost of input total of i-th farmers. The economic or cost efficiency (CE) for i-th farmers was obtained by dividing the farmers’ optimal cost as defined in equation (3). Meanwhile, the allocative efficiency (AE) was calculated by dividing the economic efficiency or cost (CE) with the technical efficiency (TE) as follows:
CE = wi'x * / wi 'xi ……….….. AE = CE / TE ………...
In order to examine the factors affecting the efficiency, we used the following equation:
∑ ……….
TE is the level of technical efficiency, while Zij are factors affecting the technical efficiency which consists of 10 variables, namely: age, sex farmers, education, number of family member, land area, land ownership, variety, origin of seeds, extension frequency, demonstration plot farming.
As the obtained variable of efficiency was not normally distributed due to its value between 0 and 1, the OLS would potentially produce inconsistent estimation. Therefore, this study used the Tobit regression model which was estimated by Maximum Likelihood Estimator (MLE).
RESULTS AND DISCUSSION
Table 1. Average of technical efficiency (TE), efficiency cost (CEK), and allocative efficiency (AE) of rice, corn and soybean farming
Comodity TE AE CE
Mean Std Mean Std Mean Std Rice 0.68 0.23 0.61 0.21 0.42 0.23 Corn 0.73 0.18 0.75 0.11 0.55 0.18 Soybean 0.81 0.17 0.59 0.17 0.48 0.19
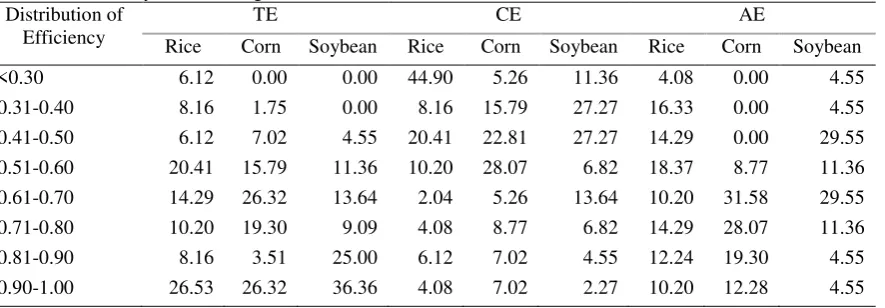
Based on Table 2, the percentage of farmers in the range of 0.90-1.0 of TE are only about 26% of corn and rice farmers and 36% of soybean farmers in that range. Similarly, CE for the commodities were 4% of rice farmers was efficient on the range mentioned above, technically efficient of corn farmers are 7% and that of soybean farmers are 2%.
The farmers’ allocative efficiency have the lower level. For the range efficiency of 0.90-1.00, rice farmers in that range for rice, corn, and soybean are about 10.20%, 12.28% and 4.55%, respectively. This situation described that the efficiency of food farming in Indonesia still need much improvement.
Table 2. Distribution of Technical Efficiency (TE), Efficiency Cost (CEK) and Allocative Efficiency (AE) in Rice, Corn and Soybean Farming
Distribution of Efficiency
TE CE AE
Rice Corn Soybean Rice Corn Soybean Rice Corn Soybean <0.30 6.12 0.00 0.00 44.90 5.26 11.36 4.08 0.00 4.55 0.31-0.40 8.16 1.75 0.00 8.16 15.79 27.27 16.33 0.00 4.55 0.41-0.50 6.12 7.02 4.55 20.41 22.81 27.27 14.29 0.00 29.55 0.51-0.60 20.41 15.79 11.36 10.20 28.07 6.82 18.37 8.77 11.36 0.61-0.70 14.29 26.32 13.64 2.04 5.26 13.64 10.20 31.58 29.55 0.71-0.80 10.20 19.30 9.09 4.08 8.77 6.82 14.29 28.07 11.36 0.81-0.90 8.16 3.51 25.00 6.12 7.02 4.55 12.24 19.30 4.55 0.90-1.00 26.53 26.32 36.36 4.08 7.02 2.27 10.20 12.28 4.55
The factors affecting efficiency in this study were focused on TE and CE, while the affecting factors in AE was not required since they were the division between CE and TE. Factors on education and land area influenced TE of rice farming, while in corn farming the influencing factors were the
number of household members, land area, land ownership status, extension frequency, and the presence of demonstration plot. In soybean farming, the influencing factors were the status of land ownership and extension frequency (Table 3).
Table 3. Factors Affecting Technical Efficiency (TE) in Rice, Corn and Soybean Farming
Variable Rice Corn Soybean
Technical, Cost, and Allocative Efficiency
Agricultural Socio-Economics Journal Volume 17, Number 02 (2017): 76-80 79
Table 3. Factors Affecting Technical Efficiency (TE) in Rice, Corn and Soybean Farming (Continued)
Variable Rice Corn Soybean
Coef. Std. Err. t Coef. Std. Err. t Coef. Std. Err. t Varieties 0.069 0.070 0.990 -0.040 0.025 -1.590 0.000 0.033 0.000 Seed origin 0.055 0.085 0.640 0.035 0.049 0.720 0.036 0.036 0.990 Extension
frequency
0.002 0.019 0.090 0.045** 0.007 6.660 0.018 0.007* 2.580
Demplot 0.024 0.058 0.410 0.092* 0.035 2.620 0.077 0.053 1.460 Intercept 0.593 0.252 2.350 0.556 0.071 7.780 0.747 0.173 4.310 Log
likelihood
17.821 61.742 36.337
Notes: ** significant at α = 0.01, * significant at α = 0.05
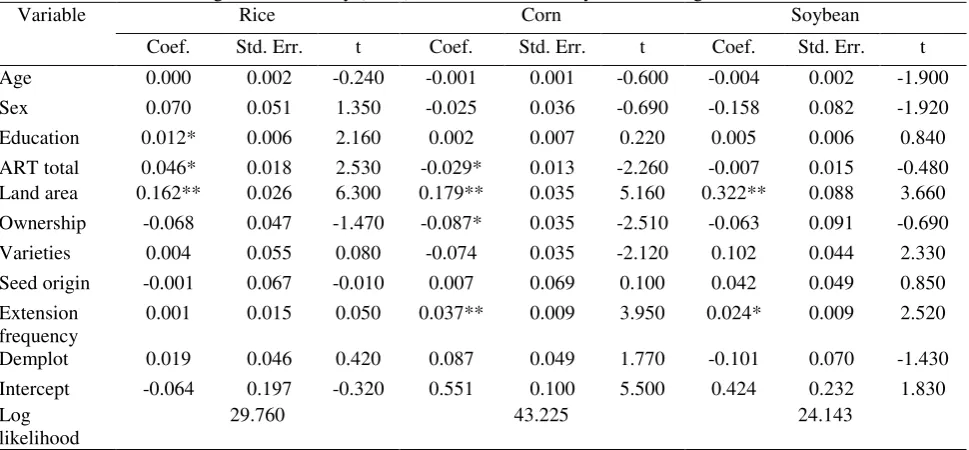
Factors affecting CE in rice farming were education, number of household members, and the land area. In corn farming, the influencing factors were the number of household member, land area, land ownership status, extension frequency, while
in soybean farming the factors affecting the cost efficiency were land area and extension frequency (Table 4)
Table 4. Factors Affecting Cost Efficiency (CEK) in Rice, Corn and Soybean Farming
Variable Rice Corn Soybean
Coef. Std. Err. t Coef. Std. Err. t Coef. Std. Err. t Age 0.000 0.002 -0.240 -0.001 0.001 -0.600 -0.004 0.002 -1.900 Sex 0.070 0.051 1.350 -0.025 0.036 -0.690 -0.158 0.082 -1.920 Education 0.012* 0.006 2.160 0.002 0.007 0.220 0.005 0.006 0.840 ART total 0.046* 0.018 2.530 -0.029* 0.013 -2.260 -0.007 0.015 -0.480 Land area 0.162** 0.026 6.300 0.179** 0.035 5.160 0.322** 0.088 3.660 Ownership -0.068 0.047 -1.470 -0.087* 0.035 -2.510 -0.063 0.091 -0.690 Varieties 0.004 0.055 0.080 -0.074 0.035 -2.120 0.102 0.044 2.330 Seed origin -0.001 0.067 -0.010 0.007 0.069 0.100 0.042 0.049 0.850 Extension
frequency
0.001 0.015 0.050 0.037** 0.009 3.950 0.024* 0.009 2.520
Demplot 0.019 0.046 0.420 0.087 0.049 1.770 -0.101 0.070 -1.430 Intercept -0.064 0.197 -0.320 0.551 0.100 5.500 0.424 0.232 1.830 Log
likelihood
29.760 43.225 24.143
Notes: ** significant at α = 0.01, * significant at α = 0.05 Based on the analysis, as shown in Tables 3 and 4, the general fact, which can be obtained is that the most dominant factors affecting TE and CE in rice, corn and soybean farming are factors of land area and extension frequency. The larger the cultivated land, or the more the extension frequency is, the higher farming efficiency (TE and CE) will be. Therefore, increasing land used for the farming and the extension on technological innovation are required to increase the efficiency of farming crops.
CONCLUSION
Factors on education and land area influence the technical efficiency and cost (TE and CE) of rice farming. In maize farming, the affecting factors are land area, status of land ownership, frequency of extension; whereas, in soybean farming the influential factors are status of land ownership and frequency of extension. The required policy to improve the efficiency of crop farming in Indonesia is the shared management to scale up businesses, as well as the increased frequency on the extension of technology innovation.
REFERENCES
ASEAN Food Security Information System (AFSIS). (2016). Statistic. http: //www.afsisnc.org/statistics
Food and Agriculture Organization (FAO). (2016). Production and Trade. Faostat.org. http://www.fao.org
Coelli, T. J., Rao, D. S. P., O'Donnell, C. J., & Battese, G. E. (2005). An introduction to efficiency and productivity analysis. Springer Science & Business Media.
Xiao, J., & Li, D. (2011). An analysis on technical efficiency of paddy production in China. Asian Social Science, 7(6), 170. Ngeno, V., Mengist, C., Langat, B. K., Nyangweso,