Economic Impact Analysis of the 2012 Indonesia Mineral-Export
Tax Policy: A CGE Approach
Hidayat AMIR
Researcher
Fiscal Policy Agency, Ministry of Finance
RM Notohamiprodjo Building Floor 4th, Jalan Dr. Wahidin No. 1, Jakarta 10710 E-mail: [email protected]
ABSTRACT
In May 2012, the Indonesian government implemented a series of new mineral export restrictions: (1) Regulation of Minister Energy and Mineral Resources (MEMR) No. 7/2012 to ban export of unprocessed metals and non-metallic minerals, and then revised by Regulation of MEMR No. 11/2012; (2) Regulation of Minister of Trade (MOT) No. 29/M-DAG/PER/5/2012 to clarify the position on exports of unprocessed minerals and ores; and (3) Regulation of Ministry of Finance (MOF) No. 75/PMK.011/2012 to impose export tax on these commodities. The main objective of these series of regulations is to increase the value added of the domestic processing industries as stipulated by Law No.4/2009, through giving incentives to mineral processing industries and disincentives (impose tax) on unprocessed mineral exports.
This study analyses the impact of these new mineral export restriction policies on the Indonesian economy within a computable general equilibrium (CGE) framework. The model’s database is consolidated from three key data sources: (a) the 2005 Indonesian Input-Output (IO) Table; (b) the 2005 Indonesian Social Accounting Matrix (SAM); and (c) the 2005 National Socioeconomic Survey (Susenas). All the data were published by BPS-Statistics Indonesia. This study investigates how the export tax policy affects the country’s economy not only at a macro-level, such as the impact on economic growth, industrial output, and employment, but also at a micro-level, such as impacts on poverty and income distribution.
Key words: CGE model, mineral export tax, fiscal policy.
JEL Classification: C68, E62, F13
Economic Impact Analysis of the 2012 Indonesia Mineral-Export
Tax Policy: A CGE Approach
1. Introduction
Export taxes have been used by governments as a tool of economic policy for various objectives since a long time ago. The study from Devarajan et al (1996) says that England applied export
taxes on raw wool and hides from 1275 to 1660 to promote domestic industry processing. In the era of Henry VII, export taxes played an important role in industrial development in the sense of protecting the competitiveness of domestic industries relative to foreign textile producers (Reinert,
2008).
Then the history of export taxes as a tool of policy belongs to many countries in the world
with various government objectives. Piermartini (2004) reports that about one third of WTO members impose export duties (taxes) and he states that export taxes are not prohibited by the
WTO. There are many reasons why countries today would impose trade restrictions on commodities such as in the form of export taxes: (1) government revenue, (2) price stability, (3)
terms of trade, (4) value added and infant industry, (5) currency devaluation, (6) inflation, and (7) tariff escalation.
In the case of Indonesian history, during the 1980s export tax was implemented to restrict exports of logs in order to develop domestic wood processing industries. Several years later,
Indonesia became the largest manufacturer of hardwood plywood in the world (Thee, 2009). The success story became an inspiration for the most recent policy of imposing export tax on mineral commodities.
Based on Indonesian export statistics, the export of unprocessed minerals increased tremendously during the past decade. For the period of 2008 – 2011, the volume of exports of
nickel ore increased eight times, and eleven times for copper ore. In the same period, ferrous ore and bauxite ore also experienced significant increase in their export volume; seven and five times
respectively. This phenomenon drew the government’s attention to mitigate not only the environmentally negative impact of overexploited mineral resources, but also the loss of
opportunity to obtain the benefit from the value-added of mineral processing industries.
In May 2012, the Indonesian government implemented a series of new mineral export
restrictions: (1) Regulation of Minister Energy and Mineral Resources (MEMR) No. 7/2012 to ban export of unprocessed metals and non-metallic minerals and then revised by Regulation of
of Finance (MOF) No. 75/PMK.011/2012 to impose export tax on these commodities. The main objective of these series of regulations is to increase the value added of the domestic processing
industries as stipulated by Law No.4/2009 through giving incentives to mineral processing industries and disincentives (impose tax) on unprocessed mineral exports.
This study analyses the impact of these new mineral export restriction policies on the Indonesian economy within a computable general equilibrium (CGE) framework. This study
investigates how the export tax policy affects the country’s economy not only at a macro-level, such as impact on economic growth, industrial output and employment, but also at a micro-level,
such as impacts on poverty and income distribution. Below we discuss the summary of the CGE model, the simulation scenarios and how to estimate the magnitude of economic shocks, the analysis of the simulation results, and policy recommendations.
2. Economic implications of export taxes: literature review
Export taxes are a form of export restriction policy; others are export bans, regulated exports include quotas and licensing requirements, and supervised export to ensure an adequate domestic
supply of "essential goods" at a reasonable price (Piermartini, 2004; Mitra and Josling, 2009). As a tool of government policy to achieve its objectives, the effectiveness of imposing export taxes
is affected by many factors. Piermartini (2004) indicates that the effect of an export tax depends on market power. In the case of a small country, imposing an export tax only affects the domestic
market in terms of price and domestic supply but the world price remains unchanged. Meanwhile, in the case of a big country it is assumed that the country’s exports are a significant share of world
exports, such that if the exports from this country are reduced as a result of the export tax policy, then world exports are significantly reduced and the world price increases (Bouët and Debucquet, 2010).
In the literature, there are abundant resources on the study of the effect of applying an export tax. Hasan et al. (2001) analysed the effects of an export tax on export performance of the
Indonesian palm oil industry. Using a time series analysis vector autoregressive (VAR) model, they concluded that export tax policy had a negative effect on competitiveness of the Indonesia
palm oil industry.
By collecting information from a survey of cocoa bean producers of South Sulawesi, the
largest producer province, Rifin (2012) analysed the impact of export taxes on cocoa farmers that were implemented in April 2010. He employed three quantitative approaches: marketing system,
concluded that implementation of the export tax decreased the competitiveness of Indonesia cocoa beans in the international market. It entailed that the margins of the farmers decreased.
In terms of export tax policy on the Indonesia crude palm oil (CPO), there are some studies such as those conducted by Obado et al. (2009) and Rifin (2010). Using the 2SLS method
econometric model, Obado et al. (2009) found that export taxes had a negative relationship to mature area of oil palm plantations, production, export, and domestic price of CPO, but a positive
relationship to CPO consumption and stocks. The export tax benefitted domestic consumers at the cost of competitiveness reduction of Indonesian CPO in international markets. The study of
Rifin (2010) considered Indonesian CPO competitiveness compared to Malaysia as the main competitor. His study reached similar conclusion in the sense of competitiveness reduction as the result of the export tax.
The econometric approach to impact analysis of export tax policy can estimate very well the relationship between export taxes and other variables such as export quantity, export and
domestic prices, production and also competitiveness. But this approach misses the inter-linkage impacts between sectors in the economy (wide economic impact analysis). The CGE approach
offers the possibility of this wide economic impact analysis. Arrow (2005) wrote, ‘. . . in all cases where the repercussions of proposed policies are widespread, there is no real alternative to CGE.’
The major advantage of the CGE approach is its ability to incorporate interactions that are important in a complex economy (Rege, 2003).
From the literature we could find some studies of impact analysis of export tax policy; Jakfar (2001), Gelan (2004), Waschik and Fraser (2007), Bouët and Debucquet (2010), and
Solleder (2013) are among of them. The study of Jakfar (2001) evaluates the impact of the imposition of an export tax on the plywood sector in Indonesia. From his study, the simulation results show that an export tax on the plywood processing sector had a negative effect on
economic growth and labour demand in the log and plywood industry. But it had a positive impact on total labor demand, government revenue, income distribution, wood resources and social
welfare. Decrease in labour demand in the log and plywood industry due to imposing an export tax on this industry could not be absorbed in other sectors during the period. It is noteworthy that
the policy of an export tax on plywood can preserve forests and trees for future use (Jakfar, 2001). This study’s results were supported by Thee (2009), even though Thee (2009) did not employ
CGE in his approach. The present study is one of those which use the CGE framework to analyse the impact of export tax policy. The relevant features of the CGE model used in this study will be
3. Summary of CGE model’s features
The CGE model used for the policy simulations is modified from Indofiscal (Amir, 2011; Amir
et al., 2013) to have more detailed categories of 175 industries/commodities (as the 2005 standard IO table). Increasing the number of industry/commodity categories to have more detailed
information of minerals industries caused labour categories to be aggregated from 16 categories into only one category. Aspects of the model were based on ORANI-G (Horridge, 2003) and the
Applied General Equilibrium Model for Fiscal Policy Analysis (AGEFIS) developed by Yusuf et al. (2008). This model adopted AGEFIS to incorporate useful information from the 2005
Indonesian SAM, especially the part regarding transactions between agents in the economy. AGEFIS is the first fully SAM-based CGE model of the Indonesian economy with a focus on fiscal policy analysis. SAM-based CGE models provide better information, particularly if the
focus is on the analysis of fiscal policy, which requires more detailed information about the flow of transactions from government revenue and expenditures, as well as households. The theoretical
structure of the model is based on the Johansen approach, in which the equations are linearised using percentage changes instead of the levels of variables. This is also the approach used by most
Australian CGE models such as ORANI (Dixon et al., 1982) and MONASH (Dixon and Rimmer, 2002). In terms of extending the household categories to have adequate features on poverty and
income distribution analysis, this study adopted the approach from Yusuf (2007).
The database for this model consists of 175 commodities/industries, 7 margins (trade and
various transportation costs), two sources (domestic and imports), two primary factors (labour and capital), and 200 household classifications to represent percentile income distribution in rural
and urban areas. The database is consolidated from three key data sources: (a) the 2005 Indonesian IO Table; (b) the 2005 Indonesian Social Accounting Matrix; and (c) the 2005 National Socioeconomic Survey. All the data were published by BPS-Statistics Indonesia. There are two
main steps to consolidate the three data sources into the final model database. The first step is expanding household categories in the 2005 SAM and the 2005 IO table using the information
from Susenas 2005. The second step is combining and compiling the extended 2005 IO Table with the extended 2005 SAM to have all the features of the model database.
3.1. Structure of production
single output industries, using as inputs domestic and imported commodities, primary factors and other costs. The primary factors of production include capital and labour as mentioned earlier.
Figure-1: Structure of production
Source: Adopted from Horridge (2003)
Output is produced through a two-level process. In the top level, the production of output
payroll taxes. All of these inputs are combined via a fixed-proportion relationship of a Leontief
function to produce outputs following the principle in developing Input-Output Tables. Using this function, if there are plenty of intermediate inputs available for an industry, does not mean that
the level of outputs produced will always increase. It depends on the availability of the primary factor, and the working hours of labour operating machines, to keep all inputs production in the
fixed-proportion relationship. The 1A TOT i( ) terms are Hicks-neutral technical-change terms,
affecting all inputs equally.1
In the lower level of the production structure, there are two nests: import/domestic composition of intermediate inputs and primary factor proportions. Firstly, the intermediate input
1 All variables that start with the letter A represent technological changes.
demands for each producer X1 _ S c i, follow the cost minimisation function through imperfect
substitution of domestic and imported goods X1c s i, , using Armington’s assumption
(Armington, 1969). To minimise costs, producers choose to purchase materials from domestic or imports whichever give the cheaper price. If the price of materials from the domestic market
increases and becomes more expensive, producers shift in demand from the domestic market to the import market. The substitution is directed by the CES (Armington) parameter to generate realistic responses of trade to price changes.
1 , ,
Secondly, the cost of demand for primary factors X P R IM1 i is minimised using the CES
function. Similar to the procedure in intermediate demands, the producers substitute the more
expensive input (capital X C A P i1 or labour compositeX L A B1 _O i ) with the one which is
The structure of the final demand for investment by industries is very similar to the structure of production, except there is no requirement for primary factors and other costs. Capital is assumed
to be produced with inputs from domestic and imported commodities. Investment demand is derived from a two-part cost-minimisation problem. At the bottom level, the total cost of domestic
and imported commodities X2 _ S c i , is minimised subject to the CES production function.
2
, ,
Leontief production function. The total amount of investment in each industry X 2T O T i is
exogenous to the above cost-minimisation problem. It is determined by other equations.
3.3. Household demands
There are 200 representative household categories in the economy, each household maximises its
utility by choosing the commodities to be consumed subject to the budget constraint. The nesting structure for household demand is nearly identical to that for investment demand. The only
difference is that commodity composites are aggregated by a Klein-Rubin utility function, rather than a Leontief function leading to a linear expenditure system (LES).
The equations for the lower import/domestic nest are similar to the corresponding equations for intermediate and investment demands. The allocation of household expenditure between
commodity composites is derived from the Klein-Rubin utility function (Horridge, 2003) where there are two kinds of demand: ‘subsistence demand’ for the requirement of each good that are not considering price and ‘luxury demand’ for the share of the remaining household expenditure
allocated to each commodity.
The household utility function only determines the composition of commodities demanded
by households to maximise their utility. The total of household consumption in an economy is generated by the total household disposable income or household income minus the level of
income tax (PIT rate) levied on income. More detail of the household income equations is discussed in the section on institutions in the economy.
3.4. Export demands
There are two groups of demands: individual and collective exports. For an individual export commodity, foreign demand is inversely related to that commodity's price. For collective export commodities, foreign demand is inversely related to the average price of all collective export
commodities.
The individual export group, which would normally include all the main export
commodities, is defined by the equation that specifies downward-sloping foreign demand schedules for these commodities
where EXP_ELAST(c) is a negative parameter – the constant elasticity of demand. Export volumes X4(c) are declining functions of their prices in foreign currency (P4(c)/PHI). The
The collective export group includes all commodities for which the above equation is inappropriate. This typically includes service commodities and other commodities where export
volumes do not seem to depend mainly on the corresponding price. The commodity composition of aggregate collective exports is exogenised by treating collective exports as a Leontief aggregate.
Demand for the aggregate is related to its average price via a constant-elasticity demand curve, similar to those for individual exports.
3.5. Institutions
There are four institutions in the model: households, corporate, government, and rest of the world. Households as a source of factors of production have income from the ownership of factors of production. Household income can also be derived from transfers received from governments,
corporations, overseas and other households. Households’ income after tax deduction is equal to disposable income, and taxes are a percentage of household income based on the marginal income
tax rate structure. Part of disposable income will be spent and the rest will be saved.
Corporate income consists of the revenue from ownership of production factors minus
corporate income tax, and transfer from other institutions. Corporate spending goes to payment or transfer to other institutions. The balance is defined as corporate saving.
Total government revenue can be described as the sum of receipts from various sources as follows: (i) indirect taxes; (ii) revenue from export tax on each commodity; (iii) revenue from
import tariff on each commodity; (iv) household income tax (PIT) revenue; (v) corporate income tax (CIT) revenue; (vi) transfers from foreign parties; and (vii) revenue from government-owned
production factors. Government expenditure consists of expenditure on goods and services for each commodity, and expenditure for transfer to domestic and foreign parties. Other expenditures made by the government are in the form of subsidies on commodity goods and for industries.
Finally, government revenue minus government expenditure is defined as the government budget balance (surplus).
In the Rest of the World (ROW), foreign income is defined as the revenue of the rest of the world from ownership of production factors, payments received from imported commodities and
transfers from other institutions. Foreign expenditure consists of spending for exported commodities, payments to production factors, and transfers to other institutions. The balance is
3.6. Closure
In the comparative static CGE model, the reaction of the economy to an exogenous shock is at
only one point in time, therefore the solution path over time is not known. Time is represented in the comparative-static framework in terms of the short run and long run. In this model, closure is
distinguished between short-run and long-run closure, based on exogenous variables in the factor market. In the short-run, we assume that there is not enough time for the capital stock to adjust
and that there is no new investment. Capital is sector-specific, that is, it is fixed for each industry and cannot move between sectors. The capital rate of return adjusts to reflect the changes in the
demand of capital. The short-run closure also assumes that this time frame is not long enough for contractual labour to adjust. Hence the real wage rate is fixed. This means that aggregate employment can change to respond to changes in the labour market.
On the other hand, in the long run closure, the labour wage rate is fully flexible to keep the economy in the full-employment condition. Labour can move between sectors and different types
of occupations. In addition, the capital stock is allowed to change and move between sectors. The capital rate of return at the national level is fixed, but at the sectoral level it may change or be
positively correlated with sectoral capital growth. Variables that are assigned as exogenous in the short-run and long-run simulations are tax rates, imports, transfers between institutions and all
technological changes.
In the policy applications, we run the simulations under two different conditions: under
budget neutrality condition for the long-run scenario and under non-budget neutrality condition for the short-run scenario. Under the non-budget neutrality condition, the tax export policies will
increase the government's revenue for the current year, but the government keeps the same level of spending so the budget deficit will decrease. However, under the budget neutrality condition, the additional government revenue can be allocated by increasing the level of spending by a
certain proportion in the model. In addition, this model does not yet have a feature that represents change in the government budget financing aspects.
4. Simulation scenarios and magnitude of shocks
In order to set up the simulation scenarios and the magnitude of shocks, we identify the information related to mineral industries from the 2005 Indonesia IO Table. Based on the IO
Table, there are seven mineral commodities, as shown in Table 1 that are subject to export tax policies. Table 1 also shows the proportion of each mineral commodity used as an intermediate
chemicals industry, non ferrous basic metal industry, and other metal products industry as 72.6%, 14.6%, and 0.1% respectively. These three industries consume 87.2% of all tin ore used as
intermediate input for all industries.
Table 1: Proportion of mineral as intermediate input for main user industries (%)
Source: the 2005 Indonesia IO table
Imposing export taxes on mineral ores is expected to increase the value-added of mineral processing industries, so we will evaluate four main mineral processing industries: basic
chemicals, basic iron and steel, non ferrous basic metals, and other metal products. In order to evaluate the policies we set simulation scenarios as shown in Table 2.
Basically, the simulations evaluate three different policies: (1) impose export tax of 20% on seven mineral commodities in the short-run simulation under non-budget neutrality condition;
(2) impose export tax of 20% on seven mineral commodities in the long-run simulation under budget neutrality condition; and (3) impose export tax of 20% on seven mineral commodities in
the long-run simulation under budget neutrality condition and also assume that there is a 20% increase in investment and a 15% increase in productivity of those mineral processing industries.
Magnitude of the increase in investment and productivity is set arbitrarily with the purpose of representing significant responses in the mineral processing industries as expected by government
Table 2: Simulation scenarios
SIM2 and SIM3 are conducted to compare the different policy responses in mineral
processing industries. SIM2 represents a “business as usual” response on imposing export taxes on mineral commodities. While SIM3 is used to see how much imposing export taxes on mineral
commodities triggers significant improvement of value-added in processing industries. Here we assume significant improvement of 20% increase in investment and 15% increase in productivity
of those four mineral processing industries.
5. Simulation results and analysis
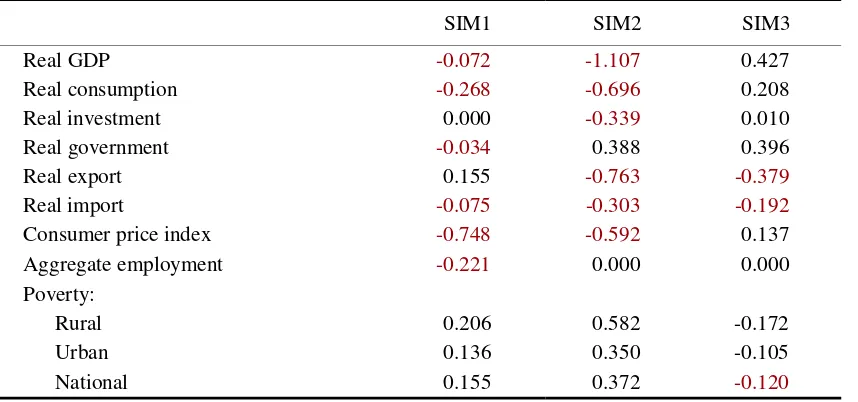
Table 3 summarizes the macroeconomic impacts of export tax policies. In the short-run (SIM1),
it is assumed that there is no new investment and fixed real wages; so we can see from the table that the impact on real investment is 0%, and the change in labour demand is transferred to
aggregate employment of -0.221%. Due to the assumption of non-budget neutrality condition, the impact to real government (consumption) is close to zero. This means that the additional government revenue from the export tax does not transfer into government spending in the current
year but is kept as government saving. In addition, imposing export tax causes an increase in unemployment which in turn causes a decrease in households’ consumption and demand for
imported goods. As a result, the economy experiences a slight decrease in economic growth. In the long-run scenarios, it is assumed that the economy has enough time for new
investment and returns to the full-employment condition. It means that changes in labour demand will adjust to changes in the labour price (wage). SIM2 shows that in the long-run scenarios, if
the economy performs in a “business as usual” way, export taxes will hit economic growth, due to the policies’ effect in decreasing exports and investment. It will cause a decrease in labour
wages and then a decrease in consumption. The only macroeconomic variable which experienced a positive impact is real government consumption, as a result of the additional government
revenue from export taxes. In overall, the economy is contracted by 1.017%.
Simulation Scenario Budget
Neutrality Description
SIM1 Short-run No Impose export tax of 20%
SIM2 Long-run Yes Impose export tax of 20%
Table 3: Macroeconomic and poverty impacts (% changes)
If we assume that investment and productivity in these mineral processing industries
increase by 20% and 15% respectively, this will bring good impacts. Investment will grow even though by a very small percentage. Household consumption increases by 0.208% and overall real GDP increases by 0.427%. In sum, in the long-run the policy of imposing export tax on mineral
commodities has a positive impact on the economy if it is followed by a significant increase in investment and productivity of mineral processing industries.
Furthermore, the hit to the economy in SIM1 and SIM2, as has been discussed earlier also has a negative impact on poverty. The level of impact in SIM2 is double than in SIM1. In contrast,
in SIM3 when the economy grows, the poverty level declines.
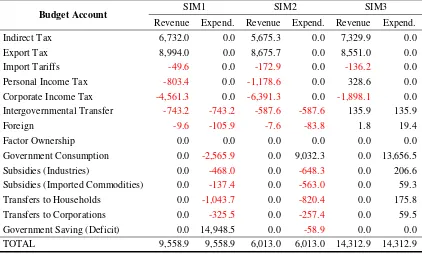
For the fiscal aspect, as discussed earlier the immediate impact of imposing export taxes is
an increase in the government’s revenue from taxes. As shown in table 4, in the short-run simulation under non-budget neutrality condition (SIM1), export tax revenue and indirect tax
revenue increase by Rp8,994.0 billion and Rp6,732.0 billion respectively. The increase in indirect tax is mainly as result of an increase in the prices of commodities used as intermediate inputs in
production.
On other hand, the revenue from corporate income tax declines by Rp4,561.3 billion. This indicates a slowdown in business and industrial output. The revenue from personal income tax
declines by Rp803.4 billion; this indicates the decrease in household income and consumption. In SIM1, the government does not spend the additional income from taxes, so the government
In the long-run simulation (SIM2), the revenue from taxes (export tax and indirect tax) is a little bit lower than in the short-run simulation (SIM1), but the decline in revenue from corporate
and personal income taxes is higher. This indicates that the economy worsens in the long-run as an impact of export tax policies. In addition, in order to keep the budget neutrality condition
government consumption increases by Rp9,032.3 billion.
In the long-run simulation (SIM3), the policy of imposing export taxes on mineral
commodities attracts an increase investment in domestic mineral processing industries by 20%, and also improves their productivity by 15%, so that there is an increase in output of mineral
processing commodities for both domestic and international (export) markets. As a result, the loss from corporate income tax is much less at only Rp1,898.1 billion. The revenue from personal income tax grows by Rp328.6 billion. Indirect tax revenue increases to a level of Rp7,329.9 billion,
and the revenue from export tax remains high at Rp8,551.0 billion. Government consumption increases by Rp13,656.5 billion. All of these results indicate an increase in aggregate industrial
output in the economy.
Table 4: Fiscal impacts (Rp billion)
Due to space limits, the discussion of sectoral impacts in terms of output, price, exports,
and export price will only presents the impacts on selected sectors of mining, and mineral processing industries, as shown in the following figures. Figure-2 and Figure-3 present the impact
Budget Account SIM1 SIM2 SIM3
Revenue Expend. Revenue Expend. Revenue Expend.
Indirect Tax 6,732.0 0.0 5,675.3 0.0 7,329.9 0.0
Export Tax 8,994.0 0.0 8,675.7 0.0 8,551.0 0.0
Import Tariffs -49.6 0.0 -172.9 0.0 -136.2 0.0
Personal Income Tax -803.4 0.0 -1,178.6 0.0 328.6 0.0
Corporate Income Tax -4,561.3 0.0 -6,391.3 0.0 -1,898.1 0.0
Intergovernmental Transfer -743.2 -743.2 -587.6 -587.6 135.9 135.9
Foreign -9.6 -105.9 -7.6 -83.8 1.8 19.4
Factor Ownership 0.0 0.0 0.0 0.0 0.0 0.0
Government Consumption 0.0 -2,565.9 0.0 9,032.3 0.0 13,656.5
of mineral export tax policies as changes in industrial output and general output prices of locally-produced commodities. Figure-2 shows that in the short-run simulation (SIM1) the output of
mineral industries decreases as an impact of imposing an export tax, but only to a small percentage, less than 10%. The changes in the output of mineral processing industries are very small or not
significant.
Figure-2:
Output impacts (% changes)
Figure-3:
Domestic price impacts (% changes)
mineral industries. But in the mineral processing industries, the significant decline is only in the output of non ferrous basic metals. In SIM3, the output decline is nearly similar to SIM2, though
at a bit lower percentage, but gold ore only has a very small decrease. In contrast, silver ore experiences a significant increase in output because there is increased demand for minerals as
intermediate inputs for mineral processing industries. As shown in Figure-2, the output of mineral processing industries increases significantly mainly in the four main mineral processing industries
that experience an increase in investment and productivity based on the simulation shocks. Figure-3 shows that in the short-run simulation (SIM1) all mineral commodities experience
a price decline in the domestic market as the effect of imposing export tax, except for silver ore. The price of commodities used in mineral processing industries is not changed significantly. In the long-run simulation (SIM2), the price of minerals is stabilized by reducing supply to equal the
demand decline. The price adjustment transfers to some mineral processing industries as a result of the reduction in supply of intermediate inputs, as shown in Figure-2 and Figure-3 for the case
of non ferrous basic metals.
In SIM3 when there is an increase in investment and productivity in four main mineral
processing industries, the price of the commodities in these industries decreases as a result of efficiency from higher productivity as shown in Figure-3. The increase in productivity in mineral
processing industries brings demand increases, so the prices of minerals increase slightly. Further investigation of the impact of the policy in terms of output and price are shown in
Figure-4 and Figure-5. Figure-4 shows that in the short-run (SIM1) the export tax policy causes small decrease in the volume of mineral exports, except silver ore and tin ore. In addition, we can
say that there is no impact on exports of mineral processing commodities. A significant impact in the export commodities of silver ore and tin ore are related to the significant effect on price of these commodities as shown at Figure-5.
In the long-run (SIM2), the impacts of export decline accumulate and are similar to all mineral ores, above 50% on average. In the mineral processing industries, a significant impact is
shown in the export decrease of non-ferrous basic metals and non-ferrous basic metal products, while the impact on the export of other processed minerals is not significant (Figure-4), due to
the non-ferrous basic metals absorbing intermediate input from nearly all mineral ores in large quantities (please see Table 1). A portion of impact is transmitted to non-ferrous basic metal
products as further processing in the product line. Comparing Figure-4 and Figure-5, the impact of imposing export tax on mineral ores to the price of mineral commodities and the export volume
Figure-4:
Export volume impacts (% changes)
Figure-5:
Export price impacts (% changes)
In SIM3, the impacts on the export of mineral ores are similar to the impacts in SIM2 in
terms of volume and price changes. Due to significant growth of investment and productivity in the mineral processing industries, the export volume of processed mineral commodities increased
significantly. The export volume of other metal products increased about 100%. In addition, the export volume of non-ferrous basic metals and non-ferrous basic metal products returned to
normal after the severe decline in SIM2, even though still negative. Figure-5 shows the impact of export prices of commodities. The export price of basic chemicals, basic iron and steel, and other
The impact on labour is presented in Figure-6. As mentioned above, the short-run simulation uses a fixed real wage assumption. The increase in labour demand created new
employment, either in the form of additional labour or additional work hours. This created an increase in labour income, with the different percentages depending on the increase in the level
of demand. In the long-run simulation, the fixed real wage assumption is relaxed to bring the economy to full employment, but labour can move between sectors driven by the different sectoral
impact of the policies.
Figure-6 shows that in the short-run the export tax policy causes a decrease in labour in the
mineral ore industries. In the long-run, the decreasing labour in these sectors is higher, but it is compensated partially with an increase in the mineral processing industries. The increase in investment in mineral processing industries is not fully translated in the increase in labour demand,
but partially translated into the increase in productivity in the form of utilization new technology.
Figure-6: Labour impacts (% changes)
The impact of the policy on real household income distribution is presented in Figure-7. The impact of imposing export tax is transmitted into the sectoral output and price, particularly
and then transfers to the household income. This shows that the policy impact is quite modest amongst households from the poorest to the richest household groups.
Figure-7: Real household income distribution impacts (% changes)
6. Conclusions and Policy Recommendations
The recent Indonesian government policy to impose export taxes on unprocessed mineral exports is intended to increase the value added of domestic processing industries. In the short-run, the
export restriction policies will hit the economy, mainly causing a significant decline in mineral exports and lack of new investment. In the long-run, when new investment in mineral processing
industries is still very small, or in a “business as usual” scenario (represented by SIM2), while other sectors are declining, the economy worsens. But when the level of investment increase
significantly, particularly in the mineral processing industries as expected from the policy, then productivity in these sectors increases; all of these conditions affect the transmission from
unprocessed minerals and ores export to processed mineral commodities. As a result it creates a new equilibrium and the economy returns to grow.
mineral processing industries, the government could use some portion of its additional revenue to give incentives in these sectors. Some other portion could be used to create a buffer program for
the labour of minerals industries to soften the negative effects on unemployment and reduce the time of transition to find a new job.
The government also could spend additional revenue on infrastructure projects that related to mineral processing industries. For example, develop road networks connecting the raw mineral
industries to the manufacturing process and seaports in order to transport the processed mineral commodities to international markets more efficient. It is necessary to reduce the initial
investment in developing new plant for processing minerals and ores.
7. Limitations and future study
The present study has some limitations that could be addressed in future work. First, in terms of methodology, the CGE model used in this study is comparative static in nature. Although this
model has provided a logical and adequate simulation analysis, it would be desirable to use a dynamic CGE model to undertake more complex analysis. Extending it to a dynamic CGE model
would give a better picture of how government policy and its impacts on the economy would evolve over time. The comparative static model has no adequate capability to evaluate the impact
and responses of economic agents in the pattern of period. It only provides the evaluation in the sense of short- and long-run defined by assumptions.
Second, the model employs databases for the year of 2005. The time lag between the database available and the time of policy making decision may cause some problems in the
analysis. The use of expert judgment, addition of the latest data, and discussions amongst stakeholders then are justifiable. Employing models that accommodate several modelling specifications, not only inter-linkage impacts but also forecasting capabilities, will be beneficial,
REFERENCES
Amir, H. 2011. Tax Policy, Growth, and Income Distribution in Indonesia: A Computable General Equilibrium Analysis. Unpublished PhD Thesis, School of Economics, The University of Queensland, Brisbane.
Amir, H., J. Asafu-Adjaye, and T. D. Pham. 2013. The impact of the Indonesian income tax reform: A CGE analysis. Economic Modelling 31:492-501.
Armington, P. S. 1969. Theory of Demand for Products Distinguished by Place of Production.
IMF Staff Paper 16 (1):159 - 178.
Arrow, K. J. 2005. Personal Reflections on Applied General Equilibrium Models. In Frontiers in Applied General Equilibrium Modelling, edited by T. J. Kehoe, T. N. Srinivasan and J. Whalley. Cambridge: Cambridge University Press.
Bouët, A., and D. L. Debucquet. 2010. Economics of Export Taxation in a Context of Food Crisis: A Theoretical and CGE Approach Contribution. IFPRI Discussion Paper 00994
(June 2010).
Devarajan, S., D. Go, M. Schiff, and S. Suthiwart-Narueput. 1996. Whys and Why Nots of Export Taxes. Policy Research Working Paper 1684.
Dixon, P. B., B. R. Parmenter, J. M. Sutton, and D. P. Vincent. 1982. ORANI: A Multisectoral Model of Australian Economy. Amsterdam: North-Holland.
Dixon, P. B., and M. T. Rimmer. 2002. Dynamic General Equilibrium Modelling for Forecasting and Policy: A Practical Guide and Documentation of MONASH. Amsterdam: North Holland.
Gelan, A. 2004. System-wide Impacts of Agricultural Export Taxes: A Simulation Experiment with Ethiopian Data. Aberdeen Discussion Paper Series: People, Environment and Development, The Macaulay Institute, Aberdeen, Scotland.
Hasan, M. F., M. R. Reed, and M. A. Marchant. 2001. Effects of an Export Tax on Competitiveness: The Case of the Indonesian Palm Oil Industry. Journal of Economic Development 26 (2):77-90.
Horridge, J. M. 2003. ORANI-G: A Generic Single-Country Computable General Equilibrium Model. Melbourne: Centre of Policy Studies and Impact Project, Monash University, Australia.
Jakfar, F. 2001. A general equilibrium analysis of the economic aspects of the imposition of an export tax on the plywood sector in Indonesia. Journal of Forest Research 6 (2):73-80.
Mitra, S., and T. Josling. 2009. Agricultural Export Restrictions: Welfare Implications and Trade Disciplines. Agricultural and Rural Development Policy Series, International Food & Agricultural Trade Policy Council.
Piermartini, R. 2004. The Role of Export Taxes in the Field of Primary Commodities. Discussion Paper World Trade Organization.
Rege, S. R. 2003. Applied General Equilibrium Analysis of India's Tax and Trade Policy. Hants, England: Ashgate.
Reinert, E. S. 2008. How Rich Countries Got Rich…and Why Poor Countries Stay Poor: Wimbledon Publishing Company and Anthem Press India.
Rifin, A. 2010. The Effect of Export Tax on Indonesia’s Crude Palm Oil (CPO) Export Competitiveness. ASEAN Economic Bulletin 27 (2):173-184.
———. 2012. Impact of Export Tax Policy on Cocoa Farmers and Supply Chain. SEADI Discussion Paper No. 1 (December 2012).
Solleder, O. 2013. Trade effects of export taxes. Graduate Institute of International and Development Studies Working Paper, No. 08/2013.
Thee, K. W. 2009. The Indonesian wood products industry. Journal of the Asia Pacific Economy
14 (2):138-149.
Waschik, R., and I. Fraser. 2007. A computable general equilibrium analysis of export taxes in the Australian wool industry. Economic Modelling 24 (4):712-736.
Wittwer, G. 1999. WAYANG: a General Equilibrium Model Adapted for the Indonesian Economy. ACIAR project no. 9449, Centre for International Economic Studies, University of Adelaide, Adelaide.
Yusuf, A. A. 2007. Equity and Environmental Policy in Indonesia. Unpublished PhD Thesis, The Australian National University, Canberra.