THE BENEFITS OF COMMUNITY BASED CLEAN WATER
SERVICE FOR UPLAND POOR FAMILY IN LAMPUNG
PROVINCE
Zainal Abidin*, Ktut Murniati*, Sudarma Widjaya*
Corresponding author: [email protected]
*Lecturer at the Department Agribusiness, Faculty of Agriculture,University of Lampung
Jl. Soemantri Brojonegoro 1, Bandar Lampung, 35145
Abstract
Community based clean water service is very common in rural area, especially in area nearby forest. This service serves thousands of poor families and provides easy and
affordable waters. This study aims at assessing the benefits of community based clean water service for upland poor family in Lampung Province. The study was carried out in Wan Abdul Rachman National Park in September-November 2016 involving 40 respondents in three hamlets of Talang Mulya Village, Kecamatan Teluk Pandan, Kabupaten Pesawaran, Lampung. The study used market based valuation method in which consumers surplus was used as indicator of the benefit. The study suggests that the monthly fee for the service was ranging from Rp 2.500 and Rp 6.551 per monh or in average was around Rp 4600. The family recieved water ranging from 500 to 2000 with average of 1485 liter per day and it was far higher than their daily need from 352 to 362 liter per day or in average 356 liter per day. The study computed that the price for this water services was merely Rp 0.13 per liter, which was far lower than Rp 2,8 per liter charged by PDAM Way Rilau.
Average excess supply of water was estimated at 135 liter per day or valued at Rp 3,266.5 per day. Daily consumer surplus was Rp 3,905 or Rp 1.4 million per day. However, only 21% of that benefit was actually gained by families as 79% of water was drained to local sewer. It is concluded that this services helps poor family. However, reducing over untapped excess supply through improvement of water utilization for food crops and fishpond is needed.
Keywords: clean water services, consumers’ surplus, benefits
1.
Introduction
In most village in Indonesia, clean water is considered “expensive” item beause its scarcity, while to have access on it requires strenuous efforts. Though nature has provided ample of water from forest hill, to bring it to the village is usually expensive for villagers, especially for the poors. Study by Abidin (2011) in Way Besai, West Lampung suggests that
Sub-Theme: 3
in order to have acces on clean water services, each family must spend more than Rp 1 million which is quite high for rural families.
Government program the so called PAMSIMAS (Penyediaan Air Minum dan Sanitasi Berbasis Masyarakat) intended to provide affordable water services, but the program was facing budget constraint to reach all the poor rural families in the village. Target of achieving 65% rural families gained acces on clean water and sanitation stated in MDGs (Millenium Development Goals) have not been achieved (Bappenas, 2011). That target was carried over into SDGs (Sustainable Development Goals) in goal number 6.1 goal (Bappenas, 2015) Community based clean water service can be used as alternative model to achieve the said SDGs goals.
Community based clean water service in Talang Mulya district nearby Wan Abdul Rachman National Park is effort of local community in getting access of clean water from forest area nearby. The government’s role was to build reservoir or check dam upstream near forest area, and to install some pipes from checkdam to distribution box in residential
area/village. Then the community of the village organize, manage, and distribute the water to households. This include the installation fees, maintenance, and determination of annual/monthly charge (Abidin, 2011, Murniati, et al., 2016). However, in other cases, the whole system was developed and organized by community. The model of this system is simplified in the following figure.
Figure 1. Skematic of community based clean water services
This system is considered as ecological services in which environment provides priceless resources to community. In return, the community should maintains and conserves water resources to ensure sustainability of the services. In Talang Mulya village, this system has been established in 1999 thank to CSR (corporate social responsibility) of Danamon Bank and it is growing afterwards. However, only two hamlets out of 3 that was served. From around 238 families, only 120 families have been served by this services and the remaining 218 families were not served yet (Murniati, et al. 2016). However, in 2015 the local community developed new facility in order to serve additional 75 families.
The sources of water are located inside forest of Tahura Wan Abdul Rachman, owned by National Forest and managed by Provincial Technical Unit Tahura Wan Abdul Rachman. So far, there is no specific agreement between Tahura and local village in terms of accessing the forest.
Although the service has served community, the price for the service was set up by village government, organizer, and community. Local community is then managing common resources pool (CPR) as Ostrom (2010) suggested. However, the clear definition of the role
Filter
pipes
box
of comunity in managing water resource has not been formulated in the village regulation. In the long run, it may trigger the so called The Tragedy of the Commons (Hardin, 1968) as more people lived through migration in and new generation of old settlers seeking new land for their livelihoods.
This model served rural community, especially the poor. But, unlike in Java, study on community based clean water services in Lampung Province is very limited, despite the significant role of this in community’s affairs. Due to its signigicant role and lack of research on this, the team undertook this study with the following objectives:
1. To determine the economic benefits of community based clean water to the poor community in Talang Mulya village
2. To assess community’s response towards the services
2.
Research Methodology
This study was using case study in Talang Mulya village of Kecamatan Teluk Pandan, Kabupaten Pesawaran. The selection of the village was based on (1) this village was in border tip of Wan Abdul Rachman Park, (2) it has no local/village regulation on governing water resources, , (3) it has potential in water resource, and (4) its livelihood is highly rely on Tahura Wan Abdul Rachman (Wan Abdul Rachman National Park). The study was carried out in from August-November 2016.
2.1 Data Collected
Primary data collected in the study includes the following:
1.
Data on daily water supply to the family that is measured using jar/bootle and stop watch to measure water current (lt/hour)2.
Data on daily water consumption (lt/day)3.
Data no 1 was deducted to data no 2 to obtain surplus/deficit of water supply supply.4.
Data on water service charge (Rupiah monthly or annually)5.
Data on transaction cost of having access to clean water services (Rupiah)6.
Data on willingness to pay (Rupiah)7.
Data on family’s perception on management of clean water services8.
Data on respondents including: age, number of family member, family income, education, livelihoods, and employment (off-farm and on-farm).Secondary data includes: (1) data of water price of PDAM (Perusahaan Daerah Air Minum Way Rilau, Bandar Lampung, (2) data of TAHURA, and (3) data of demographic condition of the study area.
2.2 Respondent
Respondents are families that are receiving clean water services from village. The sample size is determined using Isaac and Michael (1995) with the following formulae.
(1)
Where:
n = sample size
N = population, 120 families
Z = Z distribution at 95% (t= 1,96) with α = 5% two-tail S = standard deviation assuming at 20%
Using that formula and underline assumptions, the sample size was computed at 40 respondents.
2.3 Method of Analysis
To answer objective 1, the study used straightforwarnd tool, i.e. market price valuation technique. According to Husfschmidt, et al. 1983) market-based approach use the market price of goods and services to value environmental goods and services. Economic value of environmental goods and services using market-based approach, can be estimated either from the benefit or cost point of view. Market based approach is standard economic techniques for measuring the economic benefits from marketed goods,based on the quantity people purchase at different prices, and the quantity supplied at different prices (Barbier, 1991).
The use of this technique is because the price of water is available through PDAM price and set up price set up by local organization. Quantity of water in terms of suplly or demand multiplied by price (PDAM and local organization) is used to estimate supply and demand. The difference between of both supply and demand is then used as surplus/deficit. From this calculation, the team is computed consumer surplus to understand the economic benefit of community based clean water service.
To analyze objective 2, the study used descriptive analysis in the form of tabulation and narrative statement. The data include response of community on quality of water, service, service charge, conservation, participation, and cost of such service. The response was scored in Likert data from strongly agree to strongly disagree.
3.
Result and Discission
3.1 Research site
Research site was located in Talang Mulya Village, Kecamatan Teluk Pandan, Kabupaten Pesawaran. This village was previously a hamlet of Hurun Village until it was becoming village in 2012. This village is located just in the border of state forest Register No. 19 Gunung Betung, which is now called Taman Hutan Raya (Tahura) Wan Abdul Rachman. The Tahura itself has area of around 22,249.31 ha covering administrative area of Kabupaten Pesasawan and Kota Bandar Lampung.
Although this village is only 19 km away from Bandar Lampung city, capital city of Lampung Province, it is still considered poor village and has vulnerable status in terms of food security. Lack of infrastructure as well as economic opportunities make this village is relatively poor.
Talang Mulya village has area of 1,772,5 ha with productive agricultural land only 100 ha or 6% of total land. The population in 2015 was 1500 people with 720 and 780 male and female composition respectively. The number of households, mostly farmers, are 500 families with population density at 0.84 person per ha. The village composes of 3 hamlets in which all hamlets right now has clean water service facilities. However, only 24% has been served with clean water service.
3.2 Respondents
There are 40 respondents involved in this study. Distribution of respondent in terms of hamlets is as follows: (a) 13 families in Hamlet 1, (b) 24 families in Hamlet 2, and (c) 3 familiies in Hamlet 3. Majority of respondent is Sundanese followed by Javanese, and South Sumatranese.
3.2.1 Education, age, and family income of respondent
Majority of education of respondent is completing elementary school, follow by small portion of completing junior and senior high school. In terms of age, majority of respondent is at group age of 40-53 years, followed by group age of 26-39, and above 54.
In terms of family income, distribution of family income is presented in Table 1. According to BPS Kabupaten Pesawaran (2015) statistics, poverty line of Kabupaten Pesawaran was Rp 284,870/month/cap. This suggests that on average, respondents or users of clean water services were living under poverty line.
Tabel 1. Average family income of respondents
No. Hamlet/village Average annual income (Rp)
1. Hamlet-1 (n=13) 19,470,000.00
2. Hamlet-2 (n=23) 9,208,333.33
3. Hamlet-3 (n=4) 8,325,000.00
Village 14,162,500.00
Annual income per capita Monthly income per capita
2,832,500.00 236,042
3.2.2 Size of family and landholding
Average family size of respondent was 3 person per family. In terms of distribution, family with 3-4 members were majority, followed by family with 2 members. This suggests that most family is considered small family.
In terms of land, on average landholding is relatively small, i.e. 1,72 ha per respondent family. But, not all land is privately owned since majority of land is located inside state forest land (Register 9), hence cannot use it as tradable asset. The family could only access and do some limited cultivation such as: coffee, pepper, horticulture, rubber, and various multipurpose tree species. With such limitation, it is why on average respondent is considered poor. Distribution of landholding is as follows.
Table 2. Landholding of respondent
No. Hamlet Average landholding (ha)
1. Hamlet-1 (n=13) 1.66
2. Hamlet-2 (n=24) 1.90
3. Hamlet-3 (n=3) 1.60
Village (n=40) 1.72
3.2.3 Water use and supply
Community based clean water service has not been organized well as it is still under the head of hamlet control. As comparison, in Way Besai, community based clean water service has been organized in more formal ways with some regulation in it (Abidin, 2011). In Java, this model is more organized as it was reported by Masduqi (2010), Masduqi, et al. (2008), Yuliani dan Rahdriawan (2015).
The role of organization and organization regulation on water use is not written yet. It is therefore, there is no price differentiation for users (whether for family or commercial use, big or small users). Method of handling problem is not yet formulated, hence ad hoc solution is mostly applied.
initiative was still individual based, until CSR Program of Danamon Bank started to assist this facility for hamlet, instead of individual.
At present, to be a member of water service, each family must pay installation fee with the price ranging from Rp 323,000 to Rp 877,686, and average Rp 589,595. This installation fee was used for constructing and providing facilities to family. However, there is no clear information on the use of this fee.
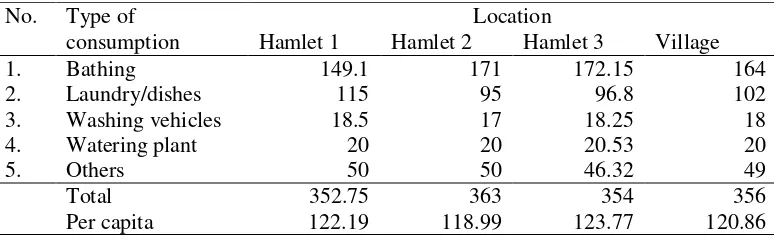
Water use for each family is categorized into the followings: (a) bathing, (2) dishes and laundry, (3) watering plants, (4) washing vehicles (motorbike), and (5) others. Volume of consumption of each family is varied depending upon number or size of the family. The following table describes the distribution of water consumption in the study sites. Tabel 3. Water consumption of respondent families (l/day)
No. Type of
Overall, average water consumption per day is 356 lt/day where the lowest consumption was in Hamlet 1 and the highest was in Hamlet 2. The highest water consumption was for family bathing and the lowest for washing vehicles.
The consumption of water per capita was then from 119 to 123 liter per day. That number was lower than the national average of water consumption which was about 144 liter per day (Dirjen Cipta Karya, 2014). But, that number was above requirement of daily water needs for village resident which was 90 lt/day/capita. In addition, that number match with water consumption recommended in Standar Nasional Indonesia (SNI).
Supply of water or water discharge to the families are varied from 500 to 2000 liter per day, with average of 1485 liter per day. This means that there is daily over supply of water as much as 1135 liter per day per family because family daily consumption was merely 350 liter. That surpluses has not been tapped albeit very potential for fish pond Study by Abidin (2011), fish pond contributes to the additional income of around 8% of family income in Way Besai, West Lampung.
3.2.4 Consumer surpluses
Consumer surpluses in this study is measured by differentiating price of water at village to PDAM price and then multipled by daily water supply. As a member, each respondent family pays around Rp 4,600 or around Rp 156/day. This means that the price of water per liter was merely Rp 0.13 per liter. As comparison, the price of water set by PDAM
(benchmark) was Rp 2.8 /lt. Using that number, the study suggest that daily consumer surplus was Rp 3,905 per day or Rp 1,405,998 annually.
However, as most water was wasted to local drainage, the potential of consumer surplus was not tapped by family. Around Rp 1,017,720 or 79% per year of consumer surplus was drained untapped.
Several factors that couse this lost, i.e.: (1) ecosystem services mostly is still
undervalued as also the case in other upland region in Lampung, (2) water service charge to community is too low as though it is free services, (3) there is no faucet/tap that regulate flow of water, and (4) there is no downstream use water.
3.2.5 Response to the service
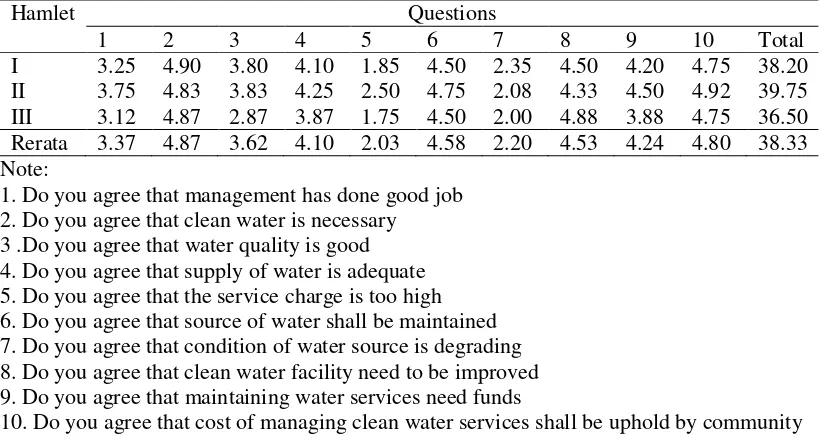
In connection to community based clean water services, respondent is asked their respond on (a) quality of services, (b) necessity of water services, (c) water quality, (d) quantity of water/supply, (e) price of services, and (f) water conservation. The respond is recorded in Likert scale ranging from 1 (strongly disagree) to 5 (strongly agree). The summary of the respond is presented in the following table.
Table 4. Response of respondent to community based clean water service
Hamlet Questions
1 2 3 4 5 6 7 8 9 10 Total
I 3.25 4.90 3.80 4.10 1.85 4.50 2.35 4.50 4.20 4.75 38.20 II 3.75 4.83 3.83 4.25 2.50 4.75 2.08 4.33 4.50 4.92 39.75 III 3.12 4.87 2.87 3.87 1.75 4.50 2.00 4.88 3.88 4.75 36.50 Rerata 3.37 4.87 3.62 4.10 2.03 4.58 2.20 4.53 4.24 4.80 38.33 Note:
1. Do you agree that management has done good job 2. Do you agree that clean water is necessary 3 .Do you agree that water quality is good 4. Do you agree that supply of water is adequate 5. Do you agree that the service charge is too high 6. Do you agree that source of water shall be maintained 7. Do you agree that condition of water source is degrading 8. Do you agree that clean water facility need to be improved 9. Do you agree that maintaining water services need funds
10. Do you agree that cost of managing clean water services shall be uphold by community
The table suggests that in terms of the work performance of organization, the score is moderate. Some respondents provides low mark and high mark on the performance.
However, the majority of respondent notes that the performance of management is moderate. When asked about the necessity of clean water, almost all respondent strongly agree on the issue. It is suggesting that water is crucial for family’s livelihood and providing challenge to management of clean water service to perform well.
In terms of water qualitaty, the respond was mostly moderate to low suggesting that the quality of water they received is sometimes not good. The respondent explained that water is often not crystal clear especially during rainy season.
In terms of water supply, most respondent strongly agrees that the water supply is adequate for their family. This respond is consistent with data of excess supply discussed earlier in this paper.
Concerning service charge, most respondent disagree if it is too high. Their thought that the price is relatively low. In interview, they are willing to pay more if the service is improved.
In terms of condition of source of water, most respondent disagree that the condition was deterioting. They argued that the condition of water sources were well maintained and the forest condition is still protected.
In terms of condition of water facility, most respondent agrees that they need to be improved. Type of improvement they sought such as putting filter on the check dam, improvement on distribution box, as well as replacement of old pipes. Respondent was also suggesting that they willing to pay more should improvement is implemented
In terms of facility maintenaning water service, most respondent agrees that it requires some funds. However, the number of funds need to be discussed with village, hamlet leader, and management.
Finally, in terms of community responsibility in paying the cost of services, most respondent strongly agrees that it shall be borned by community together.
3.2.6 Willingness to Pay (WTP)
The study also investigate community’s WTP should the water services facilities are improved. The study team discussed with respondent type of improvement they thought necessary, i.e.: provision of tap/faucet, improvement of water quality, and better maintenance with better facilities.
The study suggests that the community is willing to pay more than they currently paid for services. Currently, the monthly services is from Rp 15,000 to Rp 100,000 annually with average of Rp 55,200 annually.
If the facility improved, respondent is willing to increase payment up to 10% in Hamlet 1, 20-30% in Hamlet 2, 10-20% in Hamlet 3 from current payment. On average, the
community is willing to add payment up to 25% from current payment.
This information suggests that the management of clean water services is facing serious challenge in order to respond members perception on water services.
4.
Conclusion
The study summarizes the following conclusion.
1. Consumer surplus from community based clean water services was relatively high and has helped poor family on upland region in the study site. However, that surplus was not tapped efficiently as most of it was drained and unused
2. Respond of community is generally positive in various aspects. It is concluded community is willing to pay more if clean water service is improved.
3. Community is willing to participate in order to conserve water sources as they thought this service is necessary for their livelihoods.
4. Improvement of water utilization fish pond or for horticulture crops is deemed prospective.
References
Abidin, Z. 2011. Valuasi Jasa Air Bersih Berbasis Masyarakat di Sub-DAS Way Besai, Kabupaten Lampung Barat. Disertasi. Program Pascasarjana Universitas Padjadjaran. Bandung.
Bappenas. 2011. Report on The Achievement of Millenium Development Goals, Indonesia 2010. Jakarta.
________. 2015. Sekretariat Sustainable Development Goals. Jakarta
Barbier E.B. 1991. Economics, Natural Resources, Scarcity and Development. London. Earthscan.
Direktorat Jenderal Ciptakarya.2011. http://www.pamsimas.org/?/. Diakses pada tanggal 25 Mei 2015.
Hardin, G. 1968. The Tragedy of The Common. Science,162(1968):1243-1248.
Hufschmidt, M.M., D.E. James, A.D. Meister, B. T. Bower, and J.A. Dixon. 1983. Environment, natural systems, and development: an economic valuation guide.The John Hopkins University Press, Baltimore.
Isaac, S. and Michael, W.B. 1995. Handbook in Research and Evaluation. San Diego: EdITS Masduqi. A. 2010. Keberlanjutan Sistem Penyediaan Air Bersih Perpipaan di Pedesaan. Power
Point Disertasi S3 ITS. Surabaya.
___________., N. Endah, and E.S. Soedjono. 2008. Sistem Penyediaan Air Bersih Perdesaan Berbasis Masyarakat: Studi Kasus HIPPAM di DAS Brantas Bagian Hilir. Seminar Nasional Pascasarjana VIII – ITS, Surabaya 13 Agustus 2008. ISBN No.978-979-96565-4-4
Murniati, K., Z. Abidin, S. Widjaya. 2016. Analisis Manfaat Ekonomi Pengelolaan Sumberdaya Air Bersih Berbasis Masyarakat di Taman Hutan Raya Wan Abdul Rachman, Desa Talang Mulya, Kecamatan Teluk Pandan, Kabupaten Pesawaran. Laporan Penelitian. Fakultas Pertanian Universitas Lampung
Ostrom, E. 1999. Self Governement and forest Resources. Occasional Paper No. 20. Center for Research on Agroforestry, Bogor
________. 2000. Collective Action and the Evolution of Social Norms. The Journal of Economic Perspectives, Vol. 14. No. 3. (Summer, 2000), pp. 137-158