Abstract— PT Barata Indonesia (Persero) is one of leading metal works company in Indonesia. It has 3 main business line which are engineering procurement and construction (EPC),
industrial tools manufacturing, and foundry. As the company’s
strategic objective in delivering quality product and service to the customer, PT Barata Indonesia should maintain their production process properly. One of the featured product of PT Barata Indonesia is bogie. The production process of bogie shows a fluctuative delivery fulfillment. It can be proved by the contract amendment information. Risk management can be used as the method to manage risk inside the production process of bogie. Therefore, this research is aimed to identify risks that may occur from each activities of bogie S2HD-9C’s production process. The risk identification is done by using fault tree analysis method in order to determine the root cause of each activity performed. The risk evaluation is done by using FMEA method which can classify the effects of failure based on the severity and occurrence of failure. Then continue to the risk mapping and risk mitigation determination for bogie S2HD-9C’s production process. Loss that caused by the emergence of risk also determined using value at risk method. Moreover, risk profile dashboard will be provided as the tools in managing risk.
Keywords—Fault Tree Analysis (FTA), FMEA, Production Process, Risk Dashboard, Risk Management, Risk Map, Risk Mitigation, Value at Risk
I. INTRODUCTION
PT Barata Indonesia is one of the government company in Indonesia which has 3 main business line. There are, engineering procurement and construction (EPC), industrial tools manufacturing, and foundry (PT. Barata Indonesia, 2013). Some products of PT Barata Indonesia are, bogie, mill roll, pipeline, road rollers, storage tank, and also ball tank.
PT Barata Indonesia is a leading bogie supplier in Indonesia with 100% local demand fulfillment. Moreover, PT Barata Indonesia penetrated United States market with 1,500 bogie
delivered since 2012. Bogie’s supply both local and worldwide
shows a positive trend. This condition forced PT Barata Indonesia to maintain the commitments to give a competitive service in terms of quality, price, and delivery (PT. Barata Indonesia, 2013).
As the company’s strategic objective in delivering quality
product and service to the customer, PT Barata Indonesia
should maintain their production process properly. Moreover, quality and service of product should be addressed as
company’s competitive advantage in order to compete in the
global market. Competitive advantage that brings higher income to the company can be fulfilled with organization of production, higher application, and as low as possible production costs (Wang, Lin, & Chu, 2011).
In fact, PT Barata Indonesia currently facing some obstacles
regarding to the company’s strategic objective. The production
process of PT Barata Indonesia cannot achieve zero defect production. Although the order of product is the same, the completion of product still not good enough. It can be proved by the number of contract amendment information. Both machineries used and people also made some contribution to the production condition. For example, some of the machines inside the workshop needs several preventive maintenance to maintain its condition. Unfortunately, the worker who has responsibility to maintain the machine were not doing their job. Because of that, some of the machines used broken down. Moreover, the equipments used for the production of bogie is less sophisticated and the production planning is not good enough. So, that condition make the probability of delivery lateness become higher.
This condition makes the company have to reschedule their completion date of product and make some amendment for the contracts with the customer. In the middle of 2015, PT Barata Indonesia have established commercial and risk bureau whom
responsible to company’s risk management. Unfortunately, there were no risk assessment performed on bogie S2HD-9C’s production process. Usually the production department makes a small notes for every defects occurred on each batch of production. But there were no further analysis or assessment in order to handle any possibilities of risk.
Risk might be a driver of strategic decisions because of its uncertainty (Institute of Risk Management, 2010). The strategic decisions made by a company will determine the achievement of their strategic objectives in the future. PT Barata Indonesia need to understand the risk that embedded inside their company in order to achieve their objectives. Risk management can be used as the method to understand and anticipate risk inside the company. The focus of risk management is the assessment of significant risks and the implementation of suitable risk treatments (Institute of Risk Management, 2010). By implementing risk management PT Barata Indonesia will be
Risk Mapping of Bogie S2HD-9C Production
Process that Take Effect on Production
Fulfillment at PT. Barata Indonesia (Persero)
Faza Yoshio Susanto, Naning Aranti Wessiani, ST, MM
Department of Industrial Engineering, Faculty of Industrial Technology, Institut Teknologi Sepuluh
Nopember (ITS)
Jl. Arief Rahman Hakim, Surabaya 60111 Indonesia
able to increase the probability of achieving objectives, improve minimize losses, and prevent the risks to be occurred again in the future.
Based on previous explanation, this research is aimed to identify risks that may occur from each activities of bogie S2HD-9C’s production process. The risk identification is done by using fault tree analysis method in order to determine the root cause of each activity performed. The risk evaluation is done by using FMEA method which can classify the effects of failure based on the severity and occurrence of failure. Then continue to the risk mapping and risk mitigation determination for bogie S2HD-9C’s production process. In order to make the risk monitoring activity easier, this research will provide risk profile dashboard as one of the research output by using macro excel software. With the output of this research, PT Barata Indonesia are expected to minimize the risk that occurred in bogie S2HD-9C’s production process
II. RESEARCHMETHODOLOGY
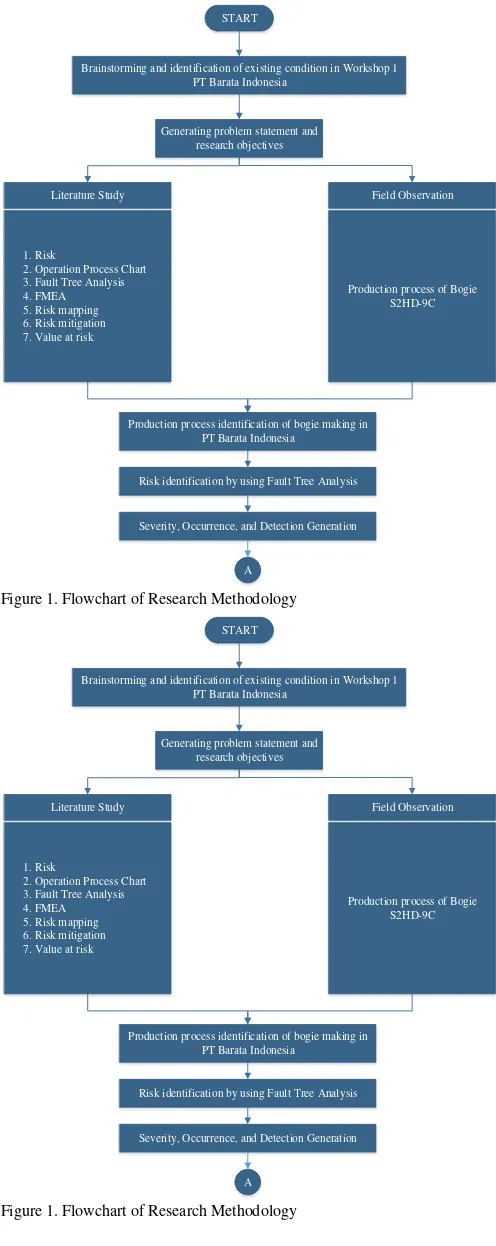
A. Brainstorming and Initial Identification Stage
Initial identification stage consists of brainstorming and identification of existing condition in workshop 1 PT Barata Indonesia, accompanied by responsible division in workshop 1 which is Industry Division. So the objective of this research can be obtained which is developing the risk mapping of Bogie S2HD-9C’s production process.
1. Data Collection Stage
Data collection stage is done by conducting interviews,
reviewing company’s data, and also questionnaire. All of the
data obtained will be used as the input of risk mapping construction of Bogie S2HD-9C’s production process
2. Data Processing Stage
The data processing stage will be done through the completion of several process such as, questionnaire validation, risk evaluation by using FMEA method, risk mapping, risk mitigation, value at risk, and develop risk profile dashboard. 3. Analysis Stage
In this stage, the analysis and data interpretation activity will be done. This stage will be based on the result of data processing stage. Several data analysis that will be conducted are, production process analysis, risk analysis, risk assessment analysis, risk mapping analysis, mitigation analysis, dashboard analysis, and value at risk analysis.
4. Conclusion Stage
In this stage, the conclusion and suggestion will be determined. The given conclusion and suggestion will be based on data analysis and interpretation which has been done before. Conclusion will answer the objectives of research and the suggestion will be given for the company and further research.
START
Brainstorming and identification of existing condition in Workshop 1 PT Barata Indonesia
Generating problem statement and research objectives
Production process identification of bogie making in PT Barata Indonesia
Risk identification by using Fault Tree Analysis
A
Severity, Occurrence, and Detection Generation Literature Study
Production process of Bogie S2HD-9C
Figure 1. Flowchart of Research Methodology
START
Brainstorming and identification of existing condition in Workshop 1 PT Barata Indonesia
Generating problem statement and research objectives
Production process identification of bogie making in PT Barata Indonesia
Risk identification by using Fault Tree Analysis
A
Severity, Occurrence, and Detection Generation Literature Study
Production process of Bogie S2HD-9C
III. DATACOLLECTIONANDPROCESSING A. Production Process Identification
The first stage that need to be done is determine the production process of Bogie S2HD-9C. The production process will be determined using Operation Process Chart (OPC) method.
B. Risk Identification and Assessment
Risk identification process will be done by using Fault Tree Analysis (FTA) method. The risk will be identified from each activities performed. Then each risk will be assessed by using FMEA method.
Figure 2. Production Process Identification
Cutting &
Figure 2. Production Process Identification (con’t)
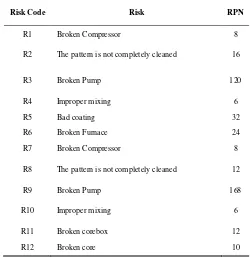
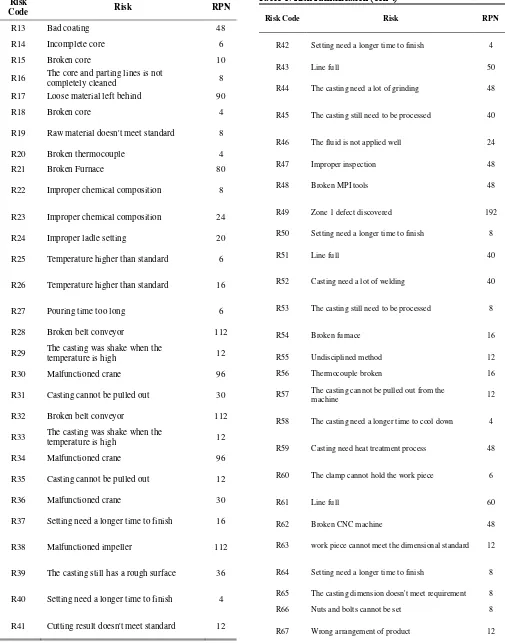
Table 1. Risk Identification
Risk Code Risk RPN
R1 Broken Compressor 8
R2 The pattern is not completely cleaned 16
R3 Broken Pump 120
R4 Improper mixing 6
R5 Bad coating 32
R6 Broken Furnace 24
R7 Broken Compressor 8
R8 The pattern is not completely cleaned 12
R9 Broken Pump 168
R10 Improper mixing 6
R11 Broken corebox 12
Table 1. Risk Identification (con’t)
Risk
Code Risk RPN
R13 Bad coating 48
R14 Incomplete core 6
R15 Broken core 10
R16 The core and parting lines is not
completely cleaned 8 R17 Loose material left behind 90
R18 Broken core 4
R19 Raw material doesn't meet standard 8
R20 Broken thermocouple 4
R21 Broken Furnace 80
R22 Improper chemical composition 8
R23 Improper chemical composition 24
R24 Improper ladle setting 20
R25 Temperature higher than standard 6
R26 Temperature higher than standard 16
R27 Pouring time too long 6
R28 Broken belt conveyor 112
R29 The casting was shake when the
temperature is high 12
R30 Malfunctioned crane 96
R31 Casting cannot be pulled out 30
R32 Broken belt conveyor 112
R33 The casting was shake when the
temperature is high 12
R34 Malfunctioned crane 96
R35 Casting cannot be pulled out 12
R36 Malfunctioned crane 30
R37 Setting need a longer time to finish 16
R38 Malfunctioned impeller 112
R39 The casting still has a rough surface 36
R40 Setting need a longer time to finish 4
R41 Cutting result doesn't meet standard 12
Table 1. Risk Identification (con’t)
Risk Code Risk RPN
R42 Setting need a longer time to finish 4
R43 Line full 50
R44 The casting need a lot of grinding 48
R45 The casting still need to be processed 40
R46 The fluid is not applied well 24
R47 Improper inspection 48
R48 Broken MPI tools 48
R49 Zone 1 defect discovered 192
R50 Setting need a longer time to finish 8
R51 Line full 40
R52 Casting need a lot of welding 40
R53 The casting still need to be processed 8
R54 Broken furnace 16
R55 Undisciplined method 12
R56 Thermocouple broken 16
R57 The casting cannot be pulled out from the
machine 12
R58 The casting need a longer time to cool down 4
R59 Casting need heat treatment process 48
R60 The clamp cannot hold the work piece 6
R61 Line full 60
R62 Broken CNC machine 48
R63 work piece cannot meet the dimensional standard 12
R64 Setting need a longer time to finish 8
R65 The casting dimension doesn't meet requirement 8
R66 Nuts and bolts cannot be set 8
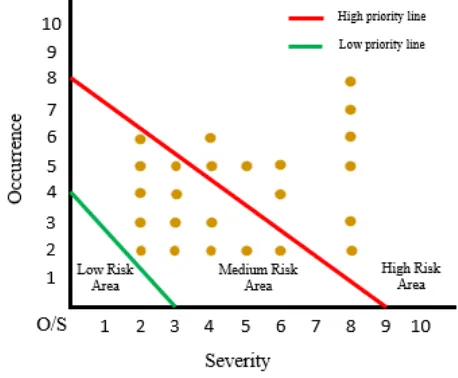
C. Risk Mapping
After the risk already identified and assessed by using FMEA method, then all of the risk will be plotted into risk map in order to determine the classification of risk based on its category. There are three categories such as, high risk, medium risk, and low risk.
The result of risk map is 45 medium risk and 22 high risk. Next, the risk with category high risk will get a corrective action or mitigation in order to manage the risk
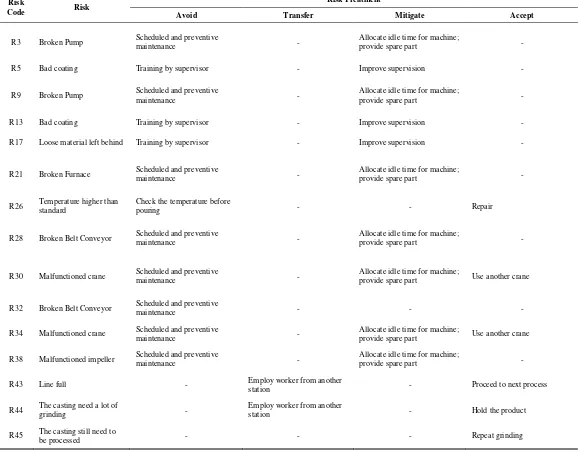
D. RiskMitigation
The risk mitigation is the way to manage the risk in order to reduce the probability of risk occurred. There are four classification of risk mitigation such as, avoid, transfer, mitigate, and accept. There are 15 avoid risk, 4 transfer risk, 13 mitigate risk, and 13 accept risk.
E. Value at Risk
Value at Risk is the way to develop the loss caused by the emergence of risk. In the calculation process, there will be several data needed such as, lateness time data, repair cost data, and also electricity cost data. Using the 95% confidence interval, the probability of loss will be obtained.
F. Risk Profile Dashboard
After the loss calculation already performed, the risk profile dashboard will be constructed. Risk profile dashboard is aimed to help PT Barata Indonesia to manage the risk embedded in production process of Bogie. There are several functions that can be accessed through the dashboard such as, risk database, risk assessment, risk mitigation, risk updating, and loss calculation. The construction of risk profile dashboard will use Microsoft Excel Software.
IV. CONCLUSION/SUMMARY
There are 67 identified risk of bogie S2HD-9C production process. First thing to do is conducting risk assessment by using FMEA method. Then each risk will be evaluated based on the RPN number. The highest RPN number was obtained from R49 which is zone 1 defect discovered with 192 and lowest RPN number was obtained from R58 which is casting need a longer time to cooldown with 4. There are 22 risk which categorized as high risk and the rest of the risk are categorized as medium risk. Risk mitigation is addressed to the high category risk. Based on the mitigation effort determination proportion, there are 15 avoid effort, 13 mitigate effort, 13 accept effort, and 4 transfer effort.
Value at Risk is done by using variance-covariance method. There are 12 high risk that calculated from 21 high risk identified. Based on the calculation result the highest loss caused by the emergence of risk occurred in R61 which is line full in machining process with the amount of Rp 1,038,504. Meanwhile, the lowest value of loss caused by the emergence of risk occurred in R45 which is casting still need to be processed in grinding process with Rp 55,805.
V. ENCLOSURE Figure 3. Risk Map
Table 2. Simulation Result
Code Risk Loss
R13 Bad coating VaR @ Rp 429,778
R17 Loose material left behind VaR @ Rp 156,224
R26 Temperature higher than standard VaR @ Rp 193,200
R43 Line full VaR @ Rp 260,912
R44 The casting need a lot of grinding VaR @ Rp 216,247
R45 The casting still need to be processed VaR @ Rp 55,805
R47 Improper inspection VaR @ Rp 215,891
R49 Zone 1 defect discovered VaR @ Rp 461,706
R51 Line full VaR @ Rp 482,307
R52 Casting need a lot of welding VaR @ Rp 452,010
Table 2. Simulation Result (con’t)
Code Risk Loss
R59 Casting need heat treatment process VaR @ Rp 519,998
R61 Line full VaR @ Rp 1,038,504
Figure 5. Manager Login
Figure 6. Supervisor Login
Figure 7. Risk Database
Figure 8. Risk Assessment
Figure 9. Risk Mitigation
Figure 10. Risk Update
Table 3. Risk Mitigation
Risk
Code Risk
Risk Treatment
Avoid Transfer Mitigate Accept
R3 Broken Pump Scheduled and preventive
maintenance -
Allocate idle time for machine;
provide spare part -
R5 Bad coating Training by supervisor - Improve supervision -
R9 Broken Pump Scheduled and preventive
maintenance -
Allocate idle time for machine;
provide spare part -
R13 Bad coating Training by supervisor - Improve supervision -
R17 Loose material left behind Training by supervisor - Improve supervision -
R21 Broken Furnace Scheduled and preventive
maintenance -
Allocate idle time for machine;
provide spare part -
R26 Temperature higher than standard
Check the temperature before
pouring - - Repair
R28 Broken Belt Conveyor Scheduled and preventive
maintenance -
Allocate idle time for machine;
provide spare part -
R30 Malfunctioned crane Scheduled and preventive
maintenance -
Allocate idle time for machine;
provide spare part Use another crane
R32 Broken Belt Conveyor Scheduled and preventive
maintenance - - -
R34 Malfunctioned crane Scheduled and preventive
maintenance -
Allocate idle time for machine;
provide spare part Use another crane
R38 Malfunctioned impeller Scheduled and preventive
maintenance -
Allocate idle time for machine;
provide spare part -
R43 Line full - Employ worker from another
station - Proceed to next process
R44 The casting need a lot of
grinding -
Employ worker from another
station - Hold the product
R45 The casting still need to
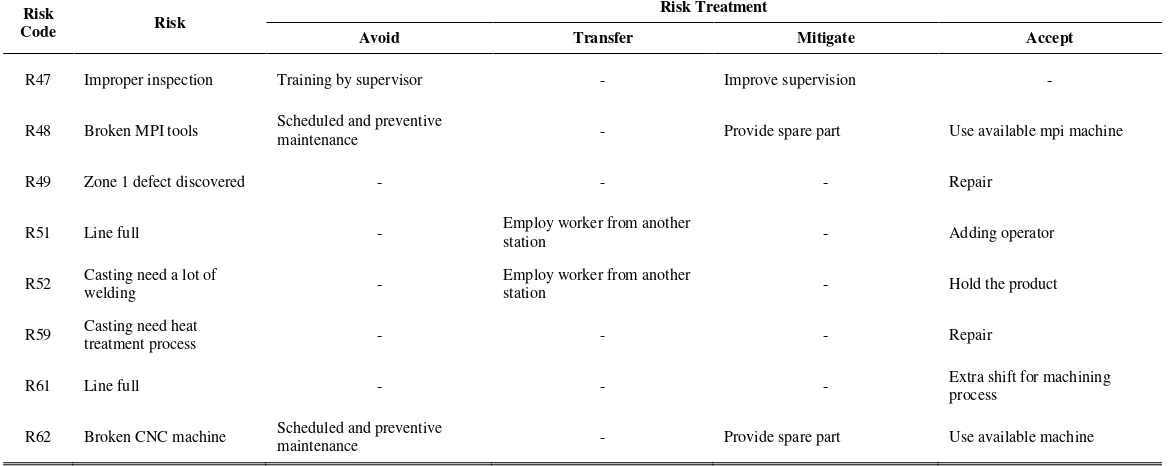
Table 3. Risk Mitigation (con’t)
Risk
Code Risk
Risk Treatment
Avoid Transfer Mitigate Accept
R47 Improper inspection Training by supervisor - Improve supervision -
R48 Broken MPI tools Scheduled and preventive
maintenance - Provide spare part Use available mpi machine
R49 Zone 1 defect discovered - - - Repair
R51 Line full - Employ worker from another station - Adding operator
R52 Casting need a lot of
welding -
Employ worker from another
station - Hold the product
R59 Casting need heat
treatment process - - - Repair
R61 Line full - - - Extra shift for machining
process
DAFTAR PUSTAKA
[1] PT. Barata Indonesia, "PT. Barata Indonesia," 2013. [Online]. Available: www.barata.co.id.
[2] Institute of Risk Management, "A structured approach to Enterprise Risk Management (ERM) and the requirements of ISO 31000," Institute of Risk Management, London, 2010.
[3] P. S. A. R. Angga Adiperdana, "Analisis Value at Risk Menggunakan Metode Extreme Value Theory - Generalized Pareto DIstribution dengan Kombinasi Algoritma Meboot dan Teori Samad-Khan (Studi Kasus PT. X)," Industrial Engineering Department ITS, Surabaya, 2010.
[4] M. Anityasari and N. A. Wessiani, Analisa Kelayakan Usaha, Surabaya: Guna Widya, 2011.
[5] C. S. Carlson, Effective FMEAs: Achieving Safe, Reliable, and Economical Products and Processes using Failure Mode and Effects Analysis, John Wiley & Sons, 2012.
[6] C. S. Carlson, "Understanding and Applying the Fundamentals of FMEAs," in Annual Reliability and Maintainability Symposium, Tucson, 2014.
[7] Z. Fabók, "Fault Tree Analysis," 9 September 2013.
[Online]. Available:
http://zsoltfabok.com/blog/2013/09/fault-tree-analysis/. [8] A. M. Haifani, "Manajemen Resiko Bencana Gempa
Bumi (Studi Kasus Gempa Bumi Yogyakarta 27 Mei 2006)," in Seminar Nasional IV SDM Teknologi Nuklir, Yogyakarta, 2008.
[9] G. Monahan, Enterprise Risk Management: A Methodology for Achieving Strategic Objectives, Canada: John Wiley & Sons, Inc., 2008.
[10] S. O. Sarwoko, "Designing Fuzzy FMEA Risk Management at Production Department PT. Charoen Pokphand Tbk - Poultry Feed Krian, Sidoarjo," Institut Teknologi Sepuluh Nopember, Surabaya, 2015.
[11] N. R. Utami, "Penyusunan Peta Risiko dalam Upaya Pengembangan Risiko pada PT. Telkomsel," Institut Teknologi Sepuluh Nopember, Surabaya, 2014.
[12] W.-C. Wang, C.-H. Lin and Y.-C. Chu, "Types of Competitive Advantage and Analysis," International Journal of Business and Management, pp. 100-104, 2011. [13] Chrysler Corporation, Ford Motor Company, General
Motors Corporation, Potential Failure Mode and Effects Analysis (FMEA) Reference Manual, Automotive Industry Action Group, 1993.
[14] D. Hillson, S. Grimaldi and C. Rafele, "Managing Project Risk Using a Cross Risk Breakdown Matrix," Risk Management, pp. 61-76, 2006.
[15] H. R. A. Nugroho, "Reduksi Waste dan Peningkatan Kualitas pada Proses Produksi Roll Gilingan Tebu dengan Pendekatan Metodologi Lean Six Sigma (Studi Kasus : PT Barata Indonesia, Gresik)," Institut Teknologi Sepuluh Nopember, Surabaya, 2014.
[16] D. R. Pramudita, "Perancangan dan Pengukuran Kinerja Lingkungan dengan Pendekatan Integrated Environment Performance Measurement System (IEPMS) di PT Barata Indonesia," Institut Teknologi Sepuluh Nopember, Surabaya, 2014.