THE RISK LEVEL OF PRODUCTION AND PRICE OF RED
CHILI FARMING IN KEDIRI REGENCY, EAST JAVA
PROVINCE, INDONESIA
Nining Hariyani
1*, Djoko Koestiono
2, A. Wahib Muhaimin
21
Department of Socio-Economics, Faculty of Agriculture, University of Brawijaya Malang, Indonesia
2
Lecturer of Socio-Economics Department, Faculty of Agriculture, University of Brawijaya Malang, Indonesia
*corresponding author: [email protected]
ABSTRACT: The purposes of this research are to analyze production and price risk level of red chili farming
especially on dry land in off-season. Data are collected through interview to 47 farmers who grow red chili on dry
land during the rainy season. The research results show that price risk level is higher than production risk level. Coefficient of variation (CV) of Chili price is 0.32 and the CV of chili production is 0.05. The risk of price is higher than production risk level due to the fact that price is more volatile and more difficult to control by farmers. Additionally, production risk is still manageable and can be controlled by farmers through the implementation of off-season cultivation technology combining by the experience of farmers in the production. However, the total
production are still lower than the potential productivity due to the weather constraint. In order to reduce the level of production and price risk, farmers can make diversification crops to secure income. In addition, farmers must actively observe prices and make decision of their production accordingly.
Keywords: risk level, coefficient variation, red chili farming, off-season
Keywords: Innovation adoption, SRI planting system, production technology,
INTRODUCTION
Red chili (Capsicum annuum L.) is one of horticultural commodities which is potential to be developed along with onions. There are several reasons for the importance of red chili development: (a) red chili are horticultural commodities with high economic value, although the number of production and the prices are very volatile; (b) Red chili is one of the national commodities are getting serious attention from the government; (c) as a food ingredient that is widely used in Indonesian cuisine; (d) it has good export prospects and import substitution commodity; (e) it can be cultivated both in upland and wetland; (f) it absorb a lot of labor; (g) it has good strategic marketing objectives to the traditional market, modern market until processing industry.
The prices of horticulture commodities fluctuate almost each year, particularly at the beginning of the rainy season. It happens because
the red chili stock in the market is decreasing due to the less optimal production of farmers, while the consumer demand remain the same and even increase in some special occasion. This kind of situation can cause an inflation. During the rainy season, the risk of both production and price risk, is very high. Thus, the farmers are not interested to grow red chili and decided to grow another strategic commodities which has an relatively lower risk and easy to grow. This condition is feared to lead to the decreasing of planting area and the total production of red chili in all seasons. Soekartawi (1993) explain that the risk factor could cause farmers become more reluctant to expand their business because of their fear of the possibility of loss, based on the perception of the majority of farmers that risk is a consequence burdening farmers to farm (Fauziyah, 2011).
production was 83,180 kwintal/hectare with harvested area of 1.046 hectares. In 2010, it was increasing to 122,621 kwintal/hectare with harvested area 1,589 hectares. In 2011, the red chili was decreased to Rp 87,317 kwintal/hectare with harvested area 1,022 hectares. In 2012, it was increased to 133,207 kwintal/hectare and 1,485 hectare harvested area. Finally, the number of production was again decreasing to 85,591 kwintal/hectare with 1,185 hectares harvested area in 2013 (Department of Agriculture in Kediri, 2014).
According to information from the Department of Agriculture in Kediri, the production fluctuation occurs mostly due to climatic factors that led to the development of pests and use less accordance input of recommended dose. Concerns of farmers on risk conditions during the rainy season led farmers to allocating inputs inefficiently. So, it results in high production cost and reduce farm income.
Furthermore, price volatility (price risk) also became one of the risks often faced by farmers because the prices tend to be fluctuative. Based on the price data of red chili in the period of November 2014 - March 2015 on Pamenang Traditional Market Pare Kediri, on the November 2014 the average price of red chili was Rp. 44,167/ kg and it jumped on the December 2014 Rp. 61.290/ kg. Then, the price began to fall on the January 2015 Rp 33,258/ kg and then the price was decreasing on the February 2015 of Rp 11,429/kg (SISKAPERBAPO, Department of Trade and Industry East Java Province).
These data show that during the first growing season or during the rainy season (off-season), a variability of price is changing within a short time. Thus, it affects to the uncertainty of farm income. Falling prices may be due to the inclusion of products from outside the region or due to the occurence of harvest. Red chili piled on the market, resulting in a surplus that caused price fall automatically, whereas if the production deficit, the price tends to rise (Maryam, et al, 2005).
The existence of farming risk of both production risk and price risk are affecting to the uncertainty of farmers income. The higher the income is, the greater the chances of risks faced by farmers will be (Kadarsan, 1995). Production risks, particularly those coming from the climate, weather and pests are obstacles often faced by farmers and those influence on decision-making in the allocation of production factors. It can cause a gap between potential and actual productivity achieved by farmers. This gap that causes the
uncertainty of production received by farmers. If the gap is also accompanied by the price reseacher. Maryam, et.al (2005) conducted research about the economic risks of papaya varieties of Thailand and Hawaii. The research of Fariyanti, (2008) focused to the household economic behavior to face product price and production risk of vegetable agribusiness. Aini, (2014) conducted research about analysis of income and agribusiness risk of cabbage in dryland and wetland. Aldila, (2013) conducted research about analysis of factors that affect the risk of sweet corn. Saptana, (2011) conducted research about risk analysis of chili agribusiness and the behavior of farmers to face of risk. Purwoto (1993) and Fauziyah (2011) conducted researches about rice production and how to manage a risk to achieved food security in farmer household. Moreover, the research of Suprapto (2012) focused to contract and non-contract system of potato agribusiness risk.
Therefore, the research about the risk level of production and prices of red chili farming on the dry land in the off-season is interesting to be conducted. So, the farmers can make an anticipation to manage the risks that affects to the stability of income. Stable income is needed by farmers, because it relates to a production decision on the next farming activities (Suprapto, 2012). Through the above description, the purpose of this study was to analyze the level of risk in the farming production and the price of red chili in the off-season.
RESEARCH METHODS
The topography of the area has a slope 30
-450 on the slopes of Kelud Mountain which stretched from north to south by Blitar Forest.
Temperatures affect the growth of red chili start breeding until productive step. At the time of daytime temperatures in Kebonrejo Village around 260C and night 220C. Based on the desired agro -ecosystems of red chili cultivation, red chili germination process requires temperatures of 20
-240C, if the temperature is more than a
recommendation causes the germination process will be slowly. In infancy requires temperatures of 27-300C (at noon) and 18-250C (at night).
Temperatures at night when less than 150C and at
noon more than 320C, it can hinder the process of the formation of the fruit (Editors Agromedia, 2007).
High rainfall or wet climate is not very good
for red chili because it causes the loss of flower buds, flowers and fruit grow small. In addition, high humidity will stimulate the development of fungi that triggers the disease. The climate in the Village area Kebonrejo classified as type C climate (the climate is wet) with the characteristics of winter and dry summer, because of the characteristics of the air temperature and the climate in this region is very fit and support to red chili cultivation, especially out of season.
The total area of Kebonrejo Village is 434.83 hectares, with the composition of the dry land area of 288.54 hectares, yard and residential area is 136.79 hectare and others covering area is 9.5 hectares for village roads and public facilities. Through the proficiency level of data it can be concluded that the average farmland in the village of Kebonrejo is classified as dry land (Monography of Kebonrejo Village, 2014).
In addition to the red chili, farmers are also many other commercial cultivation of horticultural crops, such as onions, small chili, tomatoes, eggplants, cucumbers, beans, papaya,
cabbage, onion vegetables, yam and others. Description of horticultural commodities in Kebonrejo Village based on the acreage can be The six farmer groups in the Kebonrejo village are
Tani Jaya, Tani Makmur, Harapan Jaya, Tambak through interviews directly to the respondent by using a question list that prepared with the
research purpose. Secondary data is
complementary or supporting data obtained from various sources and government documents and
non-governmental, scientific journals and
reference books that have related with the topic of research.
Table 1. Horticulture Commodity Description Based on the acreage in the Kebonrejo
Source: Monography of Kebonrejo Village, 2014
Analysis the risk level in this research are included in the quantitative research which introduces the Hernanto theory (1993) and Kadarsan (1995) with production and price risk approach. Quantitative research can be calculate by expected value of the results as an probability indicator of investment and the variance size (variance) and standard deviation (standard deviation) as an indicator of risk.(Ichsa, 1998, in average production (kg/ha), price (Rp/kg) formulated as follows (Hernanto, 1993):
∑
Keterangan:
farmers' income. According to Patrick et.al (1985) that the main source of risk is the uncertainty of the weather, pests and plant diseases (risk of production), followed by output price volatility (price risk), and then, according to Soekartawi (1993) which states that an important source of uncertainty in the agricultural sector is the fluctuation of agricultural products and price fluctuations.
In order to measure the level of risk, this study used variance measure (variance) and standard deviation (standard deviation). Risk in this case is the wide of production fluctuation and prices, so the larger of fluctuations can give the uncertainty and greater risk. Here is the formula of variance (Hernanto, 1993):
∑
Information: V2 : variance
Q : average production (kg/ha), price (Rp/kg)
Qi : production (kg), the price of the i (Rp/kg)
i : respondents
n : number of respondents
While the standard deviation is the root of the variance (Hernanto, 1993), are:
√
Information:
V : standart deviation V2 : variance
3) The risk level or Coefficient of Variation (CV)
The coefficient of variation is the ratio between the risks to be borne by farmers with the amount of profits/revenues to be derived as a result of the amount of capital invested during the production process (Kadarsan, 1995). The greater value of variation coefficient, indicating that the risk of the farmers is greater than the revenue received. Variation coefficient of a price data within a certain time can describe fluctuations (standard deviation of the average), which is used to determine the stability of the price of a commodity.When the coefficient of variation is getting smaller, it can be interpreted
that the prices are relatively stable or has a low fluctuation (Rachman, 2005).
The formula of coefficient of variation (Hernanto, 1993) are:
CV = V / Q Information:
CV : coefficient of variation V : standard deviation
Q : average production(kg/ha), price (Rp/kg)
4) Lower Limit (L)
The lower limit (L) is the lowest average value that may be received by the farmer. If the value of L is greather or equal to 0 (zero), then the farmers will avoid losses. In the opposite, when the value of L is less than 0 (zero), then there is an opportunity in the process of farming losses. The formula lower limit or the lowest value that may be received by farmers, are:
L = Q - 2V
Information: L : lower limit
Q : average production (kg / ha), price (Rp/kg) V : standard deviation
Based on the above formula, it may be obtained relationship between the limit value is below average with a coefficient of variation of the following:
- If the CV value ≤ 0.5 or L ≥ 0, then the farmers to avoid loss
- If the value of CV> 0.5 or L <0, then the farmer has the opportunity to experience a loss (Hernanto, 1993).
RESULTS AND DISCUSSION
Analysis of the level of risk in this study using the production approach and prices including the further analysis of variation coefficient, identifying lower limit of production as well.
1) Analysis of Risk Level of Production
higher risk and effect on farmers' income. The farmers receive production fluctuates widely from the first until the last harvest. The highest
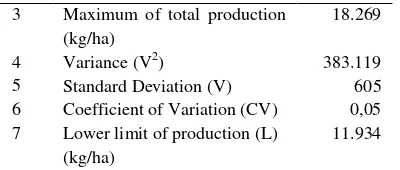
Figure 1. Graph of Average Red Chili Production The product fluctuation by many farmers caused the climatic factors and weather in the rainy season, so the yield is less than optimal. The total average production is 13 tons/hectareless than the total productivity in 2014 amounted to 17 tons/hectare (Monography of Kebonrejo Village, 2014). Based on the information of farmers, its caused by the disease or that called “patek” or anthraknose which often attack due to rainfall and high humidity environments. Anthracnose attacks the fruit up to 10-30% and if severe damage losses could reach 100%. The results of the analysis of the risk level of red chili pepper farm production can be seen in Table 2.
Based on the data analysis obtained, the average value of the variation coefficient is 0.05
<0.5 (CV ≤0.5). It means that farmers are Analysis of Chili Production
No Analysis Value
1 Average production (Q)(kg/ha) 6 Coefficient of Variation (CV) 0,05 7 Lower limit of production (L)
(kg/ha)
11.934
Source: Processed Data, 2016.
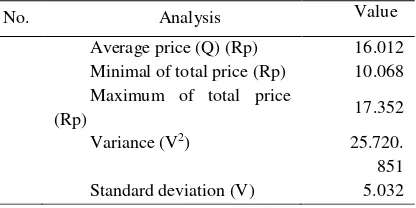
2) The Analysis of Risk Level Price
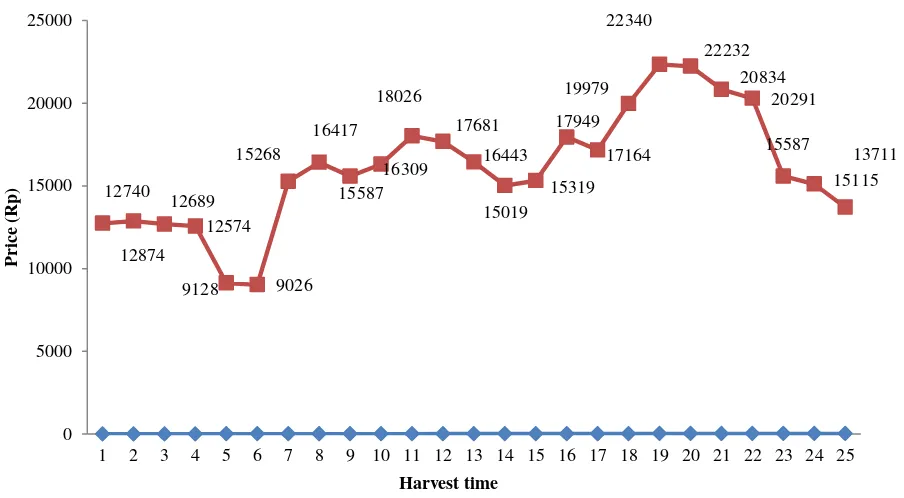
Red chili prices in the research area from harvest season which occurs between December 2015 until February 2016 average price received by farmers is Rp.16.000, -/kg. The highest price obtained by farmers at 19th harvest that occurred around the month of February 2016 amounted to Rp. 22 340/kg and the lowest price at 6th harvest which occurred about a month in December 2015 amounted to Rp. 9000,-/ kg. In addition, from price fluctuations show that the price changes occur in a short time so the farmer is difficult to predict it. That will impact on income uncertainty. It is caused due to the quality and quantity of production is difficult to control and easy to change, so the price of agriculture products is unstable (Nasaruddin, 2000).
As the production risk level measurement, analysis of variance and standard deviation is used to determine the coefficient of variation (CV) on the level of price risk occurring in a growing season. The detail about analysis of price risk levels presented in the table 3.
Based on the data analysis, the value of variation coefficient is 0.32 <0.5 (CV ≤0,5), it means that the price fluctuation, the farmer still be able to avoid making losses. Lower limit of price (L) is lower than the average price that received by farmers (Q). This is show that farmers obtain a fair price for their farming.
Table 3. Average prices and risk level of chili price
No. Analysis Value
1 Average price (Q) (Rp) 16.012 2 Minimal of total price (Rp) 10.068 3 Maximum of total price
(Rp) 17.352
4 Variance (V2) 25.720.
851 5 Standard deviation (V) 5.032
6 Coefficient of variation
(CV) 0,32
7 Lower limit of price (L)
(Rp/ha) 5.949
Figure 2. Graph of Average Red Chili Price
The low level of price risk caused the location of the red chili farming in the Kepung district near to the commodities market of red chili in Pare Kediri, so the farmer easy to get the information about red chili prices. In the other hand, the institutional role is supportive to give price information.
When farmers want to be active in farmers group activities and join the Asosiasi Agribisnis Cabai Indonesia (AACI), they are easier to obtain information related to red chili acreage that can be taken into consideration when determining the appropriate planting. But not all of farmers want to be active in AACI activities, so that access to acreage and pricing information is only transmitted orally uneven among farmers and growers received. However, indirectly the red chili farmers 'associations in the region of the red chili pepper development centers can improve farmers' bargaining power against red chili commodities on the market. So the farmer still get a high price for their product during rainy season.
Furthermore, when we compared between production and price risk, the risk level of production is lower than the level of price risk for production KV value <KV prices (0.05 <0.32). It
shows that sources of risk arising from the price factor is higher than climatic factors (production
risk). Sources of external risk derived from price factors more difficult to control and predict the farmer rather than climate factors that can still be controlled by the farmers through the application of red pepper cultivation in the off-season despite not yet optimal production results.
Climatic factors on the cultivation of off-season (rainy off-season) is very influential on the decline peasant production. high rainfall intensity triggering conditions of high humidity and fungi easier to grow. In order to control pests and plant diseases, as long as the farmer spraying pesticide is either there or not there is an pests or plant diseases attack. This was due to concerns of farmers against the risk of production, causing farmers no longer rational in the use of pesticides, mostly 95% or 45 farmers to mix pesticides with a view to preventing and deadly pest, so that even though the quantity of fruit can be secured, but in quality is not fulfill the food safety standards.
Based on the concept of integrated pest management (IPM), when spraying to avoid pest and plant disease is excess, it can cause increase immunity to pests and diseases, killing natural
12740
12874 12689
12574
9128 9026 15268
16417
15587 16309 18026
17681
16443
15019 15319
17949
17164 19979
22340
22232
20834 20291
15587
15115 13711
0 5000 10000 15000 20000 25000
1 2 3 4 5 6 7 8 9 10 11 12 13 14 15 16 17 18 19 20 21 22 23 24 25
Pric
e
(Rp
)
enemies and increasing the content of residues harmful to consumers, so that monitoring and intensive take cares is better than treating plants that have been hurt. Pesticides should be the last alternative if less effective non-chemical control (Redaksi Agromedia, 2007). In the end, although the level of risk of production is not likely to suffer losses, but the effect on farmers production decrease up to 23%. If that things is continue, it will cause a decrease in revenue.
CONCLUSION
The risk level of production and prices in the off- farming season show the coefficient of variation less than 0.5 (CV ≤0,5), it means through the red chili farming in the off-season, the farmer still be able to avoid making losses because the average farmer's expected results higher than the lower limit value (L) that may be received by farmers in order not to experience losses. Therefore, through the red chili farming during the rainy season to support farmers' income is relatively stable. But the high level of production during the rainy season led to a decline in production of 23% of the potential productivity in the study area. it should be anticipated by making efforts to secure the production and income of farmers.
Price risk level higher than production risk
level. Its because price risk is more difficult and can’t
controlled by the farmer, but the production risk still can controlled by the farmer. Production risks is manageable by farmers through the application of red chili cultivation technologies in the off-season to increase the amount of production according to the potential productivity of farmers, but the use of chemical pesticides should be reduced by controlling more environmentally friendly, for example by natural pesticides from plants. In addition, in order to anticipate the risk level of farming can be done through the implementation of crop diversification that called tumpangsari, so there is variation in the production of the land area that can secure production
and could save farmer’s income at-risk conditions. When one of the production fails, then the production can be obtained from other commodities.
Risks related with the uncertainty that caused by the lack or unavailability of information about what is going to happen. Although in terms of prices farmers are protected from losses, but their price risks must remain a concern of farmers because the price level is difficult to control and predict. The price can change in a short period of time, therefore it need price information from farmers' associations as well
as from relevant agencies such as the Department of Trade and Industry through the Market Information Officer. Then, the farmers must also play an active role to obtain information not only about prices but also acreage of chili in its territory. If more farmers planting red chili at the same time it can be predicted to occur harvest that causes the price decline. So the price and acreage information can be taken into consideration for the farmer to determine the proper planting time in order to support farm income.
REFERENCE
Anonim. 2015. Sistem Informasi dan Perkembangan Harga Bahan Pokok di Jawa Timur. Dinas Perindustrian dan Perdagangan Provinsi Jawa Timur. Surabaya.
Anonim. 2014. Kediri dalam Angka Katalog BPS11020013506. Badan Pusat Statistik Kabupaten Kediri.
Fauziyah, E. 2011. Manajemen Risiko Usahatani Padi Sebagai Salah Satu Upaya Dalam Mewujudkan Ketahanan Pangan Rumahtangga Petani. Fakultas Pertanian.Universitas Trunojoyo Madura.
Hernanto, F. 1993. Ilmu usahatani. Penebar Swadaya, Jakarta.
Kadarsan, H. W. 1995. Keuangan Pertanian dan Pembiayaan perusahaan Agribisnis. Gramedia Pustaka Utama. Jakarta.
Maryam, S. dan Suprapti. 2005. Studi Banding Risiko Ekonomi Usahatani Pepaya Varietas Thailand dan Hawaii. Jurnal Studi Ekonomi Pertanian, Volume 5 Nomor 1:8-15, Agustus 2008.
Nasaruddin. 2000. Ekonomi produksi.Universitas Terbuka, Jakarta.
Patrick, G.R., P.H. Wilson, P.J. Barry, W.G. Bogges and D.K. You. 1985. Risk Perception and Management Response: Producer Generated Hypotheses for Risk Modelling. Southern Journal Agricultural Economics, 41:231- 238.
Rachman, Handewi. 2005. Metode Analisis Harga Pangan. Disampaikan pada Apresiasi Distribusi Pangan dan Harga Pangan oleh Badan Ketahanan Pangan.Departemen Pertanian, Bogor.
Shinta, Agustina. 2011. Diktat Ilmu Usahatani. Fakultas Pertanian Universitas Brawijaya. UB Press. Malang.
Soekartawi, 1993. Agribisnis, Teori dan Aplikasinya. Raja Grafindo Persada. Jakarta.