Does Summarization
Help Stock
Prediction? A News
Impact Analysis
Xiaodong Li, City University of Hong Kong
Haoran Xie, Caritas Institute of Higher Education
Yangqiu Song, University of Illinois at Urbana-Champaign
Shanfeng Zhu, Fudan University
Qing Li, City University of Hong Kong
Fu Lee Wang, Caritas Institute of Higher Education
Evaluations at
individual stock,
sector index, and
market index levels
show that prediction
based on news article
summaries can
effectively outperform
prediction based on
full-length articles
with both validation
and independent
testing sets.
they’ve helped investors make better decisions.1–4
Nevertheless, news articles can include noise along with useful points of informa-tion: they’re free-style textual documents in nature, after all. Summarization, a process that extracts information from the docu-ments and filters noise that might distract reader focus, is a good value-add candidate for prediction enhancement.
In this article, we apply a sentence-level summarization model to daily full-length news article summarizations for stock price prediction (see the related sidebar for oth-ers’ work). We first build a generic stock
price prediction framework that takes textual documents as inputs and generates predicted price movements as outputs. Next, we con-struct the news article summaries and feed the framework with either the summarized or the full-length articles. Then, we compare predic-tion performance for these two different in-formation sets. We conducted experiments on five-year Hong Kong Stock exchange data, together with news data reported by Finet (www.finet.hk/mainsite/index.htm). We performed our evaluations at the individ-ual stock, sector index, and market index lev-els; our results show that prediction based on news article summarizations can effectively
I
nvestors in the stock market strive for better profits by analyzing
mar-ket information. Financial news—a major source of such information—is
increasing tremendously both in its volume and broadcasting speed.
Mod-els that make predictions based on news articles have been proposed, and
outperform prediction based on full-length articles in both validation and independent testing sets.
Summarization Model
Link information between entities is valuable in information retrieval.5,6
Our Self-Present Sentence Relevance (SPSR) summarization model con-structs the latent relevance structure among sentences as link informa-tion, stating that a link between two sentences has a mutual emphasis ef-fect—potential key sentences are em-phasized more in the model and thus gain higher scores for further sum-marization.7 SPSR is defined as a
sex-tet, 〈T, V, F, E, W, S〉, where
• T= {ti | ti is a term (element) in the
corpus}. T is the term space consist-ing of all the words in the corpus after duplicates are eliminated.
• V = {vj | vj = {tk}, tk ∈ T}. vj
rep-resents a sentence in the document constituted by a set of terms.
• F= {fij | fij is a term frequency of ti
in vj, ti∈T, vj∈V}. ||vj|| denotes the
normalized sentence length, that is,
∑
= ∈
v f
|| j|| t v
ij2
i j
.
• E= {eij | eij is an edge between
verti-ces vi and vj, vi, vj∈V}. Between any
two nodes, an edge is constructed. If there’s no relevance between the nodes, the edge is removed. It’s an undirected graph, so eij=eji.
• W= {wij | wij represents the
signifi-cance value of vertex ei, ei∈E}.
Rel-evance weight could be measured in various proximities, such as city-block and Euclidean distance. In the SPSR model, the distance measure is declared as an abstract function that’s further implemented with
concrete distance measures in eval-uation experiments.
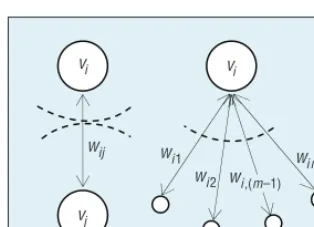
• S = {si|si represents the significance
value of vertex vi, vi∈V}. The
sig-nificance value represents the sum of how much contribution vertex vi
makes to the weight of its connected edges. The more contribution vi
makes, the greater value si will have,
so sentence i will be regarded as more important. As Figure 1 shows, the significance value of vertex vi is
generated iteratively by splitting the weight wij of the edge between vi
and vj and then summing up all the
pieces of weight obtained from the edges connecting to vi.
The recursive formula for calculat-ing significance value si in the n + 1
iteration is defined by
= + = =
+
sin s c n, 0,1, ..., s 1/ |V|,
in i i
1 0 (1)
E
rized as either supervised or unsupervised. Taking the summarization as a binary classification problem, supervised approaches classify sentences as either in-sum-mary or not-in-sumin-sum-mary. Although the assumption that the sentences are independent of each other simplifies the modeling, the information of sentence relevance is lost. Un-supervised approaches cluster sentences into groups by using clustering algorithms, and the most central ones are then selected to construct the summary.For example, MEAD (www.summarization.com/mead), a platform designed for multilingual summarization, ranks sentences by their features, such as cluster centroids, posi-tion, and so on. Gong and Liu’s work applied Latent Semantic Analysis (LSA) to summarization, where hidden topic features are employed in the analysis. Instead of sentence score,1
whereas Erkan and Radev (LexPageRank) used a PageRank-like method to let sentences vote and recommend each other.2 The main perspectives that people prioritize for
sum-marization quality are readability, relevance, diversity, cover-age, and distortion, which are integrated in the widely used standard summarization evaluation package ROUGE (Recall-Oriented Understudy for Gisting Evaluation)3 and testing
datasets DUC (Document Understanding Conferences). Stock price predictions based on news articles have been studied by many researchers. Following a text-mining meth-odology, Seo and his colleagues built a multi-agent system for intelligent portfolio management that can assess the risk associated with companies by analyzing related news
tem, built by Robert Schumaker and Hsinchun Chen, applies SVMs (support vector machines) to intraday stock price pre-diction. They first use a regression model to estimate future 20-minute price levels and then convert those price levels into two-class directional prediction. MSE (mean square error) and accuracy are the metrics they used to evaluate their system.
Although there are many other related studies in this do-main, to the best of our knowledge, no work applies sum-marization to improve stock price prediction performance.
References
1. Y. Gong and X. Liu, “Generic Text Summarization Using Rel-evance Measure and Latent Semantic Analysis,” Proc. 24th Ann. Int’l ACM SIGIR Conf. Research and Development in Information Retrieval, 2001, pp. 19–25.
2. G. Erkan and D.R. Radev, “Lexrank: Graph-Based Lexical Central-ity as Salience in Text Summarization,” J. Artificial Intelligence Research, vol. 22, 2004, pp. 457–479.
3. C.-Y. Lin and E. Hovy, “Automatic Evaluation of Summaries Using n-Gram Co-occurrence Statistics,” Proc. 2003 Conf. North American Chapter Assoc. Computational Linguistics on Human Language Technology, vol. 1. 2003, pp. 71–78.
4. Y.-W. Seo, J. Giampapa, and K. Sycara, “Financial News Analy-sis for Intelligent Portfolio Management,” tech. report CMU-RI-TR-04-04, Robotics Inst., Carnegie Mellon Univ., Jan. 2004. 5. R.P. Schumaker and H. Chen, “Textual Analysis of Stock Market
P R E D I C T I V E A N A L Y T I C S
where n is the index of iteration. All the sentences are equally weighted at iteration 0; ci denotes the
contribu-tion value of vertex vi to those edges
connecting to it. Equation 2 defines
how the edge weights are split and how to generate sentence contribu-tion value:
which indicates that tk appears more
frequently in vi, the larger the part of
wij that vi will obtain. We define σ( )sin in Equation 3, which aims to normal-ize the significance value of node vi in
ization is localized, which indicates that si is normalized only by those
vertices connected by edges with non-zero weight.
Algorithm 1 (see Figure 2) illus-trates the detailed steps for construct-ing the SPSR model—the input is the collection of preprocessed documents, and the output is a vector containing the significance value of each sentence correspondingly.
The convergence of Algorithm 1 is proved elsewhere.7 Iteration number
N is determined by the corpus. After generating sentence significance val-ues, the final summary is derived by selecting the top-k highest scored sen-tences. In our experiments, for each trading day, the summary is built on the daily news articles once before be-ing fed into the framework for stock prediction.
News Impact Analysis
Before we introduce the prediction framework, we first need to describe the datasets we used in the empirical analysis.
Dataset
Because it’s a major financial news vendor in Hong Kong, we used a news archive from Finet in our experiments. The English news archive we used in-cludes both news about a specific company and the whole market from 1 January 2003 to 31 March 2008. Each piece of news is labeled with a time stamp showing the released time, which helps separate news by dates (articles after the market close of the previous trading day and before the market close of the current trading day are grouped into one trading day). Any companies related to a news ar-ticle are indicated via their stock sym-bols, which assist us in constructing the mapping relationship from the news articles to stocks, and vice versa.
We looked at stocks on the Hang Seng Index (HSI) that are actively traded in four areas: commerce, fi-nance, real estate (or properties, as the HSI refers to this category), and utili-ties. Because of the tyranny of the index effect, which is the price movement of newly added index constituents (usu-ally, this movement isn’t rational and the commodity is mispriced during the first few months),8 we eliminate stocks
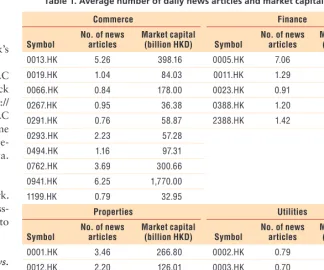
added to the HSI after our dataset’s starting date (1 January 2003). The fi-nal stock universe contains 22 stock symbols, with each sector having 10, 5, 4, and 3 stocks, respectively.
For the stocks in this universe, we calculated the average number of re-lated daily news articles, along with their market capital figures, as Table 1 shows. The correlation between the number of news articles and mar-ket capital is high (corr = 0.8484), indicating that the larger the stock’s
vi
Figure 1. Sentence vi’s significance. We generate this value by splitting weight wij and then summing up all the pieces
w relevance v v
n N
market capital, the greater the stock’s news coverage.
We obtained all the daily OHLC (Open, High, Low, and Close stock prices) from Yahoo Finance (http:// finance.yahoo.com). The daily OHLC data and news data share the same period. Next, we review how we pre-process the daily news and price data.
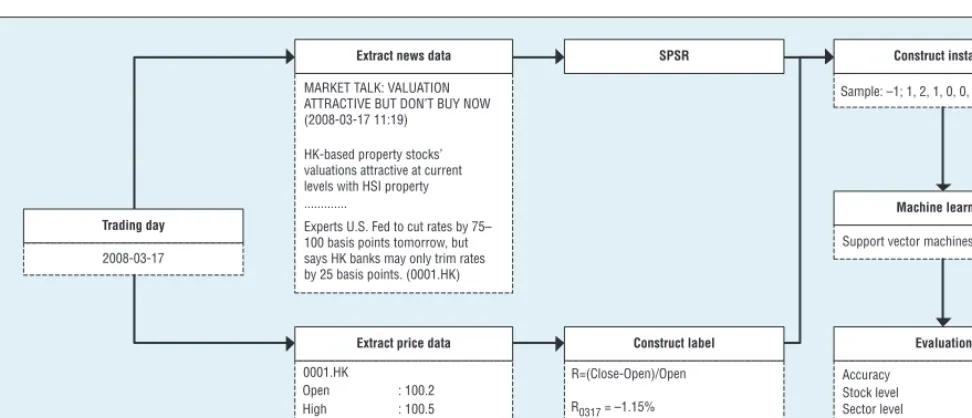
The Generic Workflow
Figure 3 shows our generic framework. Let’s look more closely at preprocess-ing the prices and news, and how to construct the instances and labels.
Preprocessing daily prices and news.
For a trading day, we select Open and Close prices for all the stocks. We consider the daily Open-to-Close price return as the ground truth label in the prediction, that is,
= −
R Close Open
Open . (4)
The reason why we take Open-to-Close return rather than Open-to- Close-to-Close return as the prediction label is because of the T+ 0 mechanism. The Hong Kong market uses a T+ 0 trade instead of T+ N. (T + 0 means that investors can buy and sell the same equity several times within the same trading day.) It’s widely agreed that market-related news is reflected in the Close price. Moreover, quantitative traders don’t want to carry inventory after the market closes and possibly suffer from overnight risk.
SPSR processes the daily news articles related to a stock by using Algorithm 1 to generate the signifi-cance value of each sentence, where iteration N is set to 50 to ensure that |sin+1−sin| 0.00001< . Then, it
se-lects the top-10 scored sentences to form the summary, where the length of the summary is limited to 250 words. After that, it uses bag- of-words preprocessing to translate the
summaries into a vector of numbers by counting each word’s TF IDF (for term-frequency× inverse-document-frequency); all the vectors form a ma-trix of instances that are further fed into the machine learning model (such as the SVM used in our experiment).
Labeling. The daily Open-to-Close return is further classified into three categories by two symmetric thresh-olds (denoted as q) that are around zero. The prediction label is therefore defined as follows: different q values later.
Learning and evaluation. With the in-stances and labels generated, we use a popular text classification learn-ing model, support vector machines (SVMs), to train on the preprocessed datasets. We use accuracy (acc) to
evaluate the prediction performance, which is formally defined as
acc t t t
Experiment Results and Discussion
Now that we’ve described some of the background, we can move into a description of our experiment setup, the labeling method we used, and our test results in various scenarios.
Experiment Setup
In the experiment, we set up a family of approaches using news summaries. The abstract function defined in SPSR {wij}
is implemented with different distance measures (see Table 3 for a full list).
We also set up a baseline approach that uses full-length news articles
0013.HK 5.26 398.16 0005.HK 7.06 1,630.00
0019.HK 1.04 84.03 0011.HK 1.29 242.44
0066.HK 0.84 178.00 0023.HK 0.91 73.36
0267.HK 0.95 36.38 0388.HK 1.20 149.56
0291.HK 0.76 58.87 2388.HK 1.42 263.27
0293.HK 2.23 57.28
0001.HK 3.46 266.80 0002.HK 0.79 159.39
0012.HK 2.20 126.01 0003.HK 0.70 175.14
0016.HK 3.03 273.24 0006.HK 0.53 142.34
P R E D I C T I V E A N A L Y T I C S
(FULL-L), where the news articles aren’t summarized but are directly processed by the bag-of-words ap-proach and fed into the framework
We split the news and price datasets into three parts along the time hori-zon: from 1 January 2003 to 31 De-cember 2005 is the training dataset; from 1 January 2006 to 31 Decem-ber 2006 is the validation data-set; and from 1 January 2007 to 31 March 2008 is the independent test-ing dataset.
The SVM parameters are tuned dur-ing the traindur-ing and validation phases; we keep the best combination of pa-rameters for the independent testing phase, specifically, the RBF kernel. We adopt a grid search method parame-ters that searches in a 2D space, g∈
{0.0001, 0.001, 0.01, 0.1, 1, 10, 100, 1,000, 10,000} and C∈ {1, 3, 5, 7, 9, 11, 13, 15, 17, 19} for a total 9 × 10 = 90 combinations to determine the best combination of g and C.
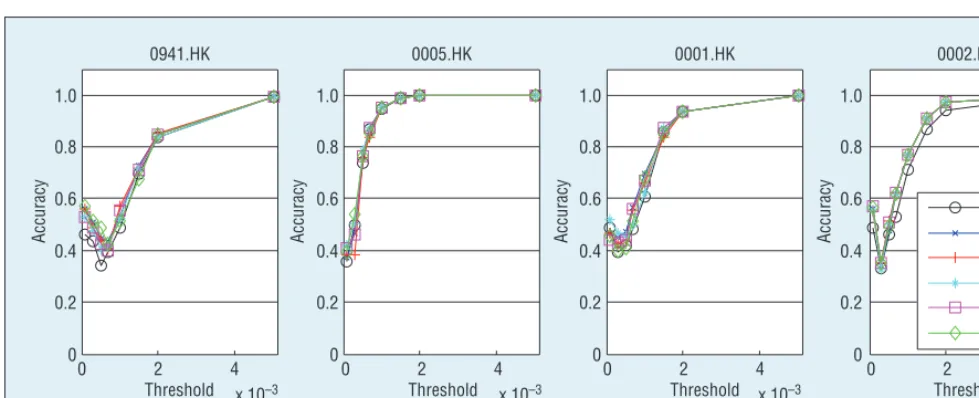
Threshold in Labeling Method
We used different values of q in the experiments, selecting four stocks with the largest weight in each sector; Figure 4 shows the acc results along with the change in q.
The curves in Figure 4 represent an upside-down sine function shape con-sisting of two parts: when the value of q is small, the curve represents a U-shape; when the value of q becomes great, the curve is similar to y =x0.5.
Moreover, we observed these patterns across various stocks.
Figure 4 details the reason for this ob-servation: we assumed the distribution of the stock price Open-to-Close return to be Gaussian distribution (with a fat tail, which could be neglected in this
explanation). Suppose an arbitrary value is selected for q, and we denote the corresponding return value by a in the figure. The true labels of negative, neutral, and positive would have the following prior probabilities:
Given the aforementioned label dis-tribution without any extra learning, a random draw for predictions could be conducted based on the prior distribution. The accuracy of this method can be calculated by
= − + + +
acc P21 P02 P21. (11)
Because a and −a are symmetric around 0,
P−1=P+1, and P0= 1 − 2P+1, (12)
substitute Equation 12 into Equation 11, and let P denote P+1. Equation 11
then becomes
acc= 6P2− 4P+ 1. (13) Trading day
Extract price data Construct label
0001.HK
Open : 100.2
R=(Close-Open)/Open
Label is negative (–1) R0317 = –1.15%
Extract news data SPSR Construct instance
Machine learning
Evaluation Support vector machines (SVMs)
Accuracy
ATTRACTIVE BUT DON’T BUY NOW (2008-03-17 11:19)
HK-based property stocks’ valuations attractive at current levels with HSI property
Experts U.S. Fed to cut rates by 75– 100 basis points tomorrow, but says HK banks may only trim rates by 25 basis points. (0001.HK) ...
2008-03-17
Figure 3. Architecture of our generic framework. The framework preprocesses news and prices separately, and then constructs instances that are further fed into the prediction model.
Table 2. The definition of symbols in acc.
Predict + Predict 0 Predict
-True + t++ f+0 f+−
True 0 f0+ t00 f0−
True − f−+ f−0 t−−
Table 3. Formulae of distance measures.
If we draw the chart of acc by vary-ing a, we obtain Figure 5b, where the curve has the upside-down shape like a sine function. The minimum value at P= 1/3 is equivalent to flipping a coin, and acc increases with varying
a on the right-hand side of the mini-mum, indicating that most of the sam-ples are labeled with neutral and that the probability of a correct guess is high when the value of q is great. That is to say, without change the learning model, we can increase the accuracy simply by manipulating the labeling.
Due to the effect explained in Fig-ure 5b, the threshold q can’t be set too large—doing so will arbitrarily bring an unnecessary increment to acc. However, q can’t be too small, as
q should be at least the basic market transaction cost in the Hong Kong market—that is, 0.003 (30 basepoints [bps]). By balancing both constraints, we select q= 0.005 (50 bps), which is near the minimal value on the curve.
Individual Stock Level Comparison
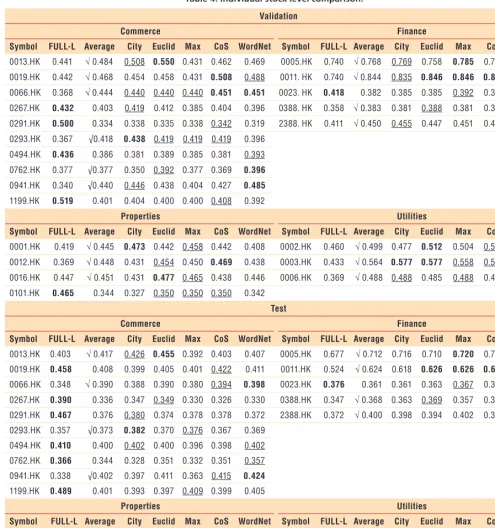
Table 4 shows the accuracy in both validation and independent testing for all the stocks. The best performer is marked in bold, and the second best is
underlined. From the validation set, we can see that SPSR approaches achieve 20 of the best results and 30 of the sec-ond-best results (including ties), com-pared with the six best results achieved by FULL-L. In the independent testing set, SPSR approaches achieve 17 of the best results and 25 of the second-best results, whereas FULL-L has eight of
the best results. The “Average” column shows the average value of five SPSR approaches; numbers with “√” indicate that the average value is better than FULL-L for that stock. SPSR has more “√” than FULL-L in both validation and independent testing datasets.
To further compare the performance of the approaches at the individual 0.8
0.6
0.4
0.2
Accuracy Accuracy Accuracy
0
0.8
0.6
0.4
0.2
0
0.8
0.6
0.4
0.2
0
Accuracy
0.8
0.6
BoW City Euclid Max CoS WordNet 0.4
0.2
0
0 2 4
Threshold
(a) (b) (c) (d)
x 10–3
0 2 4
Threshold x 10–3
0 2 4
Threshold x 10–3
0 2 4
Threshold x 10–3
Figure 4. Accuracy changes along with the threshold: (a) 0941.HK is from the commerce sector; (b) 0005.HK is from finance; (c) 0001.HK is from the properties sector; and (d) 0002.HK is from utilities. The curves represent an upside-down sine function shape consisting of two parts: when the value of q is small, the curve represents a U-shape; when the value of q becomes great, the curve is similar to y = x0.5.
0.40 1.0
0.9
0.8
0.7
0.6
0.5
0.4
0 0.5 1.0 1.5
α
2.0 2.5 3.0
(a) (b)
0.35
0.30
0.25
0.20
%
Accuracy
0.15
0.10
0.05
0
–4 –3 –2 –1 0 x
P–1 P
min
1 P0
1 2 3 4
P R E D I C T I V E A N A L Y T I C S
stock level, we conducted a t-test be-tween each pair using the validation and testing results and recorded the p-value in Table 5. The p-value that’s less than 0.05 is marked in bold font.
As you can see, approaches with SPSR summarization significantly outper-form the FULL-L. On the other hand, among the SPSR approaches, the per-formance differences are insignificant.
FULL-L outperforms SPSR ap-proaches in some stocks, especially when the stocks in question had fewer numbers of news articles listed in Table 1. This is because SPSR
Table 4. Individual stock level comparison.*
Validation
Commerce Finance
Symbol FULL-L Average City Euclid Max CoS WordNet Symbol FULL-L Average City Euclid Max CoS WordNet
0013.HK 0.441 √ 0.484 0.508 0.550 0.431 0.462 0.469 0005.HK 0.740 √ 0.768 0.769 0.758 0.785 0.765 0.765
0019.HK 0.442 √ 0.468 0.454 0.458 0.431 0.508 0.488 0011. HK 0.740 √ 0.844 0.835 0.846 0.846 0.846 0.846
0066.HK 0.368 √ 0.444 0.440 0.440 0.440 0.451 0.451 0023. HK 0.418 0.382 0.385 0.385 0.392 0.377 0.373
0267.HK 0.432 0.403 0.419 0.412 0.385 0.404 0.396 0388. HK 0.358 √ 0.383 0.381 0.388 0.381 0.373 0.392
0291.HK 0.500 0.334 0.338 0.335 0.338 0.342 0.319 2388. HK 0.411 √ 0.450 0.455 0.447 0.451 0.432 0.463
0293.HK 0.367 √0.418 0.438 0.419 0.419 0.419 0.396
0494.HK 0.436 0.386 0.381 0.389 0.385 0.381 0.393
0762.HK 0.377 √0.377 0.350 0.392 0.377 0.369 0.396
0941.HK 0.340 √0.440 0.446 0.438 0.404 0.427 0.485
1199.HK 0.519 0.401 0.404 0.400 0.400 0.408 0.392
Properties Utilities
Symbol FULL-L Average City Euclid Max CoS WordNet Symbol FULL-L Average City Euclid Max CoS WordNet
0001.HK 0.419 √ 0.445 0.473 0.442 0.458 0.442 0.408 0002.HK 0.460 √ 0.499 0.477 0.512 0.504 0.508 0.492
0012.HK 0.369 √ 0.448 0.431 0.454 0.450 0.469 0.438 0003.HK 0.433 √ 0.564 0.577 0.577 0.558 0.558 0.550
0016.HK 0.447 √ 0.451 0.431 0.477 0.465 0.438 0.446 0006.HK 0.369 √ 0.488 0.488 0.485 0.488 0.481 0.496
0101.HK 0.465 0.344 0.327 0.350 0.350 0.350 0.342
Test
Commerce Finance
Symbol FULL-L Average City Euclid Max CoS WordNet Symbol FULL-L Average City Euclid Max CoS WordNet
0013.HK 0.403 √ 0.417 0.426 0.455 0.392 0.403 0.407 0005.HK 0.677 √ 0.712 0.716 0.710 0.720 0.704 0.712
0019.HK 0.458 0.408 0.399 0.405 0.401 0.422 0.411 0011.HK 0.524 √ 0.624 0.618 0.626 0.626 0.626 0.626
0066.HK 0.348 √ 0.390 0.388 0.390 0.380 0.394 0.398 0023.HK 0.376 0.361 0.361 0.363 0.367 0.359 0.357
0267.HK 0.390 0.336 0.347 0.349 0.330 0.326 0.330 0388.HK 0.347 √ 0.368 0.363 0.369 0.357 0.363 0.388
0291.HK 0.467 0.376 0.380 0.374 0.378 0.378 0.372 2388.HK 0.372 √ 0.400 0.398 0.394 0.402 0.394 0.412
0293.HK 0.357 √0.373 0.382 0.370 0.376 0.367 0.369
0494.HK 0.410 0.400 0.402 0.400 0.396 0.398 0.402
0762.HK 0.366 0.344 0.328 0.351 0.332 0.351 0.357
0941.HK 0.338 √0.402 0.397 0.411 0.363 0.415 0.424
1199.HK 0.489 0.401 0.393 0.397 0.409 0.399 0.405
Properties Utilities
Symbol FULL-L Average City Euclid Max CoS WordNet Symbol FULL-L Average City Euclid Max CoS WordNet
0001.HK 0.371 √ 0.402 0.397 0.390 0.420 0.413 0.392 0002.HK 0.435 √ 0.448 0.436 0.455 0.453 0.457 0.441
0012.HK 0.372 √ 0.403 0.376 0.397 0.403 0.409 0.428 0003.HK 0.494 √ 0.494 0.507 0.509 0.488 0.488 0.478
0016.HK 0.387 √ 0.415 0.424 0.409 0.422 0.418 0.403 0006.HK 0.352 √ 0.420 0.420 0.417 0.415 0.418 0.428
0101.HK 0.477 0.328 0.309 0.336 0.336 0.336 0.342
extracts important information that’s emphasized repeatedly. If the stock is covered in only a few pieces of news, the summary’s quality won’t be high because it can’t effectively identify key information without emphasis, losing a good chunk of information when generating SPSR. In contrast, FULL-L keeps all the words and doesn’t try to identify key information. Therefore, it doesn’t discard any sentences.
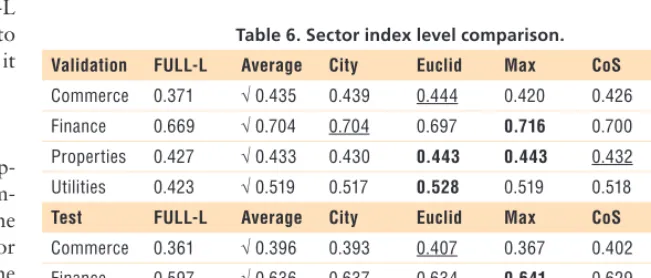
Sector Index Level Comparison
To fully investigate these various ap-proaches, we also conducted a com-parison at the sector index level. The prediction accuracy of each sector accsector is calculated by applying the
market capital vector to the accsector
vector as follows:
accsector=accstock × weightsector. (14)
Table 6 lists the results.
The approaches using SPSR largely outperform FULL-L by achieving the five best results in the validation set and the four best results in the inde-pendent testing set.
Market Index Level Comparison
To get a complete picture across the stock market, our final experiment was with the market index. We adapt the accuracy from the index level by vary-ing Equation 14 to get Equation 15: accindex= accstock × weightindex. (15)
Table 7 details the results. Being con-sistent with the stock and sector level comparisons, SPSR approaches are the best among all the approaches (SPSR with WordNet achieves the best in both validation and testing sets).
B
ringing news information into a stock prediction framework to help investors has been a trend intext mining and predictive systems. Because each step in the framework is modularized, more refinements to the current processing steps, such as using sentiment analysis in the news pre-processing to construct higher level features, could be added for enhance-ment. Moreover, more information sources could be fed into the frame-work if the machine learning model can take heterogeneous instances.
Acknowledgments
The work described in this article was substan-tially supported by a grant from the Research Grants Council of the Hong Kong Special Administrative Region, China (UGC/FDS11/ E06/14) and an Applied Research Grant by City University of Hong Kong (Project No. 9667095). The work was also partially sup-ported by the National Natural Science Foun-dation of China under Grant No 61272110.
References
1. Y.-F. Wang, “On-Demand Forecast-ing of Stock Prices UsForecast-ing a Real-Time Predictor,” IEEE Trans. Knowledge and Data Eng., vol. 15, no. 4, 2003, pp. 1033–1037.
2. P.C. Tetlock, M. Saar-Tsechansky, and S. Macskassy, “More than Words: Quantifying Language to Measure Firms’ Fundamentals,” J. Finance, vol. 63, no. 3, 2008, pp. 1437–1467.
3. R.P. Schumaker and H. Chen, “Textual Analysis of Stock Market Prediction Us-ing BreakUs-ing Financial News: The Azfin Text System,” ACM Trans. Information Systems, vol. 27, no. 2, 2009, pp. 1–19. 4. C.-Y. Yeh, C.-W. Huang, and S.-J. Lee, “A
Multiple-Kernel Support Vector Regres-sion Approach for Stock Market Price Forecasting,” Expert Systems with Appli-cations, vol. 38, 2011, pp. 2177–2186.
Table 7. Market index level comparison.
Dataset FULL-L Average City Euclid Max CoS WordNet
Validation 0.488 √ 0.537 0.538 0.540 0.529 0.530 0.547
Test 0.451 √ 0.485 0.484 0.489 0.475 0.487 0.492
City – 0.281 0.267 0.604 0.241
Euclid – 0.183 0.118 0.566
Max – 0.420 0.225
CoS – 0.202
WordNet –
* Any p-value that’s less than 0.05 is marked in bold font.
Table 6. Sector index level comparison.
Validation FULL-L Average City Euclid Max CoS WordNet
Commerce 0.371 √ 0.435 0.439 0.444 0.420 0.426 0.462
Finance 0.669 √ 0.704 0.704 0.697 0.716 0.700 0.704
Properties 0.427 √ 0.433 0.430 0.443 0.443 0.432 0.417
Utilities 0.423 √ 0.519 0.517 0.528 0.519 0.518 0.515
Test FULL-L Average City Euclid Max CoS WordNet
Commerce 0.361 √ 0.396 0.393 0.407 0.367 0.402 0.409
Finance 0.597 √ 0.636 0.637 0.634 0.641 0.629 0.638
Properties 0.392 √ 0.396 0.390 0.390 0.406 0.403 0.392
P R E D I C T I V E A N A L Y T I C S
5. D. Duan et al., “Limtopic: A Framework of Incorporating Link Based Importance into Topic Modeling,” IEEE Trans. Knowledge and Data Eng., vol. 26, no. 10, 2014, pp. 2493–2506.
6. C. Lucchese, S. Orlando, and R. Perego, “A Unifying Framework for Mining Approximate Top-(k) Binary Patterns,” IEEE Trans. Knowledge and Data Eng., vol. 26, no. 12, 2014, pp. 2900–2913.
7. X. Li et al., “Document Summarization via Self-Present Sentence Relevance Model,” Database Systems for Ad-vanced Applications, Springer, 2013, pp. 309–323.
8. J.R. Ritter, “Behavioral Finance,” Pacific-Basin Finance J., vol. 11, no. 4, 2003, pp. 429–437.
T H E A U T H O R S
Xiaodong Li is a senior manager in GTJA Trading Technology Limited, Hong Kong. His research interests include machine learning, data mining, and market microstructure. Li has a PhD in computer science from the City University of Hong Kong. Contact him at [email protected].
Haoran Xie, the corresponding author, is an assistant professor at the Caritas Institute of Higher Education. His research interests include big data, social media, recommender systems, human-computer interaction, and e-learning and financial data mining. Xie has a PhD in computer science from the City University of Hong Kong. Contact him at [email protected].
Yangqiu Song is a postdoctoral researcher at the University of Illinois at Urbana-Cham-paign. His research focuses on using machine learning and data mining to extract and infer insightful knowledge from Big Data. Song has a PhD in computer science from Tsin-ghua University, China. Contact him at [email protected].
Shanfeng Zhu is an associate professor in the School of Computer Science and the Shang-hai Key Laboratory of Intelligent Information Processing at Fudan University, ShangShang-hai, China. His research focuses on developing and applying machine learning, data mining, and algorithmic methods for bioinformatics, information retrieval, and algorithmic trad-ing. Zhu has a PhD in computer science from City University of Hong Kong. Contact him at [email protected].
Qing Li is a professor in the computer science department and director of MERC (the Multimedia Software Engineering Research Center) at City University of Hong Kong. His research interests include object modeling, multimedia databases, social media, and recommender systems. Li is a Fellow of the Institution of Engineering and Technology (IET), a senior member of IEEE, and a member of ACM SIGMOD and the IEEE Techni-cal Committee on Data Engineering. Contact him at [email protected].
Fu Lee Wang is a professor and vice president (Research and Advancement) at the Caritas Institute of Higher Education. His research interests include electronic business, informa-tion retrieval, informainforma-tion systems, and e-learning. Wang has a PhD in systems engineer-ing and engineerengineer-ing management from the Chinese University of Hong Kong. He is the past chair of the ACM Hong Kong Chapter and chair of the IEEE Hong Kong Section Computer Society Chapter. Contact him at [email protected].
Selected CS articles and columns are also available for free at http://ComputingNow.computer.org.