ISSN: 2302-9285, DOI: 10.11591/eei.v7i3.687 386
Efficient Implementation of Mean, Variance and Skewness
Statistic Formula for Image Processing Using FPGA Device
Aqwam Rosadi Kardian, Sunny Arief Sudiro, Sarifuddin Madenda STMIK Jakarta STI & K,
Jl. BRI No.17 Radio Dalam, Kebayoran Baru, Jakarta Selatan, Indonesia
Article Info ABSTRACT
Article history:
Received Sep 04, 2017 Revised May 31, 2018 Accepted Jun 14, 2018
Processing statistic formula in image processing and accessing data from memory is easy in software, the other hand for hardware implementation is more dificult considering a lot of constraint. This article proposes an implementation of optimum mean, variance and skewness formula in FGPA Device. The proposed circuit design for all formulas only need three additions component (in three accumulators) and two divisions using two shift-right-registers, two subtractors, one adder and six multipliers. For 8x8 image size need 64 clock cycles to finish the mean, variance and skewness calculations, comparing other approach that need more than 1024 additions component without skewness calculation. Implementation into FPGA needs 68 slices of flip-flops and 121 of 4 input LUTs.
Keywords:
Counter and accumulator FPGA
Mean Skewness
Variance Copyright © 2018 Institute of Advanced Engineering and Science.
All rights reserved.
Corresponding Author:
Aqwam Rosadi Kardian, STMIK Jakarta STI & K,
Jl. BRI No.17 Radio Dalam, Kebayoran Baru, Jakarta Selatan, Indonesia. Email: [email protected]
1. INTRODUCTION
Digital image processing is a proccess for manipulating and analyzing image with computer. Some image processing in computer application uses basic statistic formula such as: histogram, mean, variance, skewness, etc. These process has tight correlation with pattern recognition or texture analysis which usually recognizing the object by extracting important information from the image (image features).
Research for histogram, mean and variance calculation base on FPGA device is proposed by [1]. This article proposed a method that needs 1024 addition operations, 64 cycles, 1 division (using shift right register), no need for memory but using 256 register 8 bit for 8x8 image size. This approach consuming more than 9000 slice or logic element of FPGA. Another research for histogram calculation is proposed in [2]. This approach use RAM subcell and FSM for controlling, this approach use 850 logic element of FPGA and can work at more than 100 MHz of frequency clocks and able to process 260 frames per seconds.
Research about hardware implementation for calculating the mean and variance in an iterative manner is proposed in [3]. This approach has been realized efficiently as a hardware architecture. Instead of carrying out combinational divisions, the proposed approach distributes the divisions over several iteration steps. This enables the calculation of running statistics using simple hardware elements. This design used 111 of registers and 2934 of LUT’s. Another approach is called sum and difference histograms (SDHs) for a dense texture analysis algorithm. The implementation of this approach into a reconfigurable architecture needs 73,021 logic elements, required memory is 737,152 bits, and the number of embedded multipliers is 480 [4].
The results of comparison with the paper [9], for the histogram calculation process paper requires 320 clock cycles, while the results of this study in accordance with the above calculation requires only 64 clock cycles by producing 3 parameters, namely histogram value, mean and variance. Based on this, it is proved that using the optimization formula is a combination of histogram calculation with mean and combined histogram calculations with variance can reduce the number of clock cycles required. The speed of the process to produce histogram value outputs in the previous paper required 32μs while the process time of this study only requires 6.4 μs with the output of histogram value, mean value and variance value. The weakness of the previous paper is that it takes an additional 256 cycles to process the interface to RAM as a data storage histogram value. The amount of RAM used in the previous paper is 2Kb. The results are more clearly seen in table 1.
This article proposes a more efficient method for mean, variance and skewness value calculation of the image intensity and its implementation on a FPGA. First section describes the state of the art of the similar research. Second section is about basic statistic formula for image processing. Third section is proposed algorithm in Matlab. Fourth section is about the efficient algorithm hardware implementation using FPGA device. Final section is conclusion of this article.
2. STATISTIC FORMULA FOR IMAGE PROCESSING
2.1. Image Histogram
Frequency of the appearance every intensity value from the whole image pixel element can be drawn based on image histogram diagram. [7] [8]. Higher value of histogram show the number of pixels with that intensity value is high and vice versa. Histogram can show the brightness and contrast of the image. A lot of use histogram in image texture analysis because of the simplicity of the algorithm. Histogram of an image with NxM pixels can be calculated mathematically as :
From the histogram value we can calculate the ‘mean’ value from the image. Mathematical formula for ‘mean’ (µ) is: [7] is the higher value of grey level i. This formula will produce an average brightness of objects.
2.3. Variance Formula
is the normalized 2nd order statistical formula, these feature shows the contrast level of the image. [7]
2.4. Skewness Formula
Skewness feature is measurement for the symetri of intensity average or brightness distribution. This distribution, or data set, is symmetric if it looks the same to the left and right of the center point. [5] In mathematical formula is stated as equation (4).
distribution tented to the left of intensity average and positive value stated otherwise condition. In practice this skewness value is divided by L2 to be normalized. [7] Figure 1 show the ilustration of this histogram distribution and skewness value, which tented to left (negative skewness value) or right (positive skewness value).
Skewed left Symmectric Skewed right
One mode Bell-shape One mode
Figure 1. The ilustration of histrogram distribution and skewness [8]
3. PROPOSED ALGORITHM
Mean is the first-order and variance is the 2nd-order of statistical analysis methods used for segmentation and feature extraction processes an image. Mean represents the mean value of the intensity of the entire pixel in an image, while variance represents the image contrast, and skewness is brightness distribution. Referring to the Equations 1-4 we can derive the Equation 5-7 that is optimum formula that proposed to be implemented on the FPGA.
The pseudo code of mean calculation based on Equation 2 is showed in Pseudo Code-1. There are three steps of calculation: the first one is histogram H(i), the second one is probability p(i) and the last one is mean value. The algorithm of the mean formula in the Equation 5, optimal variance Equation 6 and skewness Equation 7 is presented in Pseudo Code-2. In this algorithm, there is just one step of calculation that has the same complexity as histogram H(i) calculation. It means that the proposed algorithm can reduce two steps of calculation (2 x 256 clock cycles) and some number of arithmetic operations e.g. addition, multiplication and division.
Pseudo code 2. Mean and variance formula (proposed version in equations 4 and 5) (1) [M,N,L]=size(f); % f is the data
(2) htsum=0; vsum=0; i3=0; skw=0;
(3) for i=1:M; % Mean calculation% (4) for j=1:N;
(5) htsum=htsum+ f(i,j); (6) vsum=vsum+( f(i,j))^2; (7) i3=i3+(f(i,j))^3; (8) end;
(9) end;
(10) optimalmean=htsum/(M*N). (11) bulatoptimalmean=fix(htsum/(M*N))
(12) varians=vsum/(M*N)-optimalmean^2 % variance 𝜎2 calculation (13) bulatvarians=fix(vsum/(M*N))-bulatoptimalmean^2
(14) skew3=i3/(M*N)-3*optimalmean*(vsum/(M*N))+2*(optimalmean^3)
(15)bulatskew=fix(i3/(M*N))-3*bulatoptimalmean*fix(vsum/(M*N))+ 2*(bulatoptimalmean^3)
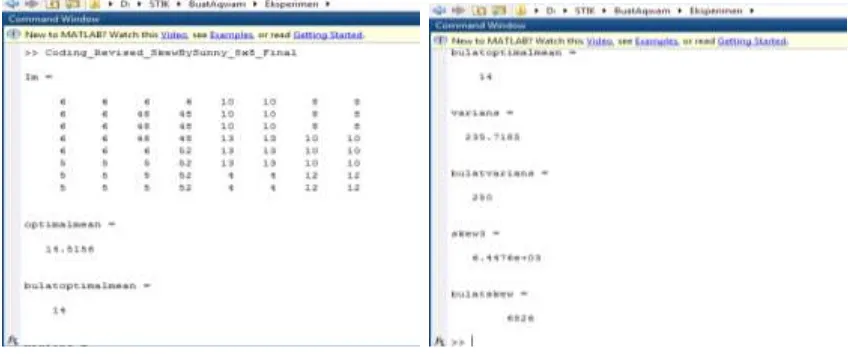
The results of mean calculation using basic algorithms and optimization algorithms for the same data (Im) are the same, as shown in Figure 2. The values resulting from the evaluation using Matlab will be used for comparison with values that are processed using FPGA components, including the value of bulatoptimalmean, bulatvarians and bulatskew that using fix value (not concerning the floating point value).
Figure 2. Results form both algorithm in Matlab with the same data
4. HARDWARE IMPLEMENTATION
(a)
(b)
Figure 3. The block diagram of component (a) reference design [1] and (b) proposed design
Figure 4 is entity diagram (component). This design is the new design based on the design in Figure 3.b. For calculating mean and variance value actually we don’t have to calculate histogram, we can directly using one accummulator to hold the total value of pixel element value (htsum) in the 2nd pseudo code. One other accumulator to hold 2nd order value of pixel element (i^2). This approach give us the reduction of mathematical operation (component). All design only need two additions in two accummulators and two shift right register, multiplier and subtractor, with the same processing time (NxM=64 clock cycles) for 8x8 image size and the same result of mean and variance value. In this design we use counter and buffer to send the final value of mean and variance after 64 clocks.
Figure 4. Component entity Selector
256 Accumulator
for i
Adder with 256 input
Shift Register
6 bit
Dn µ
256 Accumulator for
i^2
Shift Register
6 bit Adder with
256 input
5. SIMULATION RESULT
Figure 5 show the simulation result based on behavioral simulation using clock period of 100ns per cycles, this simulation shows for 70 cycles (7000ns) or 70 calculation. This figure shows the result for the same data which is 14 (mean), 250 (variance), and 6526 (skweness). Comparing to the Matlab evaluation result wich is 14,5 with the difference is 0,5 or an error of ((0,5/14)*100%=3,45 %), and 235,72 with the difference is 14,28 or an error of 6,05 % (14,28/235,72*100%). For skewness value the diferrerence is 78,4 (6526-6447,6) or an error of 1,21 % (78,4/6447,6*100%).
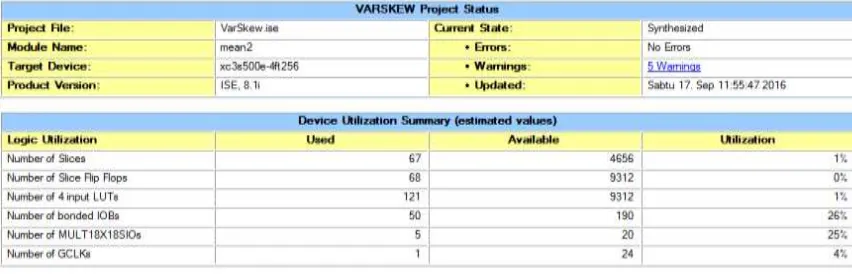
The speed of process is paralel with the comming of data input ( data in), and final result will be obtined at the end of 64 clock cycles for 64 data. From Figure 6 we can see the design summary of the component that provide the information of logic element accupation in FPGA device. If we calculate in Matlab with integer value (not concerning the floating point value) the result are exactly the same (14 for mean value, 250 for variance value and 6526 for skewness value).
Figure 5. Behavioral simulation results during 70 cycles (7000 ns)
Figure 6. Summary of logic utilization for mean, variance and skewness calculation component
Table 1. FPGA Design Summary Comparison
No. FPGA resources Previous
research [9] Previous research [1]
Proposed method 1. Number of slice NA 12461 67 2. Number of slice flip flop NA 9970 68 3. Number of LUTs NA 20157 121 4. Latency 320 clock 64 clock 64 clock 5. Number of Multiplier NA 2048 3 6. Number of Addition NA 256 1024
7. Function Histogram Histogram, mean, Varians,
Mean, Varians and Skewness
The proposed method is also capable of reducing the use of LUTs as much as 19905 LUTs. The processing time is 64 clocks from, with the error rate (MSE) difference of 0.07 from the previous research method (Mean and Variance) i.e. where results are much more accurate.[1] Compare to research result [9], it need 320 clock for histogram calculation only, instead of our result need 64 clock to calculate mean, varians and skewness value.
6. CONCLUSION
The efficient implementation of mean, variance and skewness statistic formula into hardware base component using FPGA device has been proposed. This component use three additions component ( in three accumulators) and two divisions using two shift-right-registers, two subtractors, one adder and six multipliers. Calculating mean and avariance value for 8x8 image size only needs 64 clock cycles. This design (with counter and buffer) needs only 68 slices of flip-flops and 121 of 4 input LUTs. The difference (as an error) of mean value commparing to Matlab result is 3,57% in average due to floating point problem in FPGA. The FPGA result is exactly the same with Matlab result for integer value ( not concerning the floating value, optimal rounded and varians rounded) which are 14, 250 and 6526.
ACKNOWLEDGEMENT
Thanks to Yayasan Pendidikan Gunadarma and Yayasan Ilmu Komputer for supporting this research as one part of research dissertation in Doctoral Program of Gunadarma University, Jakarta-Indonesia.
REFERENCES
[1] A. Pertiwi. Optimalisasi Metode Implementasi Algoritma Histogram, Mean Dan Variansi Ke Dalam IC-FPGA Untuk Aplikasi Analisis Tekstur Citra Real Time. Disertasi.Teknologi Informasi. Universitas Gunadarma. 2015. [2] L. Maggiani, C. Salvadori, M. Petracca, P. Pagano, R, Saletti. Reconfigurable Archictecture for Computing
Histograms in Real-Time Tailored to FPGA-based Smart Camera. IEEE 23rd International Symposium on
Industrial Electronics (ISIE). Istambul Turkey. 2014.
[3] D.G. Bailey, M.J. Klaiber. Efficient Hardware Calculation of Running Statistics, 28th International Conference on Image and Vision Computing New Zealand (IVCNZ 2013). Page(s): 1-6.2013; ISSN: 151-2191; Print ISBN: 978-1-4799-0882-0.
[4] M.A. Ibarra-Manzano, D.L.A. lmanza-Ojeda, J.M. López-Hernández, Design and Optimization of Real-Time Texture Analysis using Sum and Difference Histograms Implemented on an FPGA. Electronics. Robotics and Automotive Mechanics Conference. Mexico. 2010.
[5] Stuti Sharon, Vani V, Shobha B.N. FPGA Implementation for Automated Classification of Breast Cancer Using Support Vector Machines. International Journal for Research in Applied Science & Engineering Technology (IJRASET). Volume 3. June 2015. Special Issue-I1; ISSN: 2321-9653.
[6] W.L. Martinez, A.R. Martinez. Computational Statistics Handbook with MATLAB. Chapman & Hall/CRC. USA. 2002.
[7] R.E. Woods, S.L. Eddins, R.C. Gonzales. Digital Image Processing Using MATLAB. Pearson Education. 2005. [8] David P. Doane, Lori E. Seward, Measuring Skewness: A Forgotten Statistic? Journal of Statistics Education
Volume 19. 2011; Number 2.
![Figure 1. The ilustration of histrogram distribution and skewness [8]](https://thumb-ap.123doks.com/thumbv2/123dok/1725249.1576332/3.595.92.517.150.269/figure-ilustration-histrogram-distribution-skewness.webp)
![Figure 3. The block diagram of component (a) reference design [1] and (b) proposed design](https://thumb-ap.123doks.com/thumbv2/123dok/1725249.1576332/5.595.95.518.92.453/figure-block-diagram-component-reference-design-proposed-design.webp)