ISSN: 2303-3703 27
Temperature and Humidity Monitoring on IoT Based
Shipment Tracking
Zaenurrohman, Arief Marwanto, Suryani Alifah
Electrical Engineering Post Graduated Program, Sultan Agung Islamic University Jl. Raya Kaligawe KM 4 Semarang 50112, Indonesia
Abstract
To maintain quality of goods among shipment process, monitoring and controlling is performed. Moreover, position of the vehicles is performed by GPS tracking. However, conventional monitoring and controlling temperature and humidity is done manually. Moreover, inaccurate measurement during shipment process is affected to the goods quaity especially for goods and beverages packets. Inaccurate tracking has contributed as one factor which causes vehicle lost in control. To addressing these limitation, integrating shipment process such as temperature, humidity, tracking and tracking system are proposed based on Internet of Things (IoT).
The systems are conducted by uses Arduino Uno, RFID MFRC522, GPS Neo6M, DHT11 dan RTC DS1307. The system performance has monitored humidity and temperature properly and bus range tracking system is conducted using Neo6M based on IoT. Data measurement result are delivered onto Clouduino over Internet network at any time. Therefore realtime measurement and tracking are visualized onto Web using API Google Maps. The performance result shows that within two experiment treatments, such as static and mobility measurements, the propose system are performed well.
In static measurements, the average interval value of the data transmission time is 5,75 seconds from the designed interval value of 5 seconds, the average value of the deviation from the interval of data transmission time is 0,75 seconds, and the average delay time between data transmission and reception is 0,3 seconds. While at dinamic measurements, the average interval value of the data transmission time is 6.22 seconds from the designed interval value of 5 seconds, the average value of the deviation from the interval of data transmission time is 1.22 seconds, and the average delay time between data transmission and reception is 2.31 seconds.
Keywords: Monitoring, Tracking, DHT11, RFID, IoT.
1. Introduction
Shipment tracking is a common things in the shipment process from the place of origin to the destination place. The shipment process usually starts from the identification of goods to be shipped to the shipment using land, sea and air transportation. Problems in the item identification and shipment tracking often arise due to the limitations of identification tools and tracking tools used. Error problems in the identification of names and quantities, as well as the existence of innacurate item positions become necessary for more consideration.
Apart from these problems, one of the priorities is the quality of the goods should be same as well as it was sent it. Due to the quality of goods becomes an important thing considered by companies engaged in various fields, ranging from agribusiness companies, pharmaceuticals, variants of food needs and various other fields [1].
Quality of goods to be shipped is affected by the condition of temperature and humidity in the cabin of carrier vehicle. Especially, if the goods to be delivered are vulnerable to significant temperature and humidity changes, such as meat, vegetables, medicines and so on. The mistake treatment or handling of a type of goods due to temperature and humidity factor may cause vulnerable damage to the shipped goods, special handling or treatment should be done and to be considered.
LM35 analog sensor. Temperature sensor data is transmitted to the MQTT server, which is an open data platform for IoT. Sensor node connection and MQTT server uses node MCU ESP8266. The result shows that the system is able to publish and subscribe data on the cloud. The data exchange transmitting is limited only when the wifi signal is presented. This only short range cover range transmisi [2].
Inteligent Ware House Management System conducted by Putut Dewanto Harjo the shipment tracking. Tracking position of the shipping fleet is the by smartphone base on moile operator signal. The data transmission exchange to the server using the GPRS system. The result show that the real time shipment tracking and location of shipment fleet could be profided. However, monitoring and controlling temperature and humidity is not provided [3].
IoT base online vehicle controlling and monitoring using Rasberry Pi3 and USB Glonass module is conducted [4]. IoT module will send the position base on GPS satelit data to the Firebase server. Real time vehicle position through web application using Google Maps API could be displayed well and able to locked vehicle remotely. GSM modem is uses to exchange data transmission to the firebase system. However, monitoring and controlling temperature and humidity provided.
In the paper integrating shipment tracking for monitoring and controlling temperature and humidity is proposed base on IoT.
2. Research Method
RFID TAG and Reader are displayed in order to identified the item of the goods. More over Wherhouse management system is played and inteligenly detect of the item automaticaly. Furthemore position of the carrier vehicle is traced base on data cordinate received from GPS module.
According to the Fig. 1 DHT11 is readed continuously measured of temperature and humidity inside the cabin. Data measurement from DHT11 and data identification from RFID Reader and also position cordinate from GPS module is a sent it using GSM modem which utilizier GPRS connection. The connection setup using IP base bearer feature on GPRS connection. AT Command is uses to connecting GSM modem with internet. While data transmission to the Clouduino server is used GET command.
To Synchronize timing starting from the control sustem to the webserver RTC module is used. Realtime information of data transmission proses has provided by RTC module. More over the shipment time is synchronize on the monitoring web in order to compare data is transmitted and the data has been transmitted.
Internet
Cell Tower
Browser monitoring
carrier of the goods with monitoring and tracking
system Kontroler, Sensor, GPS,
RFID, Modem, RTC Satelit
GPS
Webserver (Clouduino)
Figure 1. Architecture of Monitoring and Tracking System
2.1. Hardware Design
RFID
Tags RFID Reader
Arduino Uno
RTC SIM800L
GPS Neo-6M
DHT11
Goods Goods
Goods
D3-D4
D6-D7
D2
A4-A5 D9-D13
Figure 2. Design of hardware of monitoring and tracking system
2.2. Design Software
The programs designed include RFID reader, DHT11 sensor reader, GPS reader, RTC reader and SIM800L communication process. Arduino compiler is used which based on C++ programing language.
According to Fig. 3, the first process to run is to define the header and variable files used. The header file is a library file that is used to integrate arduino uno with some of the modules used. Variable definition includes the declarations of some of the variables used in the program list. Initialization softserial communication is the process of reading the type of communication used by the Arduino Uno with several modules that are connected. Communication Arduino Uno with GSM Modem, and Arduino Uno with GPS module using USART Serial, Arduino Uno communication with DHT11 module using Serial Singleware, Arduino Uno communication with RFID Reader module using Serial SPI, while Arduino Uno communication with RTC module using Serial I2C.
Start
Initialize softserial communication USART, singlewire, SPI and I2C
Define file header and used variable
Connected to Internet ? Connection using modem SIM800L
Data sent ?
No
Yes
Yes No
Read data identification of TAG RFID
Read Data of Sensor DHT11, GPS and RTC
Send data to webserver Combine and change the data of TAG RFID, DHT11, GPS, and RTC
to type string
The program that runs next is the process of connecting the system with the internet using a GSM modem. Once the system is connected to the internet, the next process is to read the identification data of the RFID TAG detected by the RFID Reader, read the DHT11 sensor data, read the GPS coordinate data and read the RTC data.
Reading data from RFID Reader, DHT11, GPS and RTC, are then combined into one file and converted to a string data type. The data is sent to the webserver using an internet connection. If the data is successfully sent to the web server, the program will return to the process of reading RFID data, the data DHT11, the GPS data and RTC. If the data fails to be sent to the web server, then the program will return to the process of connecting the system to the Internet using a GSM modem.
2.3. Measurement Model
The system model setup is conducted by using two categories, namely testing with the static monitoring and tracking system, and secondly testing with the dynamic monitoring and tracking system. The static testing model is performed in one place to test the performance of the system in sending data to the webserver, while the dynamic testing model is performed in mobile by varies speed of the carier vehicle on the highway by car at different speeds. Dynamic testing aims to determine the performance of the system in monitoring and tracking at the speed of the vehicle and at different places.
The proposed system model is conducted by two exeperimental setup models, such as tracking controller system with static conditions and second is tracking controller sysem by dynamic conditions.
3. Results and Analysis
3.1. Static Monitoring and Tracking
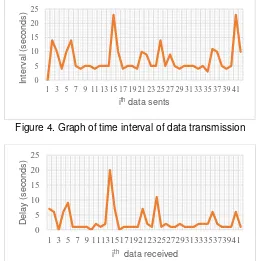
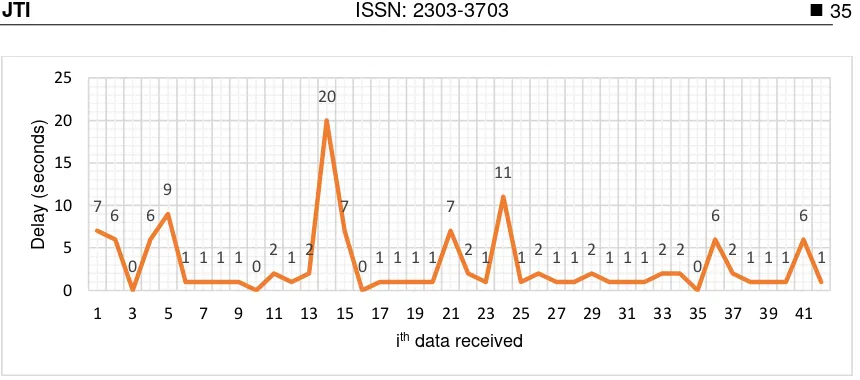
The results of static monitoring and tracking measurements, known information time interval data delivery to the webserver, delay between the time data is sent and time data received.
Figure 4. Graph of time interval of data transmission
Figure 5. Graph of delay between sensor data transmission and reception
According to Fig. 4, it is known that the average time interval of data sent is 7.19 seconds. According to Fig. 5 the average delay time data is sent and the received data is 2.9 seconds.
0
1 3 5 7 9 11131517192123252729313335373941
3.2. Dynamic Monitoring and Tracking 3.2.1. 30km/h Speed Variations
Graph of temperature and humidity value of result of monitoring and tracking with variation of speed 30km/h shown in Fig. 6, and graph of interval time value of data sent shown in Fig. 7.
Figure 6. Graph of temperature and humidity at 30km/h speed
According to Fig. 6, the data of temperature and humidity values are read by the system and sent to the web server, reading and sending data shows the value of a stable temperature and humidity. It shows the system can monitor temperature and humidity work well.
According to Fig. 7, it is known that the smallest interval value is 4 seconds, and the largest interval value is 19 seconds. The average interval value of 6.08 seconds and the mean deviation of the data transmission interval is 1.08 seconds.
Figure 7. Graph of data transmission interval at 30km/h speed
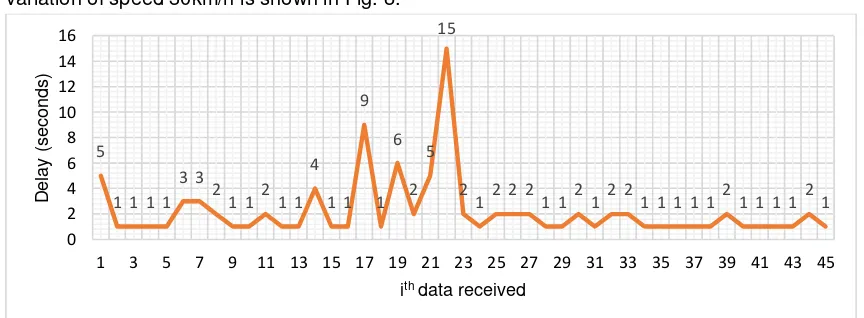
The graph of delay time between transmitting and receiving of measured data with variation of speed 30km/h is shown in Fig. 8.
Figure 8. Graph of data reception delay at 30km/h speed 0
ith data received
Temperature Humidity
According to Fig. 8, the largest delay time is 15 seconds and the smallest delay time is 1 second. Known average of delay time is 2.2 seconds.
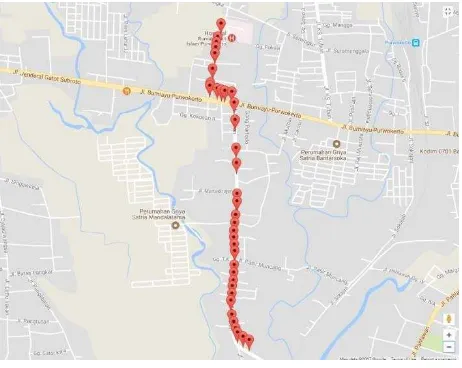
Experimental results Tracking car position using variations of speed 30km/h is shown in Fig. 9.
Figure 9. Result of car tracking at 30km/h speed
Fig. 9 has presented car positioned cordinates data, it can be seen that most of the tracking results are suitable and perform well under 30km/h speeds. When the middle track process begins, the distance between the car's position coordinates is greater in distance than before and after. This is due to the considerable data reception time of the delay, which is most likely due to the quality of the internet connection in that area which is less stable.
3.2.2. 40km/h Speed Variations
The testing time at 40km/h speed variation is performed after the test at 60km/h speed variation. Graph of temperature and humidity values resulting from data processing of the result monitoring and tracking test is shown in Figure 10.
Figure 10. Graph of temperature and humidity at 40km/h speed
Based on Figure 10, the temperature value in the monitored car cabin is increasing progressively, while the humidity value is decreasing. This is in line with the time during the daylight when testing at 40km/h speed variation. From the test result of data processing of temperature and humidity values, it can be seen that the average temperature value is 32.58°C and the average humidity value is 42.59%.
0 10 20 30 40 50
1 3 5 7 9 11 13 15 17 19 21 23 25 27 29 31 33 35 37 39 41 43 45 47 49
°
C
/
%
ith data received
Figure 11. Graph of data transmission intervals at 40km/h speed
The graph of the data transmission intervals in the test at 40km/h speed variation in Figure 11 shows the stable value of the data transmission time interval compared to the value of data transmission time interval in the test at 30km/h speed variation. The largest interval value on this test is 24 seconds or when sending the 13th data. While the smallest interval value is 4 seconds. From the total value of data transmission time interval in this test, it can be seen that the average time interval is 5.3 seconds, and the value of deviation is 0.3 seconds.
Figure 12. Graph of time delay of data reception at 40km/h speed
Based on Figure 12, the the largest value of data reception time delay is on the 12th data transmission that is 22 seconds, while the smallest one is 0 second. From the total time delay of each data transmission in this test, it can be seen that the average value of time delay is 1.85 seconds.
Figure 13. Result of car tracking at 40km/h speed
5 5 5 545 545 5 54
24
9
5 545 5 545 545 5 545 545 5 545 545 5
9
5 545 5 545
0 5 10 15 20 25 30
1 3 5 7 9 11 13 15 17 19 21 23 25 27 29 31 33 35 37 39 41 43 45 47 49
Int
erv
al
(s
ec
on
ds
)
ith data sents
2 10 12 1 1 2 1 1 1
22
5 3 2
1 2 1 1 1 1 2 02 1 102 10 12 1 1 1 1 1 2 1
5 3
0 12 2 302 1
0 5 10 15 20 25
1 3 5 7 9 11 13 15 17 19 21 23 25 27 29 31 33 35 37 39 41 43 45 47 49
D
elay
(s
ec
onds
)
Based on Figure 13, the test of car’s position tracking starting from the south, from the beginning to the middle of the test, is not stable. This can be seen from the distance between the spaced coordinate markers than at the end of the testing process, and it occurs because the greater delay of coordinate data transmission.
3.2.3. 60 km/h Speed Variation
The test time at 60km/h speed variation is performed after testing at 30km/h speed variation. Based on Figure 14, the temperature value in the monitored car cabin is increasing progressively, while the humidity value is decreasing. This is in line with the daytime when performing test at 40km/h speed variation. From the data processing of temperature and humidity value of the test results, it can be seen that the average temperature value is 31.59°C and the average humidity value is 51.64 %.
Figure 14. Graph of temperature and humidity at 60km/h speed
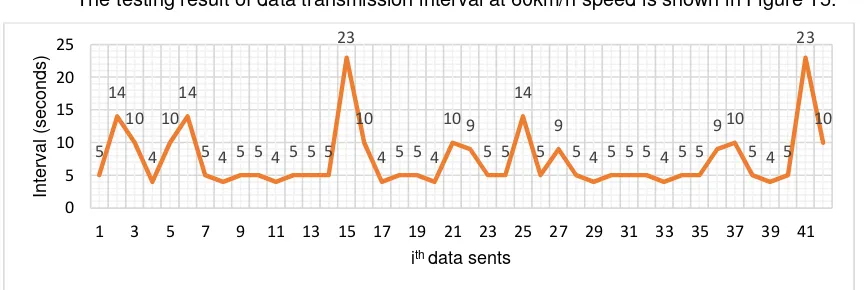
The testing result of data transmission interval at 60km/h speed is shown in Figure 15.
Figure 15. Graph of data transmission interval at 60km/h speed
The graph of data transmission interval on testing at 60km/h speed shows relatively unstable interval value than the graph of intervals on the previous test. This can be caused by the speed of the car with a faster average speed of 60km/h, which affects the quality of the modem connection to the Internet network, so that the transmission time interval is larger. The largest interval value in this test is 23 seconds, while the lowest interval value is 4 seconds. From the overall values of data transmission intervals, it can be seen that the average interval result in this test is 7.3 seconds, and the average value of deviation is 2.3 seconds.
Similar to the graph of interval value, the time delay between data transmission and reception at 60km/h speed is also relatively unstable, as shown in Figure 16. The largest delay time in this test is 20 seconds, and the smallest one is 0 second. Based on the total delay time, it can be seen that the average delay time is 2.88 seconds.
Figure 16. Graph of time delay of data transmission at 60km/h speed
The result of the car’s position tracking traveling at an average speed of 60km/h is shown in Figure 17. From the figure, it indicates that the system can track the car’s position from the beginning to the end of the test even though the coordinate markers of car’s position are far apart. In this case, it is also affected by the value of data reception time delay.
Figure 17. Result of car tracking at 60km/h speed
3.2.4. Overall Results Analysis
The measurement results with several speed variations are shown in Table 1.
Table 1. The results of monitoring and tracking measurements
According to table 1, it is known that the average value of the interval, the avarage value of the deviation and the average value of delay in the static test is smaller than the average value of the interval, the avarage value of the deviation and the avarage value of delay in the dynamic test. The smaller the value of data transmission interval and data receiving delay, then the system
performance is getting better. This shows the performance of monitoring and tracking systems better when static vehicle conditions than when the conditions are dynamic.
The measurement data of monitoring and tracking with dynamic model shows the average interval value, avarage deviation and the smallest average delay value, is measured using 40km/h car speed, while the average value of interval, average deviation and the largest average delay value, is measured using 60km/h car speed.
Based on the results of dynamic model measurement, tracking system is known to be able to track the position of the car well when the car speed under 30km/h, under 40km/h, or under 60km/h. The car position is represented using the coordinate point markers displayed in the Googlemaps API. Each coordinate point marker represents a car position coordinate data received from the GPS receiver, so that the value of data transmission interval and time delay between sending and receiving data determine the distance between the coordinate point marker displayed in the Googlemaps API.
4. Conclusion
Prototype temperature and humidity monitoring on IoT based Shipment tracking has been developed. The prototype has been exeperienced by two types of the measurement tested. One is static either is mobile, and two is dinamic.
The results shows that static measurements, the average interval value of the data transmission time is 5,75 seconds from the designed interval value of 5 seconds, the average value of the deviation from the interval of data transmission time is 0,75 seconds, and the average delay time between data transmission and reception is 0,3 seconds. While at dinamic measurements, the average interval value of the data transmission time is 6.22 seconds from the designed interval value of 5 seconds, the average value of the deviation from the interval of data transmission time is 1.22 seconds, and the average delay time between data transmission and reception is 2.31 seconds.
Based on the average value of the interval, the average value of the deviation and the average value of delay on static testing smaller than the average value of the interval, the average value of the deviation and the average value of delay in the dynamic test, then the performance of the monitoring and tracking system is better when the condition of the vehicle is static than when the conditions are dynamic.
Humidity, temperature and tracking position are performed well based on the tested into two models. For further development, can use a controller with higher specifications to support faster data processing.
References
[1] Author1 A, Author2 B. Title of Manuscript. Name of Journal or its Abbreviation. year; Vol.(Issue): pages.
[2] (2017) Menjaga Kualitas Pengiriman Barang dengan Monitoring Suhu. [online], Available: http://www.alatuji.com/article/detail/122/menjaga-kualitas-pengiriman-barang-dengan-monitoring-suhu#.wvspiysgpiu, accessed on July 4th, 2017.
[3] Budioko, Totok, “Sistem Monitoring Suhu Jarak Jauh Berbasis Internet of Things Menggunakan Protokol MQTT”, Seminar Riset Teknologi Informasi (SRITI), pp. 353-358, 2016.
[4] Hardo, Putu Dewanto, “Perancangan Sistem Pengawasan Pengiriman Barang Menggunakan GPRS, GPS, Google Maps, Android, dan RFID pada Intelligent Warehouse Management System”, Symposium in Industrial Technology. vol. 1, pp. 58-66, Nov. 2012.
[5] Susanti, Erma, “Prototype Alat IoT (Internet Of Things) Untuk Pengendali Dan Pemantau Kendaraan Secara Realtime”, Simposium Nasional RAPI, vol. xv, pp. 401-407, 2016. [6] Agus, Kurniawan, Mengenal Microsoft Azure IoT, Jakarta, Indonesia: Elex Media
Komputindo, 2016.