1
S
ince their inception in the 1960s, com-munity health centers have served as a primary care safety net for the nation’s medically vulnerable populations in both inner city and rural areas. 1 HCs have been calledvar-ious names over the years—including neigh-borhood health centers, community health centers, family health centers, migrant health centers, and rural health initiatives—and since 1996 all have received Section 300 grant funds through the Public Health Service Act. More recently, such provisions have been referred to as health centers (HCs).
HCs provide a myriad of comprehensive, coordinated, and integrated health care serv-ices. Most notable are the primary care and preventive care services for individuals resid-ing in areas scant in health professionals, low in income, or otherwise underserved. Their central mission is to increase access to community-based primary health care services and to improve the health status of medically vulnerable populations, treating patients with-out regard to insurance or ability to pay. Many centers offer expanded services, such as trans-portation, health education and prevention, interpreter services, nutrition, mental health, and pharmacy. 2 To ensure that the centers do
not lose sight of their established missions, federal regulations require that the majority of each HC’s Board be community members who are active patients of the center.
In 2004, health centers consisted of approximately 1,000 organizations deliver-ing services at one or more sites to an esti-mated 13.1 million people. 3 In 2000, the
Institute of Medicine (IOM) reported that the ability of HCs to meet their mission of serv-ing all patients is threatened by:
1. Increased uninsured;
2. Proliferation of Medicaid managed care; and
3. Decreased subsidies for charity care. 4
While decreasing federal and state assist-ance and increasing Medicaid managed care contracting pose a signifi cant fi nancial chal-lenge, health centers have increased their Medicaid populations (both in number and percent) virtually every year since Uniform Data System (UDS) data have been collected.
Financial Performance and Managed
Care Trends of Health Centers
Brian C. Martin, Leiyu Shi, and Ryan D. Ward
Data were analyzed from the 1998–2004 Uniform Data System (UDS) to identify trends and predic-tors of fi nancial performance (costs, productivity, and overall fi nancial health) for health centers (HCs). Several differences were noted regarding revenues, self-suffi ciency, service offerings, and urban/rural setting. Urban centers with larger numbers of clients, centers that treated high numbers of patients with chronic diseases, and centers with large numbers of prenatal care users were the most fi scally sound. Positive fi nancial performance can be targeted through strategies that generate positive revenue, strive to decrease costs, and target services that are in demand. Key words: health centers (HCs), safety net providers, fi nancial performance, managed care, practice administration.
J Health Care Finance 2009;35(3):1–21 © 2009 Aspen Publishers, Inc.
Brian C. Martin, PhD, MBA, Department of Health Services Administration, College of Public Health, East Tennessee State University, Johnson City, TN. He can be reached at [email protected].
Leiyu Shi, DrPH, MBA, MPA, Department of Health Policy and Management.
Johns Hopkins Bloomberg School of Public Health, Baltimore, MD.
2 JOURNALOFHEALTH CAREFINANCE/SPRING 2009
Fundamental to the mission of HCs is the commitment to treat the uninsured; however, this number is variable for several reasons. During economic downturns there is a corre-sponding increase in the unemployed, causing the number of uninsured persons to increase. In addition, the rising cost of health care has caused insurance premiums to increase, leav-ing employers less willleav-ing to provide health care insurance as a benefi t. When employers do offer health insurance benefi ts, the trend toward increased employee cost- sharing may lead to insured employees who can-not access health care services. Employees whose employers do not offer a discounted group health insurance plan are often unwill-ing or unable to afford private insurance pre-miums, and join the ranks of the uninsured. In addition, some employees who are offered health insurance through their employer opt not to take this coverage. 5 While HCs rely on
federal and state revenues to offset spending on the uninsured, revenue shortfalls from these sources may also decrease public cov-erage and threaten safety net subsidies. 6
The fi nancial well-being of health cent-ers is also threatened when states face fi scal downturns ( i.e ., Medicaid eligibility restric-tions). 7 While there is documentation that
non-managed care centers see fewer unin-sured patients after becoming involved in managed care, regardless of urban or rural setting, there is evidence that centers are typically able to refocus this portion of their mission after an initial year of adjustment. 8
However, the impact of large increases in the uninsured, coupled with declines in federal grants and state subsidies, is that centers face greater likelihood of fi nancial defi cits. 9
Medicaid revenues, particularly Feder-ally Qualifi ed Health Center (FQHC) reim-bursement, have been important to HCs as a
non-grant source to help stabilize health center revenue. This has allowed HCs to provide inte-grated care to the medically indigent in their communities and to provide continuity of care to patients who routinely gain and lose Med-icaid eligibility. Centers have been concerned that Medicaid managed care programs will reduce Medicaid enrollees and operational revenues. 10 Nationally, Medicaid managed
care enrollment grew from 9.5 percent of total Medicaid patients in 1991 to 55.8 percent in 2000, and increased to 63.0 percent in 2004. 11
In 2003, the number of uninsured HC patients had decreased to 39 percent, and the number of Medicaid patients had increased to 36 per-cent, refl ecting the shift from traditional Med-icaid to MedMed-icaid managed care. 12 As state
Medicaid programs moved quickly to man-aged care, the ability of safety net providers, including HCs, to provide care to vulnerable populations was increasingly jeopardized. 13
Medicaid managed care fosters a competitive environment for these patients. As network providers open access to Medicaid managed care patients, HCs either become participants in the system or face losing Medicaid rev-enue. 14 Additionally, Medicaid managed care
organizations require additional administra-tive components ( e.g ., reporting, marketing) of HCs that were not previously required. 15
With Medicaid managed care comes a reduction in center revenues, which reduces resources used to provide services to the uninsured and has the potential to affect access to care. 16 Reasonable cost payments
for Medicaid services, required by the 1989 FQHC legislation, assists HCs in their efforts to provide care to vulnerable populations. 17
In 1989, Medicaid benefi ciaries accounted for 26 percent of HC patients but only 12 percent of HC revenue. 18 In 2002, Medicaid
patients and 35 percent of total revenues. However, there remains a general concern about the fi nancial viability of HCs. 19
HCs have become increasingly challenged, as the fulfi llment of their mission is directly dependent on external funding. 20 External
funding sources include Section 330 grants, State Children’s Health Insurance Program (SCHIP), Medicaid (managed and managed), Medicare, and private payers. From 1996–1999, the patient mix for HCs included an increase in the proportion of uninsured and a decrease in the proportion of covered patients, 21 During this period, more
than one half of HCs reported an operating defi cit, fueled largely by the increase in unin-sured patients. Community Access Program (CAP) grants were established by the Clinton administration in 2000 to increase the effec-tiveness and capacity of the nation’s health care safety net at the community level, and HC expansion grants aimed at increasing preven-tive and primary care services were launched by the Bush administration in 2002. 22 After a
13 percent drop in 1997, grant revenues rose to 25 percent of total operating revenues in 2002. While the spike in grant revenue from 1997 to 2002 is signifi cant, HCs have experienced overall declines in federal grant dollars since 1985. 23 This trend is particularly challenging
to centers in rural areas, which receive lesser amounts of federal grants, have a smaller tax base, and have less funding resources than their urban counterparts. 24
There is an abundance of research from the 1990s indicating the precarious fi nancial future of HCs. 25 On the other hand, there
are some reports of improvement. Thus, the purpose of this study was to identify trends and predictors of fi nancial performance for HCs. Specifi cally, this study examined costs, productivity, and overall fi nancial health in
an attempt to identify characteristics that could be replicated by other centers.
Methods
Study Design and Data Sources
This article presents the results of analy-ses of nationally representative secondary data from the 1998–2004 Uniform Data Sys-tem (UDS), not including homeless only or migrant voucher only grantees. The UDS contains information reported by the Bureau of Primary Health Care (BPHC)-funded center grantees, and is maintained by the BPHC, Health Resources Services Adminis-tration, US Department of Health and Human Services. The UDS collects the following information from health centers: patient demographics ( e.g ., age, race/ethnicity, lan-guage spoken, income, insurance status), selected diagnoses and services (health and enabling), staffi ng and utilization, fi nancing, and managed care enrollment and utilization. Details on UDS methodology and data col-lection protocol can be found online from the BPHC at http://www.bphc.hrsa.gov/uds/. Measures
For the purpose of this study, we included measures of fi nancial performance and selected center characteristics (as control). Measures of fi nancial characteristics are shown in Figure 1.
Measures of health center characteristics include:
1. Rural versus urban, number of center patients (measure of size);
2. Managed care versus non-managed care (based on managed care enrollees); 3. Large center versus small center; 4. Old versus new health centers; and
4 JOURNALOFHEALTH CAREFINANCE/SPRING 2009
5. Measures of predictive health center characteristics.
Measures of predictive health center char-acteristics include:
1. Rural versus urban;
2. Managed care versus non-managed care (based on managed care revenue and enrollees);
3. Center status (old versus new); and 4. Measures of selected health care
ser-vices (enabling serser-vices full-time equivalents (FTEs), chronic disease encounters, and prenatal care patients).
Managed Care
For the purpose of this study and based on the UDS document, managed care was defi ned as any arrangement health centers have made with a third party including Medicaid,
Medicare, private HMOs, and other managed care plans. All grantees participating in man-aged care report data that includes:
1. Information on revenue received and expenses for prepaid plans; and 2. Information on the number of
enroll-ees in different managed care plans. Based on this information data on center revenue and patients, we defi ne HCs’ involve-ment in managed care based on two indicators: managed care revenues and managed care enrollees. These two indicators were also used in the site selection process of a case study of managed care HCs. 26 Many studies have used
enrollees as a measure to capture managed care experience at the national, regional, state, local, and organizational levels. 27 Research
also has used revenue to measure product line within a plan or organization. 28
Measure Source Defi nition
Revenue source (cash receipts)
• Grant revenue • Service revenue • Medicaid revenue
• % revenue from grants
• % revenue from medical services • % revenue from Medicaid reimbursement Revenue share
(collection per revenue source)
• Medicaid collection • Medicare collection • Private collection • Self-pay revenue
• Total Medicaid collections / Total Medicaid patients • Total Medicare collections / Total Medicare patients • Total private collections / Total private patients • Total self-pay revenue / Total self-pay patients Cost • Encounter cost
• Medical encounter cost • Personnel cost • Medical personnel cost
• Mean cost per offi ce visit • Mean cost per medical offi ce visit • Mean annual salary per center personnel • Mean annual salary per center medical personnel Productivity • MD productivity
• MLP1 productivity
• PCP2 productivity
• Mean number patients seen per medical doctor • Mean number patients seen per non-physician provider • Mean number patients seen per primary care physician Performance • Self-suffi ciency
• Net revenue
• Ratio of payments for services to total costs • Total patient service revenue and other receipts less
accrued costs before donations
1 MLP includes nurse practitioners, nurse midwives, and physician assistants.
2 PCP includes general practice, family practice, general internal medicine, and pediatrics.
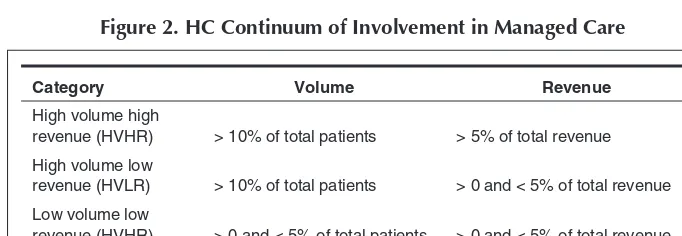
Specifi cally for the purpose of this paper, HCs’ involvement in managed care was defi ned as a continuum as described in Figure 2.
We divided centers into these categories so that we not only can compare centers involved in managed care with those that did not, but among centers with different levels of involvement. The choice of 10 percent cut-off for enrollees and 5 percent for revenue was based on the distribution of these two measures among HCs. Sensitivity analysis was performed based on slightly different cut-off points and yielded similar results. Further, we performed an analysis with a less restrictive defi nition of managed care revenue—total (rather than just primary care) prepaid managed care revenue. Total prepaid managed care revenue includes specialty and inpatient referral expenses and is not reported as part of the centers’ scope of services in other revenue tables. Since the two methods produced almost identical results, we present only those based on the more restrictive defi -nition of managed care revenue.
Center Characteristics
Center characteristics examined include those related to patients, providers, serv-ices, and fi nancial performance. Most of the
measures were directly available from the UDS. The fi nancial measures of stability, effi ciency, and productivity were created based on industry standards, prior research, and our experience. 29
The variables representing self-suffi ciency, grant revenue, service revenue, and net income were used to measure fi nancial stability. Self-suffi ciency was expressed as a percentage and as an estimate of a program’s subsidy gap. The subsidy gap is the difference between what a program can pay for its health care, whether by insurance (including both public and pri-vate) or patients themselves, and what it costs for a program to provide primary health care. 30
Programs with self-suffi ciency ratios less than one required federal and other grants to cover their costs. This measure was based on a similar ratio developed by and modifi ed by others studying primary care projects. 31 Grant
revenue was the percentage of total revenues that came from public ( e.g ., federal, state, or local) and private ( e.g ., Robert Wood Johnson and Kellogg Foundations) sources as subsi-dies for services. 32 Service revenue was the
percentage of total revenues that came from direct payments for services either by patients themselves or through third-party payers. 33
Net revenue was used to refl ect the program’s fi nancial status. 34
Financial Performance and Managed Care Trends of HCs 5
Category Volume Revenue
High volume high
revenue (HVHR) > 10% of total patients > 5% of total revenue High volume low
revenue (HVLR) > 10% of total patients > 0 and < 5% of total revenue Low volume low
revenue (HVHR) > 0 and < 5% of total patients > 0 and < 5% of total revenue Non-managed care < 10 managed care enrollees <$100 in managed care revenue
6 JOURNALOFHEALTH CAREFINANCE/SPRING 2009
Effi ciency was measured by average pro-gram costs defi ned as the total propro-gram costs divided by total number of medical encoun-ters or visits. 35 Average cost per encounter has
been used as a measure of effi ciency related to ambulatory care as well as other health care settings. 36 Average personnel costs were
also included to measure the average costs of employing medical and support staff includ-ing physicians, mid-level practitioners (MLP), nurses, administrators, and others. MLPs include physician assistants, nurse practition-ers, and certifi ed nurse midwives. Average medical costs were the average costs of phy-sicians and average administrative costs were the average costs of administrators.
Provider productivity was measured by the number of encounters or visits per MD or MLP. HCs are staffed by primary care physicians ( e.g ., general and family practitioners, in -ternists, and pediatricians) and MLPs. 37 HCs
re questing federal funds authorized by the Community or Migrant Health Center Pro -grams were formerly required to maintain a minimum number of patient encounters per pro-vider as a condition of approval for funding. 38
With respect to economic factors, exter-nal funding sources ( e.g ., grant funding) and payer mix could infl uence choice of strat-egy. 39 Thus, HCs receiving less funding from
grants may have to reduce their services to the uninsured. HCs with relatively large Medicaid revenue are expected to be more motivated to get involved in Medicaid man-aged care to retain and expand their patient base. However, it is also possible that HCs currently with fewer Medicaid patients may get involved in Medicaid managed care to attract more Medicaid enrollees. In addition, population density, as measured by rural versus urban location, is expected to have an important impact on feasibility of managed care. 40 Not only does managed care have
insignifi cant penetration in rural areas due to a relatively sparse population, rural provid-ers are more suspicious about managed care, an urban-based phenomenon. 41
Analysis
Descriptive analysis provides trends on the fi nancial performance measures of HCs. Bivariate comparative analysis examines dif-ferences in fi nancial and performance meas-ures of HCs between rural versus urban, and managed care versus non-managed care centers. Multivariate longitudinal analysis identifi es center attributes signifi cantly asso-ciated with center fi nancial performance.
Results
Financial Trends
Descriptive analysis revealed fi nancial trends over the seven-year period. Each varia-ble is analyzed specifi cally in Figure 3, and fur-ther elaborated in Figures 4 through 9 below.
Revenue
F
inancial P
erformance and Mana
g
ed Car
e
T
rends of HCs
7
Figure 3. Descriptive Variables and Trends
Continued
MEAN STD ERR 1998 1999 2000 2001 2002 2003 2004
2004–1998 (% Δ)
7-Year Average
Grant Revenue (%) 0.43 0.40 0.40 0.40 0.42 0.40 0.38 -11.63 0.4043
0.01 0.01 0.01 0.01 0.01 0.01 0.01
Service Revenue (%) 0.57 0.60 0.60 0.60 0.58 0.60 0.62 8.77 0.5957
0.01 0.01 0.01 0.01 0.01 0.01 0.01
Medicaid Revenue (%) 0.26 0.22 0.22 0.23 0.22 0.23 0.24 -7.69 0.2314
0.01 0.01 0.01 0.01 0.01 0.01 0.01
Medicaid Collection ($) 330.84 345.14 360.97 388.57 403.13 422.42 468.53 41.62 388.51
12.55 12.81 9.57 15.83 22.66 17.21 16.85
Medicare Collection ($) 251.64 274.78 280.90 324.50 324.35 310.24 337.36 34.06 300.54
9.53 9.66 9.62 15.26 12.57 8.40 9.02
Private Collection ($) 133.64 154.50 156.44 163.70 189.48 189.02 196.12 46.75 168.99
5.46 9.53 6.82 6.19 19.19 9.20 7.22
Self-Pay Collection ($) 71.81 75.58 79.50 87.19 90.32 90.42 99.07 37.96 84.84
3.18 4.28 4.57 4.70 5.15 3.75 3.90
Encounter Cost ($) 91.97 94.41 105.70 110.77 120.97 130.11 132.85 44.45 112.40
1.56 1.46 1.90 1.49 2.38 3.22 2.06
Medical Encounter Cost ($) 81.49 84.21 91.56 96.70 105.44 113.43 115.88 42.20 98.39
1.25 1.25 1.63 1.26 1.93 2.92 1.58
Personnel Cost ($) 63,781.51 66,887.61 72,218.29 72,881.12 74,736.63 77,029.48 79,910.96 25.29 72,492.23 1,541.76 1,578.26 2,136.63 1,136.84 1,541.41 1,195.98 1,025.21
Medical Personnel Cost ($) 118,101.58 122,375.88 129,884.28 134,096.32 139,309.87 147,914.91 153,986.51 30.38 135,095.62
8
J
OURN
AL
OF
H
EAL
TH
C
ARE
F
IN
ANCE
/S
PRING
2009
Figure 3. Continued ...
MEAN STD ERR 1998 1999 2000 2001 2002 2003 2004
2004–1998 (% Δ)
7-Year Average
Total MD Productivity 4,277.26 4,103.19 4,262.69 3,804.12 3,691.03 3,645.06 3,716.75 -13.10 3,928.59
192.21 131.52 231.16 46.81 53.39 41.16 62.92
Total MLP Productivity 2,569.58 2,643.83 2,555.63 2,565.81 2,540.14 2,565.54 2,595.36 1.00 2,576.56
49.60 51.23 41.16 41.40 38.40 36.74 35.69
Total PCP Productivity 4,252.98 4,059.07 4,053.87 3,805.58 3,688.22 3,642.16 3,697.64 -13.06 3,885.65
174.38 114.32 155.06 45.67 52.72 41.11 60.16
Self-Suffi ciency Ratio 0.71 0.80 0.80 0.81 0.79 0.81 0.85 19.72 0.7957
0.01 0.01 0.01 0.01 0.01 0.01 0.01
Net Revenue ($) 869,889.61 1,653,801.78 1,834,552.75 2,044,645.08 2,127,980.46 2,413,327.65 2,809,096.21 222.93 1,964,756.22
84,618.12 126,999.97 128,350.51 126,571.12 138,513.37 154,624.53 189,507.17
F
inancial P
erformance and Mana
g
ed Car
e
T
rends of HCs
9
Encounter Cost
Medical Encounter
Cost
Personnel Cost
Medical Personnel
Cost
MD Productivity
MLP Productivity
Self-Suffi ciency
Net Revenue
Urban Location -1.67 1.48 3914.95* 2492.69 -81.98 -32.61 0.05*** 453163.3**
(Ref: Rural) (3.70) (3.20) (1591.3) (3651.46) -200.45 (52.45) (0.01) (157986.1)
Users -0.0001 -0.0001 0.29* 0.24 0.02*** 0.01** 0.0001 175.06***
(0.0001) (0.0001) (0.13) (0.17) (0.004) (0.003) (0.0001) (26.35)
Managed Care Enrollees
(Ref: No MC)
Small 1.22 -0.10 -893.92 -4047.67 -69.9 48.71 -0.02 -385064**
(2.39) (2.01) (2382.38) (3143.32) -104.41 (50.39) (0.01) (124601.9)
Medium 3.95 2.43 -2321.52 -2283.34 -151.96* 44.75 -0.02* -313444*
(2.29) (1.94) (2893.73) (4106.26) (75.73) (47.34) (0.01) (152736.9)
Large 6.84* 3.02 -2824.96 -2650.35 -177.00* -69.25 -0.05*** -654437***
(2.72) (2.29) (4112.9) (4869.38) (79.88) (57.03) (0.01) (190514.5)
Center Status 38.92*** 32.74*** 10510.43*** 23899.89*** -467.81* -269.88*** 0.01 567135.5* (Ref: Old) (4.18) (3.14) (2033.58) (3608.38) (209.58) (61.03) (0.01) (238944.8)
Enabling Services FTEs 0.26*** 0.1* -139.33* -54.31 -1.84 0.17 -0.001** -4919.15
(0.07) (0.04) (59.4) (55.14) (1.97) (1.01) (0.0002) (9703.27)
Chronic Disease
Encounters -0.04* -0.02 4.52 -17.67 -0.75 0.13 0.0001 2836.47**
(0.02) (0.02) (8.87) (17.81) (0.74) (0.38) (0.0001) (1025.11)
Prenatal Care Users 0.01*** 0.01*** 1.29 0.88 -0.06 0.02 0.00001** 1508.81**
(0.002) (0.002) (1.56) (2.28) (0.07) (0.06) (0.00001) (481.6)
Grant Revenue 41.93* 26.66 -7469.85 -5678.26 -308.34 -1042.29*** -1.43*** -1753078* (20.38) (16.15) (6551.34) (10494.05) (883.82) (134.03) (0.05) (883709.5) Figure 4. Characteristics Associated with Financial Performance at CHCs: General Estimation Results
10
J
OURN
AL
OF
H
EAL
TH
C
ARE
F
IN
ANCE
/S
PRING
2009
Encounter Cost
Medical Encounter
Cost
Personnel Cost
Medical Personnel
Cost
MD Productivity
MLP Productivity
Self-Suffi ciency
Net Revenue
Encounter Cost -0.0002 264.99
(0.0001) (1826.11)
Medical Encounter Cost 0.0002 453.9
(0.0001) (1338.06)
Personnel Cost 0.00001 10.27
(0.0001) (7.85)
Medical Personnel Cost 0.00001 2.44
(0.0001) (1.44)
MD Productivity -0.0008 -0.001* 4.04* 2.69** 0.00001 -57.28
(0.0005) (0.0004) (1.94) (0.89) (0.0001) (37.96)
MLP Productivity -0.004*** -0.004*** -0.03 4.99*** 0.00001 -126.41*
(0.001) (0.001) (1.06) (1.41) (0.0001) (57.27)
Note: * p<0.05,** p<0.01,*** p<0.001, based on Z-statistics.
Source: 1998–2004 BPHC UDS data.
Financial Performance and Managed Care Trends of HCs 11
Collections Per Patient
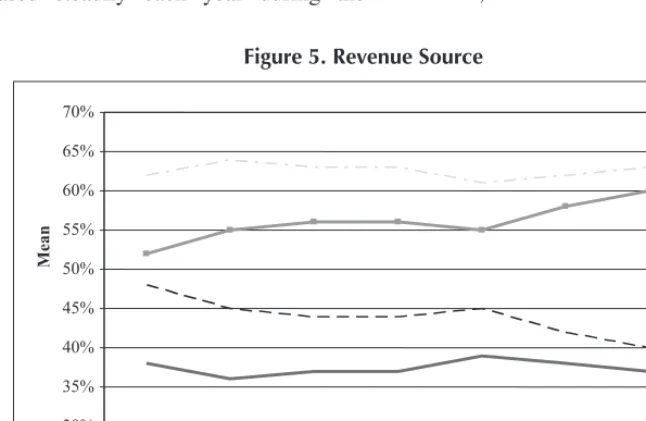
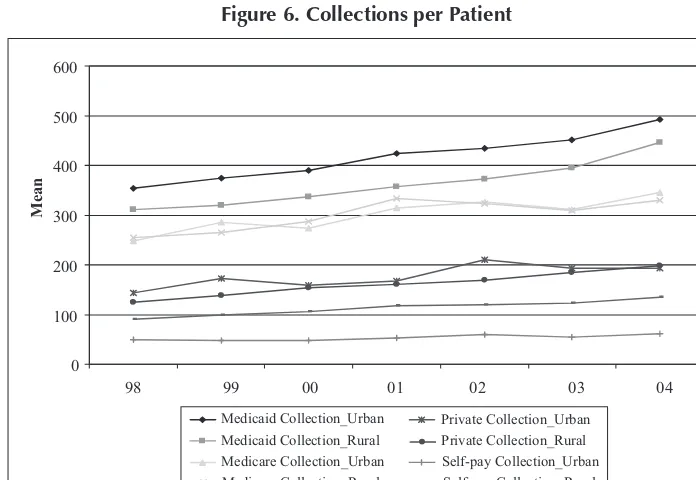
While the percentage of Medicaid revenue (2004 vs. 1998) declined, collections from Medicaid increased steadily across the seven-year period (41.62 percent increase 1998 to 2004). The same positive trend is seen for Medicare, private-pay, and self-pay collections, with 2004 vs. 1998 changes of 34.06 percent, 46.75 percent, and 37.96 percent, respectively. Collection trends for rural HCs mirror those of urban HCs, albeit at a lower average rate, with the exception of private pay and self-pay. Rural private pay collections increased steadily over the seven-year period and passed urban collec-tions in 2004. Rural center self-pay colleccollec-tions continued at an average rate higher than urban HCs. See Figure 5.
Encounter Costs
Encounter costs, total and medical, increased steadily each year during the
seven-year period. Total encounter costs and medical encounter costs increased in 2004 vs. 1998 by 44.45 percent and 42.20 percent, respectively. Similarly, total personnel costs and medical personnel costs increased (2004 vs. 1998) by 25.29 percent and 30.38 per-cent, respectively. Average total and medical costs were lower for rural HCs, but shared an increasing trend with urban HCs in both categories. See Figure 6.
Provider Productivity
While medical personnel costs increased during the study period, physician pro-ductivity showed a declining trend. All physician productivity (primary and spe-cialty care) decreased 13.10 percent in 2004 vs. 1998. Primary care provider productivity decreased 13.06 percent in the same compar-ison. Mid-level practitioner productivity, by contrast, remained relatively stable. Average
Figure 5. Revenue Source
30% 35% 40% 45% 50% 55% 60% 65% 70%
98 99 00 01 02 03 04
Mean
Grant Revenue_Urban Grant Revenue_Rural
Service Revenue_Urban Service Revenue_Rural
12 JOURNALOFHEALTH CAREFINANCE/SPRING 2009
productivity for both physicians and mid-level providers was generally higher for rural HCs than for urban HCs. See Figure 7.
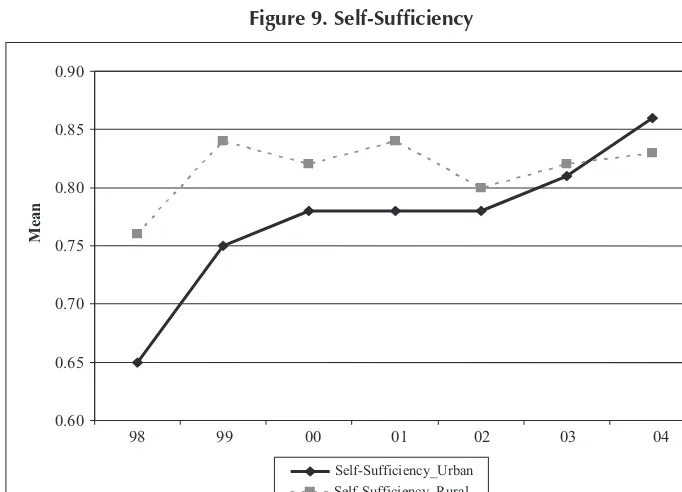
Self-Suffi ciency and Net Revenue
Third-party payments increased 19.72 per-cent relative to total costs (2004 vs. 1998), to a ratio of third-party payments to total costs of 0.85. Prior to 2004, this ratio held relatively stable at 0.80. Self-suffi ciency is evident in the increasing net revenue trend seen in each year of the seven-year period. The percent change from 2004 vs. 1998 was 222.93 percent. While self-suffi ciency was greater for rural HCs than for urban HCs from 1998 to 2003, self-suffi ciency for urban centers increased at a greater rate and passed rural center suffi ciency in 2004. See Figure 8.
Characteristics Associated with Financial Performance
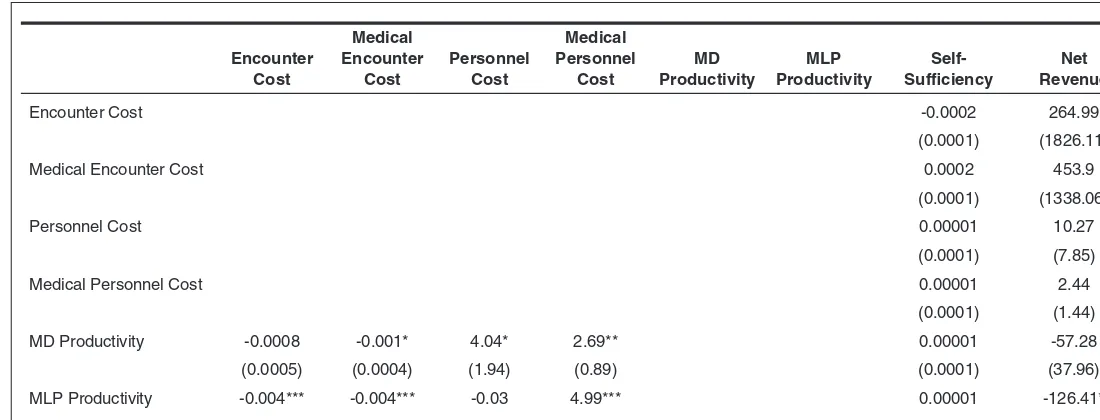
Eight general estimation models were run using annualized data to determine charac-teristics associated with fi nancial perform-ance ( see Figure 9). P-values are based on z statistics.
A center located in an urban (versus rural) setting was likely to have higher personnel costs (p<0.05), greater self-suffi ciency (p<0.001), and higher net rev-enue (p<0.01). Large centers (defi ned by the number of patients) had greater personnel costs (p<0.05), greater physician productiv-ity (p<0.001), greater mid-level practitioner productivity (p<0.01), and greater net rev-enues (p<0.001).
Centers were divided into groups based on number of managed care enrollees in
Figure 6. Collections per Patient
0 100 200 300 400 500 600
98 99 00 01 02 03 04
Mean
Medicaid Collection_Urban Medicaid Collection_Rural Medicare Collection_Urban Medicare Collection_Rural
Private Collection_Urban Private Collection_Rural Self-pay Collection_Urban Self-pay Collection_Rural
Financial Performance and Managed Care Trends of HCs 13
Figure 7. Encounter Costs
60 80 100 120 140
98 99 00 01 02 03 04
Mean
Encounter Cost_Urban Encounter Cost_Rural
Medical Encounter Cost_Urban Medical Encounter Cost_Rural
Figure 8. Provider Productivity
Source: 1998–2004 BPHC UDS data.
2,000 3,000 4,000 5,000
98 99 00 01 02 03 04
Mean
MD Productivity_Urban
MD Productivity_Rural
MLP Productivity_Urban
MLP Productivity_Rural
14 JOURNALOFHEALTH CAREFINANCE/SPRING 2009
order to determine the affect of managed care enrollment on fi nancial performance. HVHR (high volume high revenue) centers were classifi ed as “Large,” HVLR (high vol-ume low revenue) centers were classifi ed as “Medium,” and LVLR (low volume low rev-enue) centers were classifi ed as “Small,” and comparisons were made to centers having no managed care enrollees. Large centers had higher encounter costs (p<0.05), lesser MD productivity (p<0.05), lesser self-suffi ciency (p<0.001), and lesser net revenues (p<0.001). Medium centers had lesser MD productivity (p<0.05), lesser self-suffi ciency (p<0.05), and lesser net revenues (p<0.05). Small cent-ers had lesser net revenues (p<.01).
Centers were also analyzed based on participation in managed care—whether participation occurred for the fi rst time in the
study year or participation had occurred for two or more years. Centers in their fi rst year of managed care participation had greater encounter costs (p<.001), greater medical encounter costs (p<.001), greater nel costs (p<.001), greater medical person-nel costs (p<.001), lesser MD productivity (p<.05), lesser MLP productivity (p<.001), and greater net revenues (p<.05).
Enabling services—case management, child care, discharge planning, eligibility assistance, employment/educational coun-seling, environmental health risk reduction, food bank/delivered meals, health educa-tion, housing assistance, interpretation/ translation services, nursing home/ assisted-living placement services, and outreach— were provided to varying degrees by centers through FTEs. Centers that provided
Figure 9. Self-Suffi ciency
0.60 0.65 0.70 0.75 0.80 0.85 0.90
98 99 00 01 02 03 04
Mean
Self-Sufficiency_Urban Self-Sufficiency_Rural
enabling services had greater encounter costs (p<.001), greater medical encounter costs (p<.05), lesser personnel costs (p<.05), and lesser self-suffi ciency (p<.01).
Centers that had more chronic disease encounters 42 had lesser encounter costs (p<.05)
and higher net revenues (p<.01). Centers with more prenatal care patients had greater encoun-ter costs (p<.001), greaencoun-ter medical encounencoun-ter costs (p<.001), greater self-suffi ciency (p<.01), and greater net revenues (p<.01).
Centers receiving grant revenues had greater encounter costs (p<.05), lesser MLP productivity (p<.001), lesser self-suffi ciency (p<.001), and lesser net revenues (p<.05).
MD productivity was associated with lesser medical encounter costs (p<.05), greater per-sonnel costs (p<.05), and greater medical personnel costs (p<.01). MLP productivity was associated with lesser encounter costs (p<.001), lesser medical encounter costs (p<.001), greater medical personnel costs (p<.001), and lesser net revenues (p<.05).
Discussion
From 1998 to 2004, grant revenues (from all sources) decreased, Medicaid enues decreased (although Medicaid rev-enue increased to 36 percent in 2005), costs (encounter costs and medical personnel costs) increased, and physician productiv-ity decreased for HCs. However, increases in Medicaid collections and non-grant rev-enue sources allowed net revrev-enue to increase in each of the seven years. The decline in grant revenues was particularly striking for urban HCs, whose decreases occurred at a more drastic rate than rural HCs. In addition, while average collection rates were typically lower for rural centers (with the exception of self-pay), average rates for rural private
pay encounters passed urban rates for the fi rst time in 2004. Urban center administra-tors facing declining grant and private payer revenues are challenged by an inability to maintain fi nancial solvency.
When considering self-suffi ciency, urban centers’ self-suffi ciency lagged behind rural centers’ self-suffi ciency during the 1998 to 2003 time periods; however, urban HCs saw a positive trend over the entire study period while rural HCs experi-enced volatility. Average total and medical costs increased and provider productivity decreased for both rural and urban cent-ers during each year of the study period, posing a two-edged challenge to center self-suffi ciency. However, as average encounter costs for rural HCs approached those of urban HCs in 2002, and as rural average provider productivity decreased to a rate closer to that of urban, urban center suffi ciency passed rural center suffi ciency in 2004. Rural center adminis-trators and policy-makers should explore reasons for declines in self-suffi ciency as well as reasons why urban HCs appear to have been more successful in maintaining and growing self-suffi ciency.
While the increases in net revenue and general improvements in self-suffi ciency are encouraging, not all health centers fared well. Of particular note are HCs that received grant revenues. As the percentage of grant revenues from federal, state, local, or private sources increased, encounter costs increased, mid-level provider productivity decreased, and net revenues declined. Self-suffi ciency for these centers also decreased.
One possible explanation for the fi nancial distress of some HCs is that service inten-sity and delivery increased with more grant revenues. Centers could expand their scope
16 JOURNALOFHEALTH CAREFINANCE/SPRING 2009
of work, taking more time with patients and thereby decreasing productivity and increas-ing encounter costs (fewer patients per hour divided into more expensive scope of serv-ices). Mid-level providers, for example, may be providing more comprehensive services. A second explanation may be that health centers use a signifi cant portion of these grant revenues to provide enabling services for their patients. A third explanation may be that these funds are used to support non-clinical activities provided by support staff. If these explanations are true, then center administra-tors and policy-makers should not overlook the importance of operating revenues to the center’s overall fi nancial health. After all, grants often don’t pay full costs, consume valuable time of clinical and other staff in program design and implementation, have limited lives, and, if funds aren’t advanced, will consume cash needed to carry the grant receivable. Centers should prioritize devel-opment and new business opportunities.
Centers participating in managed care contracts on any of the three levels of vol-ume/revenues (HVHR, HVLR, and LVLR) showed decreased net revenues. The only net revenue exceptions to this fi nding are centers that were in their fi rst year of managed care participation—although these centers also showed increased costs and decreased pro-ductivity across the board. While continuing to serve as a provider to Medicaid enrollees in a managed care environment is important, administrators should give full consideration to the impact of decreased reimbursements and increased administrative costs, and to the ability to offset these losses with other sources of revenue. Centers have little choice but to play or lose Medicaid share. Acting collectively to infl uence the state Medicaid managed care environment may be their best
strategy. Policy makers are likely to be partic-ularly interested in the comparison between HVHR centers and HVLR centers to assess the potential impact of low managed care rev-enue on fi nancial and clinical performance.
As one might expect, HCs that offered enabling services had correspondingly higher costs. Interestingly, personnel costs were lower for these centers. Finding the balance between enabling services and fi scal sustainability is a constant challenge for HC administrators.
When considering provider productivity, results were mixed. Physician productiv-ity was associated with decreased medical encounter costs, but also with increased per-sonnel costs (general and medical). Mid-level provider productivity was associated with decreased costs (overall encounter and medi-cal); however, this variable was also associ-ated with increased medical personnel costs and decreased net income. Apparently, the cost benefi ts of mid-level provider salaries were not realized in terms of net income. Pro-ductivity, while an important goal for medical personnel, must be tempered with the fi nan-cial ability of the center to provide services.
self-suffi ciency. These three characteristics highlight the importance of having an ade-quate number of clients with ample revenue streams. Administrators should seek to offer services that generate positive revenue, are low in cost, and high in demand. While cent-ers operating in their fi rst year of a managed care contract also had positive fi nancial out-comes (increased net revenues), the poten-tial for declining net revenues in consecutive years must be carefully considered.
This study appears to support the concerns stated by the IOM in 2000. The increasing number of uninsured continues to overwhelm the ability of HCs, and the safety net in gen-eral, to manage scarce resources while meet-ing need. Medicaid managed care contributes to the fi nancial diffi culties by cutting non-grant revenue sources—an affect that is mag-nifi ed by the decrease in available subsidies for charity care. While administrators and policy makers should continue to seek new grant alternatives to offset operating losses and administrative expenses, the goal should be to maintain or expand services within the constraint of fi nancial self-suffi ciency. Limitations
Administrators and policy-makers should keep in mind the limitations of this study prior to implementing interventions based on these results. First, the level of managed care
participation and reimbursements are chang-ing and should be monitored. As states face increasing numbers of uninsured and move to implement coverage strategies, the effect on the fi nancial health of HCs will change. Second, changes to the collection and cat-egorization of data points can confuse fi nd-ings. For example, dollars that are classifi ed as service revenues in one time period may be accounted for as grant revenues in another time period. Third, this study is limited by the application of secondary data. HCs’ serv-ices to vulnerable populations are likely to be infl uenced by other external and internal factors such as community characteristics, features of managed care, management char-acteristics, infl uence of the board, practice characteristics, and the culture of the center. Future attention to these other variables could enlighten this analysis and amplify its interpretation. Fourth, the negative fi nancial fi ndings related to managed care participa-tion do not suggest that HCs are abdicating their mission; rather, it is a warning to health centers that their mission could be jeopard-ized when trying to protect Medicaid market share in a managed environment. Finally, those centers that were operating during some portion of the seven-year period and were fi nancially stressed may not have been present for the entire study period due to a lack of fi nancial viability.
Financial Performance and Managed Care Trends of HCs 17
REFERENCES
1. US General Accounting Offi ce (GAO), “Com-munity Health Centers: Adapting to changing health care environment key to continued success,” GAO/HEHS-00-39, 2000, Wash-ington, DC; Freeman, HE, Kiecolt, KJ, and HM Allen, “Community Health Centers:
An initiative of enduring utility,” Milbank
Quarterly , 1982, 60: 245–267; Gardner, RJ,
“National health care reform and
commu-nity and migrant health centers,” Journal of
Health Care for the Poor and Underserved , 1993, 4: 268–271.
2. McAlearney, JS, “The Financial Performance of Community Health Centers, 1996–1999,”
18 JOURNALOFHEALTH CAREFINANCE/SPRING 2009
4. Supra , n.2.
5. Cooper, PF and J Vistnes, “Workers’ Decisions to Take-Up Offered Health Insurance Cov-erage: Assessing the Importance of
Out-of-Pocket Premium Costs,” Medical Care , 2003,
41(7): Supplement III 35–43; Cooper, PF and BS Schone, “More Offers, Fewer Takers For Employment-Based Health Insurance: 1987
and 1996,” Health Affairs , 1997, 16:142–
149; Eisenberg, JM and EJ Power, “Transform-ing Insurance Coverage Into Quality Health
Care,” JAMA , 2000, 284:2100–2107.
6. Felland, LE, Lesser, CS, Staiti, AB, Katz, A, and P Lichiello, “The Resilience of the Health
Care Safety Net,” Health Services Research ,
2003, 38: 1, Part II.
7. Hawkins, Jr., D and R Schwartz, “Health Centers and the States: Partnership Potential to Address
the Fiscal Crisis,” Journal of Ambulatory Care
Management , 2003, 26 (4): 285–295.
8. Shi, L, Politzer, RM, Regan, J, Lewis-Idema, D, and M Falik, “The Impact of Managed Care on the Mix of Vulnerable Populations Served
by Community Health Centers,” Journal of
Ambulatory Care Management , 2001, 24 (1): 51–56.
9. Supra , n.2.
10. Stacy, NL, “The Experience and Performance of Community health Centers Under
Man-aged Care,” The American Journal of
Man-aged Care , 2000, 6 (11): 1229–1239. 11. Sparer, MS, Brown, LD, Gusmano, MK, Rowe,
C, and BH Gray, “Promising Practices: How Leading Safety-Net Plans Are Managing The
Care of Medicaid Clients,” Health Affairs ,
2002, 21 (5): 284–291; Finance, Systems, and Budget Group (FSBG), Centers for Medicare & Medicaid Services (CMS), “Medicaid Man-aged Care Enrollment Report, Summary Statis-tics as of June 30, 2005,” Baltimore, MD. 12. US General Accounting Offi ce (GAO),
“Commu-nity Health Centers: Competition for grants and efforts to measure performance have increased,” GAO-05-645, 2005, Washington, DC.
13. Korenbrot, CC, Miller, G, and J Greene, “The Impact of Medicaid Managed Care on Community Clinics in Sacramento County,
California,” American Journal of Public
Health , 1999, 89: 913–917; Cunningham, PJ, “Pressures on Safety Net Access: The Level
of Managed Care Penetration and
Uninsur-ance Rate in a Community,” Health
Serv-ices Research , 1999, 34: 255–270; Feldman, R, Baxter, R, and R Omata, “Staying in the Game: Health System Change and Challenges in Caring for the Poor,” presented at the meet-ing of Analysis of Health Systems in 12 Com-munities, Center for Studying Health System Change, September, 1997, Washington, DC; Lipson, DJ and N Naierman, “Safety-Net
Pro-viders,” Health Affairs , 1996, 15: 33–48.
14. Supra , n.10.
15. Supra , n.2; Hoag, SD, Norton, SA, and S Rajan,
“Federally Qualifi ed Health Centers: Surviving Medicaid Managed Care, But Not Thriving,”
Health Care Financing Review , 2000, 22 (2): 103–123.
16. Korenbrot, CC, Miller, G, and J Greene, “The Impact of Medicaid Managed Care on Commu-nity Clinics in Sacramento County, California,”
American Journal of Public Health , 1999, 89: 913–917; Cunningham, PJ, “Pressures on Safety Net Access: The Level of Managed Care Penetration and Uninsurance Rate in a
Com-munity,” Health Services Research , 1999, 34:
255–270; Lipson, DJ, “Medicaid Managed Care and Community Providers: New
Part-nerships,” Health Affairs , 1997, 16: 91–107;
Holahan, J, Zuckerman, S, Evans, A, and S Rangarajan, “Medicaid Managed Care in
Thirteen States,” Health Affairs , 1998, 17: 43–63.
17. Korenbrot, CC, Miller, G, and J Greene, “The Impact of Medicaid Managed Care on Community Clinics in Sacramento County,
California,” American Journal of Public
Health , 1999, 89: 913–917; Cunningham, PJ, “Pressures on Safety Net Access: The Level of Managed Care Penetration and
Uninsur-ance Rate in a Community,” Health Services
Research , 1999, 34: 255–270; Lewis-Idema, D, Chu, Hughes, R, and B Lefkowitz, “FQHC: Harnessing the Incentives of Cost
Reimburse-ment,” Journal of Ambulatory Care
Manage-ment , 1998, 21 (2): 58–75.
18. Shi, L, Politzer, RM, Regan, J, Lewis-Idema, D, and M Falik, “The Impact of Managed Care on the Mix of Vulnerable Populations Served
by Community Health Centers,” Journal of
Financial Performance and Managed Care Trends of HCs 19
19. Rosenbaum, S, Shin, P, and J Darnell, “Eco-nomic Stress and the Safety Net: A Health Center Update,” 2004, [accessed on February
15, 2007], available at http://www.kff.org/
uninsured/7122.cfm.
20. Supra , n.10.
21. Supra , n.2.
22. Hoadley, JF, Felland, LE, and AB Staiti, “Fed-eral Aid Strengthens Health Care Safety Net: The Strong Get Stronger,” 2004, [accessed on
February 15, 2007], available at http://www.
hschange.com/CONTENT/669/.
23. Supra , n.19.
24. Supra , n.2.
25. Sparer, MS, Brown, LD, Gusmano, MK, Rowe, C, and BH Gray, “Promising Practices: How Leading Safety-Net Plans Are
Manag-ing The Care of Medicaid Clients,” Health
Affairs , 2002, 21 (5): 284–291; Finance, Systems, and Budget Group (FSBG), Centers for Medicare & Medicaid Services (CMS), “Medicaid Managed Care Enrollment Report, Summary Statistics as of June 30, 2005,” Bal-timore, MD; Korenbrot, CC, Miller, G, and J Greene, “The Impact of Medicaid Managed Care on Community Clinics in Sacramento
County, California,” American Journal of
Public Health , 1999, 89: 913–917; Cunning-ham, PJ, “Pressures on Safety Net Access: The Level of Managed Care Penetration and
Uninsurance Rate in a Community,” Health
Services Research , 1999, 34: 255–270; Feld-man, R, Baxter, R, and R Omata, “Staying in the Game: Health System Change and Chal-lenges in Caring for the Poor,” presented at the meeting of Analysis of Health Systems in 12 Communities, Center for Studying Health System Change, September, 1997, Washington, DC; Lipson, DJ and N
Naier-man, “Safety-Net Providers,” Health Affairs ,
1996, 15: 33–48; Hoag, SD, Norton, SA, and S Rajan, “Federally Qualifi ed Health Centers: Surviving Medicaid Managed Care, But Not
Thriving,” Health Care Financing Review ,
2000, 22 (2): 103–123; Lipson, DJ, “Medic-aid Managed Care and Community Providers:
New Partnerships,” Health Affairs , 1997, 16:
91–107; Holahan, J, Zuckerman, S, Evans, A, and S Rangarajan, “Medicaid Managed
Care in Thirteen States,” Health Affairs , 1998,
17: 43–63; Lewis-Idema, D, Chu, Hughes, R, and B Lefkowitz, “FQHC: Harnessing the
Incentives of Cost Reimbursement,” Journal
of Ambulatory Care Management , 1998, 21 (2): 58–75; Felt-Lisk, S, McHugh, M, and E Howell, “Monitoring Local Safety Net Pro-viders: Do They Have Adequate Capacity?”
Health Affairs , 2002, 16 (4): 277–283; Bren-nan, N, Guterman, S, and S Zuckerman, “How Are Safety Net Hospitals Responding to Health Care Financing Changes?” 2001a, [accessed February 15, 2007], available at
http://www.kff.org/insurance/2250-index.
cfm ; Brennan, N, Guterman, S, and S
Zucker-man, “The Health Care Safety Net: An Over-view of Hospitals in Five Markets,” 2001b, [accessed February 15, 2007], available at
http://www.kff.org/insurance/2251-index.
cfm ; Zuckerman, S, Bazzoli, G, Davidoff, A,
and A LoSasso. “How Did Safety Net
Hospi-tals Cope in the 1990s?” Health Affairs , 2001,
20 (4): 159–168; Meyer, JA, Legnini, MW, and EK Waldman. “Current Policy Issues Affecting Safety Net Providers,” 1999, Washington, DC: Economic and Social Research Institute; Fag-nani, L, Singer, I, Cordova, M, and B Carrier, “America’s Safety Net Hospitals and Health Systems: Results of the 1998 Annual NAPH Member Survey,” 2000, Washington, DC: National Association of Public Hospitals and Health Systems; Baxter, RJ, and RL Feldman, “Staying in the Game: Health System Change Challenges for the Poor, Research Report,” 1999, Washington, DC: The Center for Study-ing Health System Change.
26. Abrams, R, Savela, T, Trinity, MT, Falik, M, Tutunjian, B, and C Ulmer, “Performance of Community Health Centers Under Managed
Care,” Journal of Ambulatory Care
Manage-ment , 1995, 18: 77–88.
27. Zarabozo, C, Taylor, C, and J Hicks, “Medicare
Managed Care: Numbers and Trends,” Health
Care Financing Review , 1996, 17: 243–261; Iglehart, JK, “The American Health Care
Sys-tem: Managed Care,” The New England
Jour-nal of Medicine , 1992, 331: 63–67; Hoy, EW, Curtis, RE, and T Rice, “Change and Growth
in Managed Care,” Health Affairs , Winter,
20 JOURNALOFHEALTH CAREFINANCE/SPRING 2009
Cost Savings Potentia,” 1994, Medical Care
Review , 51: 125–148; Gold, MR, “HMOs
and Managed Care, ” Health Affairs , Winter,
1991, 189–206; Feldman, H, Kiecolt, KJ, and HM Allen, 1982, “Community Health
Cent-ers: An Initiative of Enduring Utility,” Milbank
Quarterly , 60: 245–267; Iglehart, JK, “The Struggle Between Managed Care and
Fee-for-service Practice,” The New England Journal of
Medicine , 1994, 331: 63–67.
28. Hoy, EW, Curtis, RE, and T Rice, “Change and
Growth in Managed Care,” Health Affairs ,
Winter, 1991, 18–36.
29. Shi, L, Frick, KD, Lefkowitz, B, and J Tillman, “Managed Care and Community Health
Cent-ers,” Journal of Ambulatory Care Management ,
2000, 23: 1–22; Shi, L, Samuels, ME, Konrad, TR, Porter, CQ, Stoskopf, CH, and DL Rich-ter, “Rural Primary Care Program Survival: An
Analysis of Financial Variables,” The Journal of
Rural Health , 1994, 10 (3): 173–182; Mullner, RM, “Rural Hospitals Survival: An Analysis of Facilities and Services Correlated with Risk of
Closure,” Hospital and Health Services
Admin-istration , 1990, 35 (1): 121–137; Mullner, RM, Rydman, RJ, Whiteis, DG, and RF Rich, “Rural Community Hospitals and Factors Correlated
with Their Risk of Closing,” Public Health
Reports , 1989, 104 (4): 315–325; Walleck,
SS and SE Kretz, Rural Medicine: Obstacles
and Solutions for Self-Suffi ciency , 1981, Lex-ington: Lexington Books; Fieldman, R, Dietz, D, and EF Brooks, “The Financial Viability of
Rural Primary Care Health Centers,” American
Journal of Public Health , 1978, 68 (10): 981– 988; Rosenblatt, RA and I Moscovice, “The growth and Evolution of Rural Primary Care Practice: The National Health Service Corps
Experience in the Northwest,” Medical Care ,
1978, 16 (10): 819–827.
30. Health Services Research Center, University of North Carolina, “National Evaluation of Rural Primary Health Care Programs,” Report to the Robert Wood Johnson Foundation, 1983, Chapel Hill, NC: University of North Carolina.
31. Walleck, SS and SE Kretz, Rural Medicine:
Obstacles and Solutions for Self-Suffi ciency , 1981, Lexington: Lexington Books; Fieldman, R, Dietz, D, and EF Brooks, “The Financial
Viability of Rural Primary Care Health
Cent-ers,” American Journal of Public Health ,
1978, 68 (10): 981–988; Rosenblatt, RA and
I Moscovice, Rural Health Care , New York:
John Wiley & Sons, 1982; Rosenblatt, RA and I Moscovice, “The growth and Evolution of Rural Primary Care Practice: The National Health Service Corps Experience in the
North-west,” Medical Care , 1978, 16 (10): 819–827.
32. Table 9E from UDS.
33. Id.
34. Hadley, J, Mullner, R and J Felder, “The
Financially Distressed Hospital,” The New
England Journal of Medicine , 1982, 307 (20): 1283–1287; Kilstein, SM, Sanders, CR, and GJ Schieber, “An Analysis of Hospital
Finan-cial Distress,” Journal of Contemporary
Busi-ness , 1980, 9 (4): 55–56.
35. Supra , n.30.
36. Rosenblatt, RA and I Moscovice, “The growth and Evolution of Rural Primary Care Practice: The National Health Service Corps
Experi-ence in the Northwest,” Medical Care , 1978,
16 (10): 819–827; Frech, HE and PB Gins-burg, “Optimal Scale in Medical Practice: A
Survival Analysis,” Journal of Business , 1974,
47 (1): 23–36; Golladay, FL, Manser, ME, KR Smith, “Some Economics in the Delivery of Medical Care: A Mixed Integer Programming Analysis of Effi cient Manpower Utilization,”
Journal of Human Behavior , 1974, 9 (1): 50–62.
37. Samuels, ME and L Shi, “Survey of Commu-nity and Migrant Health Centers Regarding Utilization of Nurse Practitioners, Physicians Assistants, and Certifi ed Nurse Midwives,” 1992, Kansas City, Missouri: National Rural Health Association.
38. Supra , n.30.
39. Ginn, GO and GJ Young, “Organizational and Environmental Determinants of
Hospi-tal Strategy, ” Hospital and Health Services
Administration , 1992, 37 (3): 291–302. 40. Kronick, R, Goodman, DC, Wennberg, J, and
E Wagner, “The Marketplace in Health Care Reform: The Demographic Limitations of
Managed Competition,” The New England
Journal of Medicine , 1993, 328: 148–125. 41. (Wellever and Deneen 1994; Kronick et al.
A, V Deneen, “Managed Health Care Reform and Rural Areas: Literature Review and Syn-thesis,” University of Minnesota, AHCPR Rural Center, Contract Report, 1994; Kronick, R, Goodman, DC, Wennberg, J, and E Wagner, “The Marketplace in Health Care Reform: The Demographic Limitations of Managed
Competition,” The New England Journal of
Medicine , 1993, 328: 148–125; Uder, JM and Colebaugh, JB, “A Provisional Framework for the Economic Analysis of Managed Care Development in Rural Areas,” New York Rural Health Research Center Working Paper No. 12, State University of New York at Buffalo, Department of Family Medicine, 1996. 42. Table 6 from UDS.