Refer to Important disclosures in the last page of this report
Stock DataTarget price (Rp) Rp1,250
Prior TP (Rp) Rp1,370
Encore Energy PTE LTD 35.7%
Credit suisse Group 20.7%
Mitsubishi UFJ 15.0%
Net profit declined by 50% but EBIT/EBITDA was up by 50%/86%.
Margins expansion due to higher ASP both oil and gas.
Amman’s phase 7 development is on track.
Maintain Buy with lower TP of Rp1,250 (from Rp1,370).
Net profit declined by 50.4% yoy.
Medco Energi Internasional posted net profit
amounted to US$41.4mn, down 48.6% yoy. Forming only 23.3%/17.3% of
ours/consensus FY18 estimates. Nevertheless, revenue increased by 42.4% yoy
to US$578.6mn (c. 55% to our FY18 estimates) while EBITDA and operating profit
grew by 50.5% yoy and 86.7% yoy. Earnings was mainly dragged by tax expense
that inclined by 60% yoy as the tax rate stood at 65.3% in 1H18 (vs. 40.5% in
1H17). On quarterly basis, net profit decreased by 41.2% qoq to US$15.3mn
albeit its operating profit and EBITDA grew by 16.2% qoq and 4.3%. Amman still
recorded a net loss of some US$10.6mn due to lower production volume with
higher stockpiles content that erode Amman’s overall margins.
Operational margins expand due to higher ASP.
On operational data, the
company posted relatively stable production rate with oil and gas production was
stood at 82.4 mboepd in 1H18. But the company optimists they could meet their
production target of around 85 mboepd as Block A Aceh gas sales will ramp up in
early August 2018. MEDC posted higher ASP with average realized prices were
US$66.8/bbl (+35.4%yoy) for oil and US$6/mmbtu (+8.6% yoy) for gas. Oil and
gas unit cash costs were US$8.5/bbl, in line with company’s target to maintain
unit cash costs below US$10/bbl. This led the company posted better margins in
1H18, with operating margin of 31.9% (+990bps) and EBITDA margin of 49.3%
(+280bps). Medco Power Indonesia’s gross installed capacity rose 20% yoy to
2,795MW in 1H18 following commercial operation in May of the third and final unit
of phase one of the Sarulla Geothermal facility.
Positive progress from phase 7 development.
In 1H18 AMNT has ramped up
phase 7 developments to full capacity and secured its first facility from an
international bank. Amman is in the process of appointing the smelter Front End
Engineering and Design contractor. Operational wise, Amman’s copper/gold
production decreased by 45.8%/77.5% yoy, respectively in 1H18.
Maintain Buy.
We trim our earnings forecasts for 2018F by 42.6% to US$102mn
as we revise up our tax rate assumption from previously 50% to 65% in 2018F.
Downward revisions on our earnings forecasts has led to our DCF-based TP
Source: MEDC, IndoPremier Share Price Closing as of : 2-August-2018
MEDC IJ Results Note
2
Refer to Important disclosures in the last page of this report
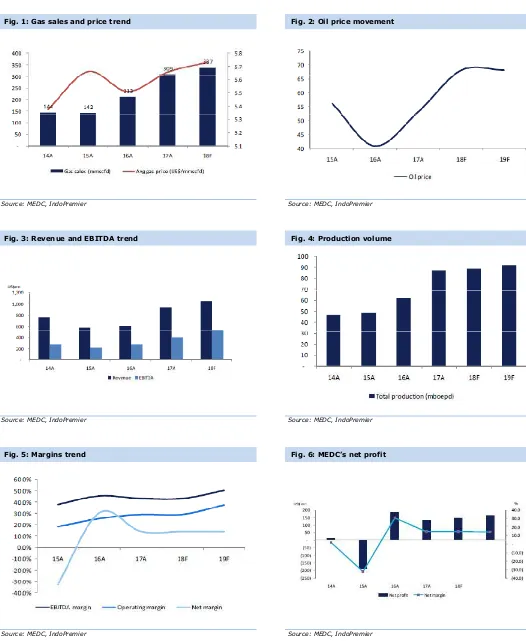
Fig. 1: Gas sales and price trend Fig. 2: Oil price movement
Source: MEDC, IndoPremier Source: MEDC, IndoPremier
Fig. 3: Revenue and EBITDA trend Fig. 4: Production volume
Source: MEDC, IndoPremier Source: MEDC, IndoPremier
Fig. 5: Margins trend Fig. 6: MEDC’s net profit
3
Refer to Important disclosures in the last page of this report
Year To 31 Dec (US$Mn) 2016A 2017A 2018F 2019F 2020F
Cash & Equivalent 231 661 477 477 360
Receivable 535 635 678 767 857
Inventory 70 89 82 85 86
Other Current Assets 298 590 572 556 540
Total Current Assets 1,134 1,975 1,809 1,885 1,843
Fixed Assets - Net 926 1,176 1,082 726 627
Goodwill 0 0 0 0 0
Non Current Assets 499 1,033 1,156 1,174 1,191
Total Assets 3,597 5,161 5,036 4,779 4,658
ST Loans 16 42 42 42 42
Payable 105 140 0 141 143
Other Payables 345 747 174 181 184
Current Portion of LT Loans 395 365 500 250 0
Total Current Liab. 861 1,294 851 614 369
Long Term Loans 1,522 2,182 2,197 2,161 2,125
Other LT Liab. 324 283 688 567 585
Total Liabilities 2,707 3,758 3,735 3,342 3,079
Equity 256 499 499 499 499
Retained Earnings 631 672 656 793 935
Minority Interest 3 145 145 145 145
Total SHE + Minority Int. 891 1,316 1,301 1,437 1,579
Total Liabilities & Equity 3,597 5,074 5,036 4,779 4,658
MEDC IJ Results Note
4
Refer to Important disclosures in the last page of this report
Year to 31 Dec 2016A 2017A 2018F 2019F 2020F
Cash Flow
Net Income (Excl.Extraordinary&Min.Int) 185 132 102 161 180
Depr. & Amortization 263 96 (26) 391 135
Changes in Working Capital (306) 169 (332) (81) (86)
Others 2 71 (141) (101) 166
Cash Flow From Operating 157 492 (398) 369 394
Capital Expenditure (86) (879) (3) (53) (52)
Others (547) (13) 205 67 67
Cash Flow From Investing (634) (892) 202 13 15
Loans 353 656 149 (286) (285)
Equity (1) 194 0 0 0
Dividends 45 (46) (33) (26) (41)
Others (166) (28) 296 (331) (201)
Cash Flow From Financing 231 776 412 (643) (527)
Changes in Cash (245) 375 216 (261) (118)
Financial Ratios
Gross Margin (%) 41.7 45.5 50.5 50.6 51.6
Operating Margin (%) 25.5 29.1 37.2 37.3 38.3
Pre-Tax Margin (%) 43.4 31.9 28.0 29.5 32.0
Net Margin (%) 30.8 14.2 9.7 14.7 15.9
ROA (%) 5.7 3.0 2.0 3.3 3.8
ROE (%) 23.2 11.9 7.8 11.7 11.9
ROIC (%) 7.5 5.0 4.2 5.9 6.7
Acct. Receivables TO (days) 85.6 74.8 74.2 88.5 108.4
Acct. Receivables - Other TO (days) 144.2 155.9 154.4 152.7 153.2
Inventory TO (days) 6.3 6.3 6.1 6.5 6.4
Payable TO (days) 95.1 88.4 96.7 93.3 94.4
Acct. Payables - Other TO (days) 92.4 99.2 77.9 34.3 34.7
Debt to Equity (%) 217.1 196.7 210.5 170.6 137.3
Interest Coverage Ratio (x) 0.7 0.5 0.5 0.5 0.5
Net Gearing (%) 198.6 159.5 175.9 139.2 116.1
Head Office
PT INDO PREMIER SEKURITAS
Wisma GKBI 7/F Suite 718
Jl. Jend. Sudirman No.28
Jakarta 10210 - Indonesia
p +62.21.5793.1168
f +62.21.5793.1167
INVESTMENT RATINGS
BUY : Expected total return of 10% or more within a 12-month period HOLD : Expected total return between -10% and 10% within a 12-month period SELL : Expected total return of -10% or worse within a 12-month period
ANALYSTS CERTIFICATION.
The views expressed in this research report accurately reflect the analysts personal views about any and all of the subject securities or issuers; and no part of the research analyst's compensation was, is, or will be, directly or indirectly, related to the specific recommendations or views expressed in the report.
DISCLAIMERS