2-D Resistivity Structure of Cubadak Geothermal
Area Revealed from Magnetotelluric Data
To cite this article: Hezliana Syahwanti et al 2017 IOP Conf. Ser.: Earth Environ. Sci.62 012034
View the article online for updates and enhancements.
Magnetotelluric Data Applied in Volcano-Geothermal Area In Central Java, Indonesia
Elsi Ariani and Wahyu Srigutomo
Resistivity Image from 2D Inversion of Magnetotelluric Data in the Northern Cascadia Subduction Zone (United States)
F B Gultom, S W Niasari and E Hartantyo
-Dimensionality and regional strike analyses of the Cibeber segment, Cimandiri fault zone, West Jawa, Indonesia
F Febriani, L Handayani, A Setyani et al.
2-D Resistivity Structure of Cubadak Geothermal Area
Revealed from Magnetotelluric Data
Hezliana Syahwanti1, Wahyu Srigutomo1, Muhammad Kholid2
1Physics of Earth and Complex System, Faculty of Mathematics and Natural Sciences,
Institut Teknologi Bandung
2Subsurface Research Group, PSDG Bandung
E-mail: [email protected]
Abstract. Cubadak area in Pasaman Regency, West Sumatra, Indonesia is one of many potential
geothermal areas in Indonesia. This paper deals with resistivity structure beneath Cubadak area obtained from magnetotelluric data. The subsurface resistivity image of Cubadak reveals the components of Cubadak geothermal system clearly such as the altered clay having very low resistivity values, the possible reservoir zone having intermediate resistivity values underlying the altered clay as well as the indication of geological structures controlling the system. The top boundaries of the reservoir vary from elevation of 250 m to -500 m above sea level.
1. Introduction
Indonesia has abundant potential geothermal energy resources [1] due to its position as the meeting zone of 3 major tectonic plates (Indo-Australia, Eurasia and Pacific plates). One of them is located in Cubadak, Pasaman Regency, West Sumatera (Figure 1), situated at 597600 mE – 617700 mE and 21200 – 42500 mN [2]. The geothermal potential in Cubadak is indicated by surface manifestations such as Cubadak hot spring and Sawah Mudik hot spring. Therefore, it is important to provide information on the physical properties of Cubadak geothermal system in order to delineate the presence of its cap rock, reservoir and heat source as well as geological structures that may control the system. Resistivity method, like magnetotelluric method, is highly effective for such purpose due to its high sensitivity to detect resistivity contrasts that characterize the subsurface structure of a geothermal system.
Magnetotelluric (MT) method is a geophysical exploration method that uses natural electromagnetic (EM) wave as the source [3,4] and it is used for subsurface resistivity distribution mapping. In the data acquisition step, the EM responses are measured in time domain then they are converted into the frequency domain.
The EM sources in MT method come from the interaction between solar wind and magnetosphere for low frequency (f<1 Hz) and the thunder storms in ionosphere for the high frequency (f>1 Hz) [3]. The receiver records MT responses in terms of electric field (E) and magnetic field (H) at the surface [3]. The ratio between variation of electric field and magnetic field is called impedance (Z).
2
absolute impedance divided by omega time vacuum permittivity. Phase value was obtained by arc tangential of comparison between imaginer and real of impedance.
Reservoir zones are found at a high-temperature geothermal system (Figure 2). The cooler zone at the upper layer is characterized by smectite alteration (formed at > 700 C) which is electrically conductive. In
higher temperature, illite is formed under smectite layer. Increasing temperature will increase the composition of illite but decrease the composition of smectite [5]. If temperature increases, smectite will decrease and then the pure illite is formed at the temperature more than 2200C. Clay and other alteration
minerals (chlorite, epidote, etc.) are also formed at high temperature in propylitic zone [5].
Figure 1. Location of Cubadak area, marked by red square (left) and it is zoomed in map (right) [2]
Figure 2. Scheme of the geothermal system [6]
2. Methodology
MT data acquisition was conducted in mid-2012 by Subsurface Research Group of Center of Geological Resources (PSDG), comprising 13 MT stations aligned in 2 parallel lines. At each stations, the total variation of electric in the magnetic field was recorded for about 18 hours. The above raw data were processed by using SSMT2000 software manufactured by Phoenix Geophysics to transform them into frequency domain expression in terms of apparent resistivities and phase of impedance as a function of frequency for each station. Further smoothing and editing of the apparent resistivity and phase of impedance were performed using MT Editor software develop by the same company. The final form of the data is manifested in EDI files ready for the inversion scheme.
The inversion of data into through resistivity model as a function of depth and horizontal distance (2-D Inversion) was performed by using WinGLink interpretation software. 2-D inversion uses nonlinear conjugate gradient inversion scheme [7]. The resulted 2-D resistivity sections were then interpreted as to identify the components of Cubadak geothermal system.
4 3. Results and Discussion
Figure 4 depicts two examples of data in terms of apparent resistivity and phase of impedance obtained in the field from MTCB 8 and MTCB 21 stations. The data generally can be categorized as having good or fair quantities. There are two sections obtained from the inversion scheme: Line 1 which comprises MTCB 7, MTCB 8, MTCB 9, MTCB 10, MTCB 11, MTCB 12, and MTCB 13 stations; and Line 2 which comprises MTCB 20, MTCB 21, MTCB 22, MTCB 23, MTCB 24, and MTCB 25 stations.
Figure 4. Apparent resistivity and phase of impedance profiles as function of period at MTCB 8 and MTCB 21
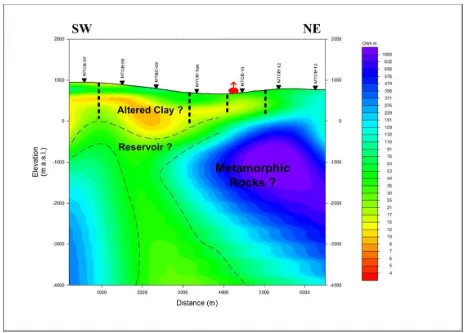
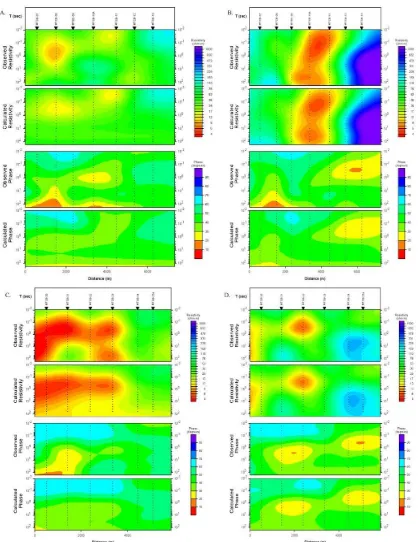
The resistivity section beneath Line 1 is shown in Figure 5 and for the Line 2 is shown in Figure 6. In general, the degree of acceptance of the modeled resistivity sections is judged by the fitness between the observed data and the calculated data from the inversion scheme. Figure 7 shows the comparison between the observed and calculated data for Line 1 and Line 2 in terms of pseudo sections of apparent resistivity and phase of impedance are relatively good as can be seen from the figure where both of pseudo sections are almost similar. However, the discrepancy between the observed and calculated phase of impedance is more obvious. Nevertheless, the modeled resistivity sections can be accepted to represent the resistivity structure beneath the two lines.
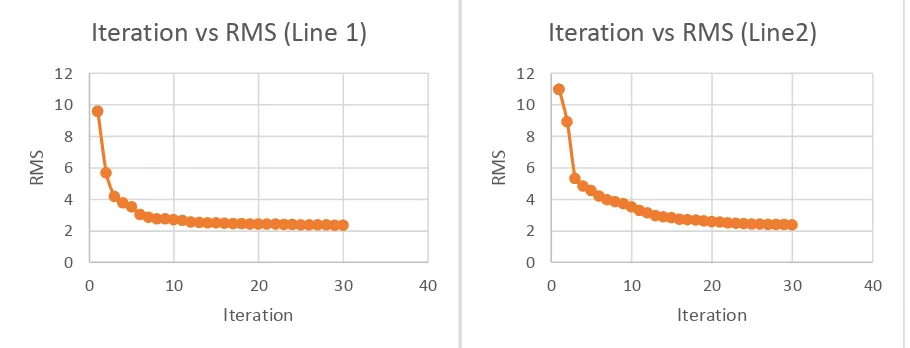
The root mean squares (RMS) misfit for both Line 1 and Line 2 inversions is shown in Figure 8. The RMS values converge towards a minimum value of about 2.3 at 30th iteration which is set as the maximum
iteration number.
interpreted as the pathway of thermal fluid that migrates to the surface and manifests as Cubadak hot spring. Cubadak hot spring is located at the NE end tip of the clay zone; this finding may be a strong evidence that the hot spring is situated within the outflow zone of the geothermal system. The high resistivity zone that is found below a moderately resistive overburden at the northeastern part of the resistivity section can be attributed to the presence of permo-carbon metamorphic rock as inferred from the geological map.
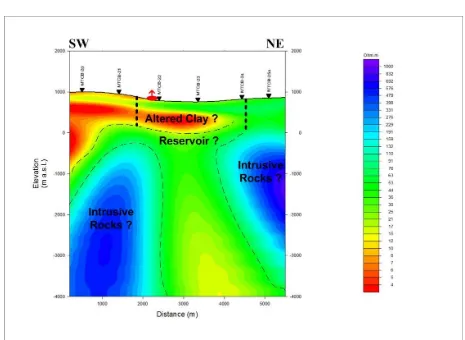
Beneath Line 2 a low resistivity zone below 10 Ωm spans from below MTCB 20 to an area between MTCB 23 and MTCB 24. This low resistivity zone is associated with the presence of impermeable altered clay. The Sawah Mudik hot spring is situated in the vicinity of MTCB 22. Underlying this low resistivity zone, a moderately resistive zone is found having resistivity values that vary from 20 to 70 Ωm which can be associated with the reservoir zone. The top boundaries of the reservoir vary from the elevation of 0 m to -1000 m above sea level suggesting shallow reservoir depths. Below the reservoir zone a high resistivity body exists indicating the presence of the hot intrusive rocks serving as the heat source of the Cubadak geothermal system. Judging from the shape of the altered clay and its related position from the interpreted heat source, the Sawah Mudik hot spring is located within the upflow zone of the Cubadak geothermal system.
6
8
Figure 8. Graphic of Iteration vs. RMS
4. Conclusions
Based on the 2-D resistivity section obtained from the inversion of the MT data and the geological map of Cubadak area, the geothermal system of Cubadak area can be identified as altered clay zone is found between MTCB 7 to MTCB 11 trending SW-NE; between MTCB 20 to MTCB 24 trending SW-NE. The top boundaries of the reservoir beneath the altered clay vary from 250 m to -1000 m above sea level. Then Cubadak hot spring is located in the outflow zone whereas the Sawah Mudik hot spring is located in the upflow zone of Cubadak geothermal system.
References
[1] Hermawan D and Rezky Y 2010 The Role of Sumatera Fault Structures in Appearance of Geothermal Features at Cubadak Area, West Sumatera, Indonesia Proceedings World Geothermal Congress 2010
[2] Tim Survey Magnetotellurik 2012 Survey Magnetotellurik Daerah Panas Bumi Cubadak Kabupaten Pasaman, Sumatera Barat Pusat Sumber Daya Geologi
[3] Simpson F and Bahr K 2005 Practical Magnetotellurics Cambridge University Press
[4] Manoj C 2003 Magnetotelluric Data Analysis Using Advances In Signal Processing Techniques [5] Anderson E, Crosby D and Ussher G 2000 Simple Resistivity Imaging To Reliably Locate The
Geothermal Reservoir Proceedings World Geothermal Congress 2000
[6] Pellerin L, Johnston J M and Hohmann G W 1996 A Numerical Evaluation Of Electromagnetic Methods In Geothermal Exploration Geophysics 61 121-130
[7] Rodi W L and Mackie R L 2001 Nonlinear Conjugate Gradients Algorithm For 2D Magnetotelluric Inversion Geophysics 66 174-187
[8] Tim Survei Terpadu 2008 Survey Terpadu Geologi, Geokimia, dan Geofisika Daerah Panas Bumi Cubadak, Kabupaten Pasaman, Provinsi Sumatera Barat Pusat Sumber Daya Geologi
![Figure 2. Scheme of the geothermal system [6]](https://thumb-ap.123doks.com/thumbv2/123dok/4048104.1991524/3.595.136.477.282.450/figure-scheme-geothermal.webp)
![Figure 3. Regional Geology Map of Cubadak [8]](https://thumb-ap.123doks.com/thumbv2/123dok/4048104.1991524/4.595.153.475.341.738/figure-regional-geology-map-cubadak.webp)