Spinning Induced Compression Strength of Precast Hollow
Concrete Piles
Budi, G.S.1*, Suseno, P.K.1,and Winata, S.K.1
Abstract: Prefabricated precast-hollow concrete pile is widely used as deep foundations due to its several benefits such as the uniformity in concrete quality and its durability. It is also called spun pile since the spinning method is utilized to compact the fresh concrete. During spinning, the fresh concrete is propelled outward due to centrifugal force, which generates a compaction process and develops a hollow in the center of the pile. Several factors, such as the rate of spinning, frequency, and duration of spinning, are affecting the quality of the pile. This paper presents the study of density and compressive strength of spun piles. The specimens were cored from the spun piles with diameter of 800 mm. The results show that the density and the compressive strength of the concrete at outer region of the spun pile are bigger than those at the inner side.
Keywords: Compressive strength; spun pile; spinning; centrifugal.
Introduction
The use of prefabricated precast concrete piles as deep foundations is preferable due to several reasons such as the uniformity of concrete quality, smooth external surface, high coefficient of impermeability, and its durability. In addition, the schedule of pile supply can be arranged to meet the progress of piling activity at a project so that the area at the project occupied by stock of piles can be optimized. Two types of prefabricated concrete piles are commonly produced in Indonesia, namely square and circular piles. The circular pile is also called spun pile since the spinning method is employed to make the concrete compact. During spinning, the fresh con-crete is propelled outward due to centrifugal force that generates a compaction process and creates a hollow in the center of the pile. The compaction method of spun precast concrete piles using cen-trifugal apparatus, which was designed specifically for this purpose, has been studied by Aya [1]. The duration and the frequency of spinning required to achieve minimum strength of concrete were studied.
The formula of centrifugal force (Fc), as presented in Equation 1, is a derivation of the Newton’s second law [2].
1 Department of Civil Engineering, Petra Christian University, Surabaya, INDONESIA.
*Corresponding author; e-mail: [email protected]
Note: Discussion is expected before November, 1st 2017, and will be published in the “Civil Engineering Dimension”, volume 20, num-ber 1, March 2018.
Received 26 January 2017; revised 08 August 2017; accepted 17 August 2017.
Fc = mω2r (1)
where:
Fc = centrifugal force m = mass
= angular velocity r = radius or distance
It is clear that, based on Equation 1, the magnitude of centrifugal force is governed by the mass of material. The larger the mass, the greater the force will be. The mass of Portland cement measured is 3.15 gr/cm3, while the density of coarse aggregates
(gravel) and fine aggregates (sand) are found to be 2.54 gr/cm3 and 2.56 gr/cm3, respectively, according
to Indonesian National Standards [3-5]. Since the mass of each ingredient of the concrete is different, the uniformity of concrete quality along the wall thickness of the spun pile might not be uniform. The outer region of concrete wall, presumably, will exhibit greater strength than that in the inner region due to concentration of Portland cement, which has the largest mass, generated during spinning.
According to Kuranovas and Kvedaras [6], density, water-cement ratio, and porosity of the fresh con-crete through-out the wall thickness of the concon-crete pile during spinning were not constant (not uniform). In addition, the variation of radial pressure across the thickness of the concrete generated during spin-ning was similar to the hydraulic pressure, which was triangular along the concrete thickness of the wall.
that needed to compact the fresh concrete. It was reported that the difference between concrete density at the inner side and that at the outer wall thickness of the spun–cast concrete depended on the com-pacting (spinning) energy. The difference of concrete density between inner and outer region expanded as the spinning energy increased. The increase of this gap was caused by segregation of the fresh concrete due to over compacting energy. It was also men-tioned that the ratio of the compressive strength of the spun-cast concrete at the outer region and that at the inner region was a function compaction ratio, and it could be presented in the form of polynomial regression.
As the compacting energy increases, the gap of con-crete strength between inner and outer region of spun pile increases. As a results, the concrete strength at the outer region increases and that at the inner region decreases. In other words, it can be said that the effective wall thickness of the spun pile decreases with the increase of compacting energy. This condition might lead to the reduction of the strength of the pile since the concrete region under non uniform stress, which is developed by eccen-tricity between the location of the predetermined pre-stressed steel bars and the reduction of effective wall thickness of the spun pile [7].
Objective
This paper presents the results of a preliminary study on the distribution of compressive strength of prefabricated concrete spun piles in Indonesia. The samples were collected by coring the concrete spun piles that had outer diameter of 800 mm. Wall thickness of the spun piles varied from 150 mm to 190 mm. During production process, the spun piles were compacted by means of spinning with the rate of about 1600 rpm (rotation per minute). The spun-cast concrete was designed to have compressive strength of 600 kg/cm2 (50 MPa).
Research Methodology
Two different orientations of sampling were perfor-med to collect concrete samples, namely parallel and perpendicular to the longitudinal axis of the piles. The longitudinal axis is defined as the axis that is parallel to the length of the pile. The diameter of all cored samples was 90 mm. The length of all parallel-specimens was 145 mm, while the length of speci-mens that perpendicular to the longitudinal axis varied from 125 mm to 180 mm.
Twenty specimens were cored perpendicularly to the longitudinal axis of pile from four different spun piles, namely pile A, B, C, and D. The wall thickness of spun pile A was 190 mm, pile B was 180 mm, pile C was 190 mm, and pile D was 150 mm. Meanwhile ten (10) parallel-specimens were cored from spun
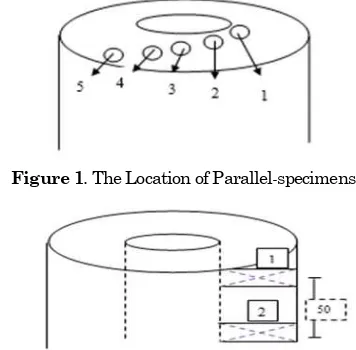
pile A and C. The coring location of parallel-speci-mens was arranged from the inner side/region to the outer side of the wall thickness of the spun pile, as illustrated in Figure 1. While the location of per-pendicular-specimens, that were cored perpendicular to the longitudinal axis, is depicted in Figure 2.
Figure 1. The Location of Parallel-specimens
Figure 2. The Location of Perpendicular-specimens Testing Preparation
All specimens were prepared and trimmed from the cored samples to flatten its edges. As mentioned previously, the length of all parallel-specimens was 145 mm. While the length of perpendicular-speci-mens varied from 125 mm to 180 mm. The perpen-dicular-specimens were prepared by trimming or
discarding the “weak” layer of the specimens, which
presumably located in the inner side of the wall of the spun piles. The thickness of the weak layer that was removed from the samples varied from 10 mm, 20 mm, 30 mm, and 40 mm, so that the shortest tested sample was very likely would exhibit the highest compressive strength. The data of all cored samples is presented in Table 1.
Table 1. Data of Cored Samples No Spun
X = sample taken parallel to longitudinal axis Y = sample taken perpendicular to the
longitu-dinal axis
A, B, C, D = sample taken from spun piles number A, B, C, and D
R = distance of sample from the longitudinal axis (the center of cross section of the pile)
n = number of sample
Correction Factors
The Indonesian National Standard SNI 03-3403-1994 [8] specifies three correction factors to deter-mine the strength of concrete core. The factors in-clude C0(Table 2) to accommodate the direction of sampling with respect to longitudinal axis (the length of concrete structures), C1 to accommodate the ratio between length and diameter of the specimen (Table 3), and C2to revise the compressive strength due to the existent of steel bar embedded in the cored specimen. However, factor C2 is not applicable to this study since there was no steel found in all specimens.
Table 2. Factor of C0, Direction of Coring [8]
Direction of coring C0
Horizontal (perpendicular to the length of
concrete structures) 1
Vertical (parallel to the length of concrete
structures) 0.92
Table 2 is not applicable for cored specimen with
length to diameter ratio 1.94 ≤H/D ≤ 2.1
Table 3. Factor of C1, Height to Diameter Ratio [8]
H/D C1
C1 is applicable for concrete that exhibits compressive strength between 13.8 MPa to 41.4 MPa
The compressive strength of concrete is then deter-mined as;
= C0x C1x f’c (2)
Where:
= corrected compressive strength of concrete
f’c = compressive strength of cored specimen
Analysis
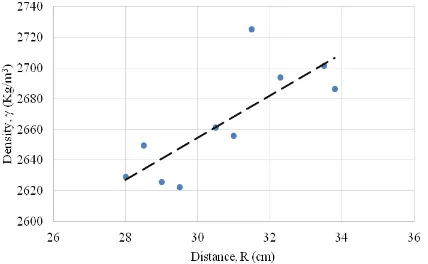
Table 4 and Table 5 show the results of tested parallel-specimens, which were cored from spun pile A and spun pile C, respectively. The variation of compressive strength of the specimens is quite large, that is ranging from 41.2 MPa to 53.2 MPa. The density of the specimens tends to increase with the distance from the longitudinal axis.
The relationship between the concrete density and the distance of cored specimen from the longitudinal axis (R) is presented in Figure 3. It shows that the farther the location of the cored specimen from the longitudinal axis (R), the higher the density of the
concrete (γ). However, there is no general tendency
of relationship between compressive strength and the distance (R) of cored samples (Figure 4). This might be caused by the non-uniformity of concrete strength along the thickness of the spun pile. Under the uniform compressive load, the failure initially occurred at the weaker region of the specimen. This assumption is also recognized from the failure pattern of the specimens during testing, where the failure occurred along the height of the specimen (or spalling failure) that might exhibit lower strength, as shown in Figure 5. Unfortunately, the location of failure with respect to the distance from the longitudinal axis of the spun piles was not recorded, so the orientation of non-uniformity of the concrete strength can not be determined. The relationship between concrete density and compressive strength of the specimens, which were tested parallel to the length of the spun piles (longitudinal axis), is depicted in Figure 6.
Table 4. Data of Tested Parallel-specimen Cored from Spun Pile A Specimen id* Weight
* : - Specimen XA-28.50 is the closest to the longitudinal axis with the distance of 28.50 cm - Specimen XA-33.80 is the farthest to the longitudinal axis with the distance of 33.80 cm ** : - C1 corresponds to H/D other than those listed in Table 3 is taken as linear interpolation Table 5. Data of Tested Parallel-specimen Cored From Spun Pile C
Figure 3. The Relationship between Concrete Density and its Distance from the Longitudinal Axis of the Piles (A and C)
Figure 4. The Relationship between Compressive Strength and its Distance from the Longitudinal Axis of the Piles (A and C)
Specimen XA 28.50 Specimen XC 31.00
Figure 5. Failure Pattern of the Tested Parallel-specimen (A and C)
Figure 6. The Relationship between Concrete Density and Its Compressive Strength (A and C)
Table 6 through Table 9 show the results of tested perpendicular-specimens, which were cored from spun pile A, B. C, and D. The relationship between the concrete density and the height (thickness) of the specimen is presented in Figure 7. It shows that in general, the shorter the specimens (H), the higher
the density of the concrete (γ). In other words, the
density of the samples at outer region of the concrete wall is larger than that at the inner region. This is consistent with the assumption that concrete at the outer region of the wall would exhibits higher den-sity than that at the inner region.
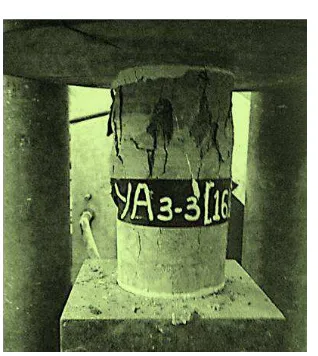
Figure 8 presents the trend of relationship between compressive strength and the height of the specimen (H). It shows that the variation of compressive strength of the specimens that have the same height is very large; however there is a tendency that the shorter specimens exhibit higher compressive strength. Strictly speaking, the compressive strength of concrete at the outer region of the spun pile is higher than that at the inner region. The crushing failure of the specimens during testing was noticed. The failure occurred at the top part of the specimen, which might exhibit lower strength than that at the lower part of the specimen, as depicted in Figure 9. Figure 10 shows the relationship between compres-sive strength of the specimen and its correlated density. It shows clearly that the compressive strength increases with the density of the specimen.
Figure 7. The Relationship between Concrete Density and the Height of the Specimen
Figure 9. Failure Pattern of Perpendicular Specimen YA 3-3
Figure 10. The Relationship between Concrete Density and Its Compressive Strength
Table 6. Data of the Tested Perpendicular Specimen Cored from Spun Pile A Specimen
id
Height of specimen (mm)
Weight (gr)
Concrete density,
γ (kg/m3)
Compressive
load (kN) H/D C0 C1
Corrected compressive
strength, σ (MPa)
YA 4-1* 180 3055 2667.9 360 2.00 1 1 56.6
YA 2-2 170 2845 2630.6 312 1.89 1 1 49.0
YA 3-3 160 2710 2662.4 355 1.78 1 1 55.8
YA 1-4 150 2581 2704.7 408 1.67 1 0.987 63.5
* Note for specimen YA 4-1
Y = specimen was cored perpendicular to the longitudinal axis (length of the spun pile) A = specimen was cored from spun pile A
4 = specimen number 4
1 = the inner region of the specimen was trimmed 10 mm to eliminate “weak” region Table 7. Data of the Tested Perpendicular Specimen Cored from Spun Pile B Specimen
id
Height of specimen (mm)
Weight (gr)
Concrete density,
γ (kg/m3)
Compressive
load (kN) H/D C0 C1
Corrected compressive
strength, σ (MPa)
YB 3-1 160 2685 2637.9 353 1.89 1 1 55.50
YB 2-2 150 2533 2654.4 345 1.78 1 1 54.20
YB 1-3 140 2392 2685.7 304 1.67 1 0.987 47.19
YB 4-4 130 2214 2677.0 298 1.56 1 0.969 45.41
RYB 4-4* 120 2040 2672.2 365 1.44 1 0.953 54.71
* = additional specimen
Table 8. Data of the Tested Perpendicular Specimen Cored from Spun Pile C Specimen
id
Height of specimen (mm)
Weight (gr)
Concrete density,
γ (kg/m3)
Compressive
load (kN) H/D C0 C1
Corrected compressive
strength, σ (MPa)
YC 4-1 180 3000 2619.8 283 2.00 1 1 44.50
YC 1-2 170 2855 2639.9 310 1.89 1 1 48.70
YC 2-3 160 2693 2645.7 270 1.78 1 1 42.40
YC 3-4 150 2510 2630.3 318 1.67 1 0.987 49.36
Table 9. Data of the Tested Perpendicular Specimen Cored from Spun Pile D Specimen
id
Height of specimen (mm)
Weight (gr)
Concrete density,
γ (kg/m3)
Compressive
load (kN) H/D C0 C1
Corrected compressive
strength, σ (MPa)
YD 1-1 140 2384 2676.7 278 1.56 1 0.969 42.40
YD 4-2 135 2269 2642.0 376 1.50 1 0.960 56.77
YD 2-3 130 2202 2662.6 397 1.44 1 0.953 59.50
Conclusion
Based on the analysis of the testing results per-formed in this research, several conclusions can be drawn. The conclusions include:
- The compressive strength and the density of the
concrete at the outer region are higher than those at the inner region of spun piles.
- The compressive strength and the density of the
concrete increase with the distance from the longitudinal axis.
- There was inconclusive relationship between
compressive strength of the concrete and its correlated density when the specimen was cored and tested parallel to the longitudinal axis of the spun piles.
- The failure of the specimens cored and tested
parallel to the longitudinal axis was different than that cored and tested perpendicular to the longitudinal axis.
References
1. Aya, K., On Compacting Concrete of Reinforced Concrete Piles by Centrifugal Method, Transac-tion of The Japan Society of Civil Engineers, 1960(71), 1960, pp. b1-b16.
2. Lazar, M.A., Barron’s Review Course Series, Let’s
Review Physics: The Physical Setting, 3rd, New
York: Barron’s Education Serries, 2005.
3. Badan Standardisasi Nasional, SNI 2049-2015 Semen Portland, Jakarta: BNS, 2015 (In Indo-nesian).
4. National Standardization Agency of Indonesia,
SNI 1970-2016 Metode Pengujian Berat Jenis dan Penyerapan Air Agregat Halus, Jakarta: BNS, 2016 (In Indonesian).
5. National Standardization Agency of Indonesia,
SNI-1969-2016 Metode Pengujian Berat Jenis dan Penyerapan Air Agregat Kasar, Jakarta: BNS, 2016 (In Indonesian).
6. Kuranovas, A. and Kvedaras, A.K., Centrifu-gally Manufactured Hollow Concrete-filled Steel Tubular Column, Journal of Civil Engineering and Management, XIII(4), 2007, pp. 297-306. 7. Völgyi, I., Farkas, G., and Nehme, S.G., Concrete
Strength Tendency in the Wall of Cylindical Spun-cast Elements, Periodica Polytechnica, Civil Engineering, 54(10), 2010, pp. 23-30.
8. National Standardization Agency of Indonesia,
![Table 3. Factor of C1, Height to Diameter Ratio [8]](https://thumb-ap.123doks.com/thumbv2/123dok/1567620.2051154/3.595.70.265.400.456/table-factor-c-height-diameter-ratio.webp)