1
Source Rocks Characterization
in Benakat Gully, Limau, and Jemakur-Tabuan Graben,
North-South Palembang Sub-Basin, South Sumatra Basin
M. Syaifudin
1,2,a, Eddy A. Subroto
2, Dardji Noeradi
2, Asep H.P.Kesumajana
2 1Universitas Pembangunan Nasional “Veteran” Yogyakarta
2
Institut Teknologi Bandung
aABSTRACT
There are differences opinion among geochemistry expert about determining oil family in the South Sumatra Basin. The first opinion that only analyzing oil samples, argues that oils in this area are derived from fluvio-deltaic and lacustrine source rock, while the second opinion that analyzing source rocks and oils samples, argues that lacustrine oil is not found in this area. Research area is located at Benakat gully, Limau graben, and Jemakur-Tabuan graben which is considered as syn-rift basins, consist of syn-rift sediments. So, expected that source rock with lacustrine characterization could be found in this area.
This paper emphasizes geochemistry methods. Source rock analysis, consist of 68 samples for carbon isotope and 76 samples for biomarker. Characterization has been based on qualitative and quantitative data. Qualitative data comprise evaluation based on chromatograms and mass-fragmentograms, whereas quantitative data consists of a series of cross-plots.
The result from geochemistry analysis, concluded that Lemat Formation in Benakat Gully and Jemakur-Tabuan Graben is interpreted as source rock with estuarine characterization, while Lemat Formation in Limau graben interpreted as source rock with fluvio-deltaic characterization. Talangakar Formation in Benakat Gully, Limau Graben, and Jemakur-Tabuan Graben is interpreted as source rock with deltaic characterization. Based on geochemistry analysis, source rock in research area consist of estuarine, deltaic, and fluvio-deltaic source rocks. There is no source rock with lacustrine characterization in research area. Oil with lacustrine characterization in reseach area, considered generate by Lemat Formation from the deeper strata of stratigraphy, supported by Morley‟s Paleontology data but it need further exploration and analysis. There is also new interpretation of Lemat Formation‟s source rock in Benakat Gully and Jemakur-Tabuan Graben, which is part of it having tendency as marine influence, interpreted as source rock with estuarine characterization.
Key words: biomarker, lacustrine, estuarine, fluvio-deltaic, deltaic.
INTRODUCTION
There are a number of sub-basins in the research area which is potential as the hydrocarbon kitchen but it isn‟t known with more certainty yet about the character of the source rock. There are two group‟s results of the source rock and oil research, there are: first group is Robinson (1987) and Suseno et al. (1992), researching source rock and oil samples, which is conclude that oil in the research area was generated from fluvio-deltaic source rock, while the second group is ten Haven and Schiefelbein (1995), Ginger and Fielding (2005), Noble et al. (2009), and
Rashid et al. (1998), which only researching oil samples, conclude that the oil in the research area besides generated from fluvio-deltaic sediment, there are also generated from lacustrine sediment (Table 1).
LOCATION OF RESEARCH AREA
2
RESEARCH METHODS
This paper emphasizes geochemistry methods. Source rock analysis, consist of 68 samples for carbon isotope and 76 samples for biomarker. Characterization has been based on qualitative and quantitative data. Qualitative data comprise evaluation based on chromatograms and mass-fragmentograms, whereas quantitative data consists of a series of cross-plots, example: cross plot of carbon isotope δ13
C saturates - aromatics, distribution of C27-C28-C29 sterane, Pr/nC17-Ph/nC18, Pr/Ph-Pr/nC17, carbon isotope δ13C saturates-Pr/Ph, Pr/Ph-total hopane/total sterane, and ratio of C26/C25 (tricyclic).
The results of this study, expected could find out the character of source rock in hydrocarbon kitchen, including the possibility of lacustrine source rock‟s existence.
REGIONAL STRUCTURAL GEOLOGY OF SOUTH SUMATRA BASIN
Geological structures that control the regional of South Sumatra (Figure 1) were influenced by three tectonic phases (Pulunggono et al., 1992):
Compression (Upper Jurassic – Lower Cretaceous)
Tension (Upper Cretaceous – Lower Tertiary)
Compression (Middle Miocene – Recent)
The first phase: started in Upper Jurassic – Lower Cretaceous, characterized with the subduction of India-Australia plate as a movement mechanism to yield primary stress to the Sundaland trending N 30o W. This subduction resulted simple shear (N 300o E) as strike slip fault that was actively moved laterally. This was assumed as the cause of linearity trending N-S as antithetic fault which was inactive.
The second phase: commenced during Upper Cretaceous-Lower Tertiary, characterized by the change of the subduction trend of the India-Australia plate into N-S. This event resulted in the formation of some geological structures (fractures) caused by tension force as linearity with N-S direction. This
phenomenon caused the formation of grabens and depressions, such as Benakat Gulley. Initiation of graben filling with Tertiary sediments was started.
The third phase: commenced in the Middle Miocene-present, shown with, again, the change of the subduction direction into N 6o E, causing rejuvenation and inversion processes on the paleostructures by Plio-Pleistocene (N 330o E) and the uplifting of the Barisan Montains and also the formation of some thrust faults with the Lematang fault pattern.
REGIONAL STRATIGRAPHY OF SUMATRA BASIN
Based on the tectonostratigraphy framework, Ryacudu (2008) divides Early Tertiary rock units in the South Sumatra Basin as follows (Figure 2):
Pre-rift sequences
This sequence consists of volcanic rock of Kikim Formation and pre-Tertiary rocks. Kikim Formation are the oldest Tertiary rocks in the South Sumatra Basin, consist of volcanic rocks such as volcanic breccia, agglomerate, andesitic tuffs and igneous rocks (as intrusions and lava flows). Age of Kikim Formation based on dating K-Ar is 54-30 Ma (Paleocene - Lower Oligocene, Ryacudu, 2008). The oldest age and the contact with pre-Tertiary rocks are unknown, while the relation with the formation above is unconformity. Syn-rift sequences
Syn-rift sequence consists of Lahat Group consisting of Lemat and Benakat Formations with interfingering relations. The main constituent of Lemat Formation are coarse clastic rocks (sandstone) with Tuff Member and conglomerate Member, while Benakat Formations dominated by fine clastic rocks (shale). The group does not contain fossils, dating is determined by palinomorf
3 Formations interpreted as lake (lacustrine) sediment.
Post-rift sequences
Tanjungbaru Formation, originally considered a GRM (Gritsand Member) formerly known as a member of the Talangakar Formation. This unit is dominated by conglomeratic sandstone deposition system as a result of braided river. Unconformity contact with Lahat Group below it. Member of the Formation Talangakar commonly referred to as TRM (Transition Member) proposed a Talangakar Formation. This Formation consists of alternating sandstones and shales, with thin coal interbedded, deposited in the transition environment, i.e : the delta system to shallow marine, of Early Miocene. Baturaja Formation, Early Miocene (N5-N6), composed of limestone bioclastic, kalkarenit, bioclastic sandy limestones and reefal bioherm with interbedded of calcareous shale, deposited on the carbonate platform. Gumai Formation, Early Miocene to Middle Miocene, composed by calcareous mudstone that contains fossil planktonic foraminifera Globigerina and shales napalan with glaukonitic quartz sandstones. Deposited conformity over Gumai Formation is Palembang Group, consist of Air Benakat, Muara Enim, and Kasai Formation. Furthermore, the marine condition is getting shallower and then the Kasai Formation deposited in fluviatil and terrestrial environment.
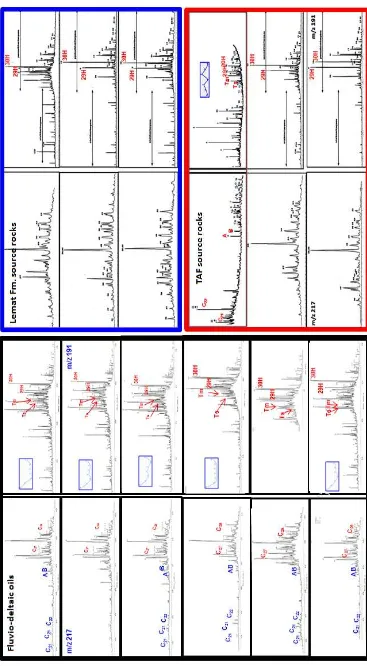
SOURCE ROCKS CHARACTERIZATION
Figure 3 shows location map of the study area and summary of the source rock geochemical data in Benakat Gully, Limau Graben, and Jemakur-Tabuan Graben.
Source Rocks Characterization in Benakat Gully
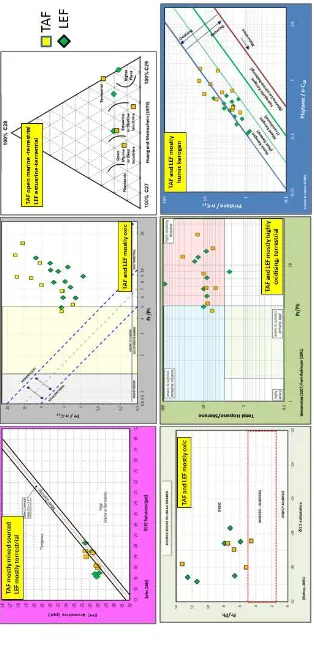
Figure 4 shows sterane distribution curve of C27,C28, dan C29 , cross plot of Pr/nC17-Ph/nC18, Pr/Ph – Pr/nC17, Pr/Ph– hopane/sterane, carbon isotope δ13C saturates – aromatics and carbon isotope δ13C saturates - Pr/Ph, Lemat and Talangakar Formation in Benakat gully. This phenomenon shows Lemat Formation was deposited in estuarine or
shallow lacustrine environment, whereas Talangakar Formation was deposited in estuarine or shallow lacustrine to terrestrial environment. Lemat and Talangakar Formation consists of humic and mixed kerogen, but mostly humic kerogen, and influenced by terrestrial material. Lemat Formation mostly deposited in anoxic-suboxic, and Talangakar Formation deposited in oxic condition.
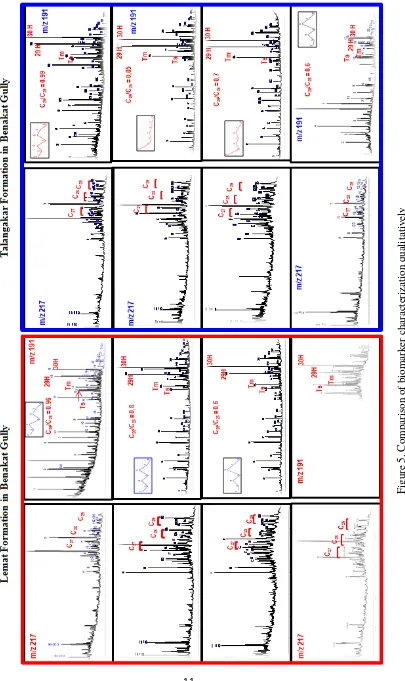
Figure 5 is a comparison of biomarker characterization qualitatively between Lemat and Talangakar Formation in Benakat Gully. From this picture it appears that Lemat and Talangakar Formation, according to ten Haven and Schiefelbein (1995), and Peters et al. (2005), is not a lacustrine sediments because has C26/C25 (tricyclic) is smaller than 1. Based on tricyclic data, according to Price et al. (1987), Lemat Formation shows delta pattern, whereas Talangakar Formations shows delta and terrestrial pattern. Based on data of 29H and 30H (hopane) distribution, it appears that Lemat and Talangakar Formation are marine clastic sediments because it shows a pattern 29H <30H (Zumberge (1984), Connan et al. (1988), Price et al. (1987), all in Waples and Machihara (1991). From data of homohopana distribution which decreased regularly from C31 to C35, Lemat and Talangakar Formations interpreted as depositional environment which associated with clastic (Waples and Machihara, 1991) or more oxidizing conditions (Peters and Moldowan, 1993). Based on these data, Lemat Formation in Benakat Gully interpreted as estuarine sediments, while Talangakar Formation interpreted as delta sediments.
Sourec Rocks Characterization in Limau Graben
Sterane distribution curve of C27,C28,C29 , cross plot of Pr/nC17-Ph/nC18, Pr/Ph – Pr/nC17, Pr/Ph–hopane/sterane, carbon isotope δ13
C saturates–aromatics and carbon isotope δ13
4 Formations consists of humic kerogen and influenced by terrestrial material on anoxic-suboxic to oxic condition but mostly found on oxic condition. Lemat and Talangakar Formations consist of terrigeneous material and mixed source.
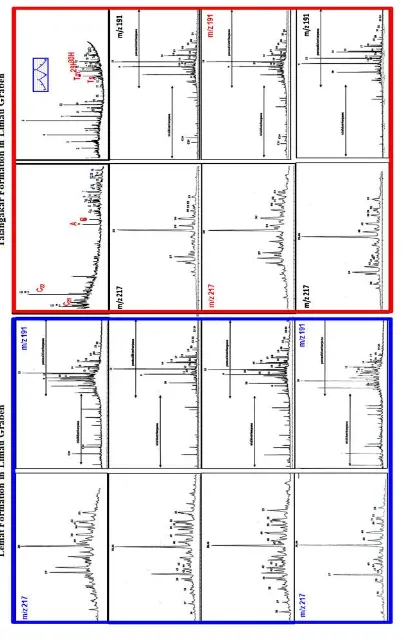
Figure 7 is a comparison of biomarker characterization qualitatively between Lemat and Talangakar Formations in Limau Graben. From this picture, appears that Lemat and Talangakar Formation in Limau Graben is not a lacustrine sediments. Based on tricyclic data, Lemat Formation shows terrestrial pattern, whereas Talangakar Formations show terrestrial and marine pattern. Based on data 29
H and 30H (hopana) distribution, it appears that Lemat Formation is marine clastic sediments, while Talangakar Formation is marine clastic and evaporates-carbonate sediment. From data homohopana distribution, Lemat and Talangakar Formations, interpreted having depositional environment which associated with clastic or more oxidizing conditions. Based on these data, Lemat Formation in Limau Graben interpreted as fluvial sediments, while Talangakar Formation interpreted having more marine characterization as delta sediments.
Sourec Rocks Characterization in Jemakur-Tabuan Graben
Curve of sterane distribution C27, C28, and C29, cross plots Pr/nC17-Ph/nC18, Pr/Ph – Pr/nC17, and Pr/Ph–hopane/sterane, carbon isotope δ13C saturates–aromatics, and carbon isotope δ13C saturates-Pr/Ph of Lemat and Talangakar Formations in Jemakur-Tabuan graben can be seen in Figure 8. This figure shows Lemat Formation interpreted deposited from estuarine or shallow lacustrine to terrestrial environments, whereas Talangakar Formations deposited from marine or deep lacustrine, estuarine or shallow lacustrine to terrestrial environment. Lemat Formation consists of humic kerogen while Talangakar Formation consists of humic and mixed kerogen, but most of the humic kerogen. Both of these formations are influenced by terrestrial material, with anoxic-suboxic to oxic conditions, but mostly found on oxic conditions. Lemat Formation consist of mixed source, while Talangakar Formations consist of algae, mixed source, and terrigeneous.
Figure 9 is a comparison of biomarker characterization qualitatively between Lemat and Talangakar Formations in Jemakur-Tabuan Graben. From this picture it appears that Lemat and Talangakar Formation in Limau graben, is not a lacustrine sediments. Based on tricyclic data, Lemat Formation shows delta and marine pattern, whereas Talangakar Formations show terrestrial, delta, and marine pattern. Based on data of 29H and 30
H (hopana) distribution, it appears that Lemat and Talangakar Formation is marine clastic and evaporates-carbonate sediment. From data of homohopana distribution, Lemat and Talangakar Formations interpreted having depositional environment which associated with clastic or more oxidizing conditions. Based on these data, lemat Formation in Limau graben is interpreted as estuarine sediments, while Talangakar Formation is interpreted as delta sediments.
CONCLUSION
Lemat and Talangakar Formations in Benakat Gully mostly consist of humic kerogen and influenced by terrestrial material. Lemat Formation mostly found on anoxic-suboxic conditions, whereas Talangakar Formation largely found on oxic condition. Based on tricyclic data, Lemat Formation shows delta pattern, whereas Talangakar Formations show delta and terrestrial pattern. Lemat Formation in Benakat gully is interpreted not a lacustrine, but estuarine sediments, and Talangakar Formation is delta sediment. The existence of lacustrine sediment is interpreted under estuarine sediments.
5 material, with most oxic conditions. Lemat Formation in Jemakur-Tabuan graben is interpreted not a lacustrine but estuarine sediments, and Talangakar Formation is delta sediment.
ACKNOWLEDGEMENTS
We would like to thank the management of Directorate General of Oil and Gas, Pertamina EP, and Medco EP for their permission to publish this paper.
REFFERENCES
Artono, E. and Tamtomo B. (2000): Pre Tertiary reservoir as a hydrocarbon prospecting opportunity in the South Sumatra basin, Western Indonesia in the third millennium, AAPG International Conference & Exhibition, Bali, Indonesia. Ginger, D. and Fielding, K. (2005): The
Petroleum systems and future potential of the South Sumatra basin, Proceedings Indonesian Petroleum Association, thirtieth Annual Convention & Exhibition, Jakarta, Indonesia, p. 67-89.
Morley, R.J. (2009): Sequence biostratigraphy of Medco South Sumatra acreage, not published, 85 pp.
Noble, R., Orange, D., Decker J., Teas P., and Baillie, P. (2009): Oil and gas seeps in deep marine sea floor cores as indicators of active petroleum systems in Indonesia, Proceedings Indonesia Petroleum Association, thirty third IPA Annual Convention & Exhibition, Jakarta, Indonesia.
Peters, K.E., and Moldowan, J.M. (1993): The Biomarker guide “Interpreting molecular fossils in petroleum and ancient sediments”, Prentice Hall, Englewood Cliffs, New Jersey, 363 pp.
Peters, K.E., Walters, C.C., and Moldowan J.M. (2005), Volume 1, The Biomarker guide, Cambridge University press, 474 pp. Peters, K.E., Walters, C.C., and Moldowan
J.M. (2005), Volume 2, The Biomarker guide, Cambridge University press, p. 475-1155.
Price, P.L., Sullivan, T.O., and Alexander, R. (1987): The Nature and occurrence of oil in
Seram, Indonesia, Proceedings Indonesia Petroleum Association, sixteenth Annual Convention, Jakarta, Indonesia.
Pulunggono, A., Agus, H. S. and Kosuma, C. G. (1992): Pre-Tertiary and Tertiary fault systems as a framework of the South Sumatra basin; A Study of SAR maps. Proceedings Indonesian Petroleum Association, twenty first Annual Convention & Exhibition, Jakarta, Indonesia, p. 339-360. Rashid, H., Sosrowidjojo, I.B., and Widiarto, F.X. (1998): Musi platform and Palembang high: A New look at the petroleum system, Proceedings, Indonesian Petroleum Association, twenty-Sixth Annual Convention, Jakarta, Indonesia, p. 265-276. Robinson, K.M. (1987): An Overview of
source rocks and oils in Indonesia, Proceedings Indonesian Petroleum Association, sixteenth Annual Convention, Jakarta, Indonesia, p. 97-122.
Ryacudu, R. (2008): Tinjauan stratigrafi Paleogen Cekungan Sumatra Selatan, Sumatra Stratigraphy Workshop, IAGI, p. 99-114.
Sarjono, S. and Sardjito (1989): Hydrocarbon source rock identification in the South Palembang subbasin, Proceedings Indonesian Petroleum Association, eighteenth Annual Convention, Jakarta, Indonesia, p. 424-467.
Suseno, P.H., Zakaria, Mujahidin, N., and Subroto, E.A. (1992): Contribution of Lahat Formation as hydrocarbon source rock in South Palembang area, South Sumatra, Indonesia, Proceedings Indonesian Petroleum Association, twenty first Annual Convention, Jakarta, Indonesia, p. 325-337. ten Haven and Schiefelbein (1995): The
petroleum systems of Indonesia, Proceedings Indonesian Petroleum Association, twenty fourth Annual Convention, Jakarta, Indonesia, p. 443-459. Waples, D.W. and Curiale J.A., (1999): Oil–
6
T
ab
le
1.
C
om
par
iso
n of
oi
l
fam
il
ie
s a
nd
ana
ly
zes
per
fo
rm
ed on t
he
sour
ce r
o
ck
and oi
l
fr
om
som
e r
es
ea
rche
7
Fig
ur
e
1.
T
ect
o
ni
c
ev
ol
ut
io
n of
t
he Sou
th Sum
at
ra Bas
in f
rom
U
pper
Ju
ra
ss
ic
-now
(
Pulung
g
ono et
a
l., 199
8
Fig
ur
e
2. R
eg
ion
al
s
tr
at
ig
ra
phy
of
t
he S
out
h
Sum
at
ra B
as
in
(m
odi
fi
ed
R
y
ac
udu, 2008)
9
Fig
ur
e
3. L
o
ca
ti
on
m
ap
of
t
he
st
udy
ar
ea
and
a sum
m
ar
y
of
t
he s
our
ce
rock
g
eoc
hem
ica
l d
at
a
in B
ena
k
at
g
ul
ly
, L
im
au
g
rabe
n
and
Jem
ak
ur
-T
ab
uan g
rab
en
10
Fig
ur
e 4. Quan
ti
ta
ti
v
e m
et
h
od i
n B
enak
at
g
ul
ly
11
Fig
ur
e
5. C
om
par
ison
o
f bi
om
ar
k
er
cha
ra
ct
er
iz
at
ion
q
ual
it
at
iv
el
y
bet
w
ee
n
Lem
at
and
Tal
ang
ak
ar
Form
at
ion
in B
enak
at
g
ul
ly
12
Fig
ur
e 6. Quan
ti
ta
ti
v
e m
et
h
od i
n L
im
au g
rabe
n.
13
Fig
ur
e
7. C
om
par
ison
o
f bi
om
ar
k
er
cha
ra
ct
er
iz
at
ion
q
ual
it
at
iv
el
y
bet
w
ee
n
Lem
at
and
Tal
ang
ak
ar
Form
at
ion
s
in
Lim
au Grabe
14
Fig
ur
e 8. Quan
ti
ta
ti
v
e m
et
h
od
in
Je
m
ak
ur
-T
abua
n g
rab
en
15
Fig
ur
e
9. C
om
par
ison
o
f bi
om
ar
k
er
cha
ra
ct
er
iz
at
ion
q
ual
it
at
iv
el
y
bet
w
ee
n
Lem
at
and
Tal
ang
ak
ar
Form
at
ion
in
Je
m
ak
ur
-T
ab
uan g
rab
16
Correlation Study of Source Rock and Oil in Limau Graben,
South Sumatera Basin: Source Rock and Oil Characterization
and Potency of Lemat Formation as
Hydrocarbon Source Rocks
M. Syaifudin
1,2,a, Eddy A. Subroto
2, Dardji Noeradi
2, Asep H.P.Kesumajana
2 1Universitas Pembangunan Nasional “Veteran” Yogyakarta
2
Institut Teknologi Bandung
aABSTRACT
Lemat Formation in Limau graben has been considered as syn-rift sediments until now, consist of fluvio-lacustrine sediments, creating source rock with fluvio-lacustrine characterization. While based on existing publications, showing that oil from Limau graben having fluvio-deltaic characterization and generated by source rock from Talangakar Formation with fluvio-deltaic characterization.
This paper emphasizes geochemistry methods. Source rock analysis consist of 26 samples for carbon isotope and 14 samples for biomarker, while oil analysis consist of 15 samples for carbon isotope and 19 samples for biomarker. Characterization has been based on qualitative and quantitative data. Qualitative data comprise evaluation based on chromatograms and mass-fragmentograms, whereas quantitative data consists of a series of cross-plots.
Based on geochemical analysis, source rocks of Lemat Formation in Limau Graben interpreted as source rock with fluvio-deltaic characterization, having terrestrial influence while Talangakar Formation in Limau Graben interpreted as source rock with deltaic characterization, having marine and terrestrial influence. Both, consist of humic kerogen. Whereas, oil samples in Limau Graben interpreted as oil which is generated by source rock with fluvio-deltaic characterization, having terrestrial influence, in anoxic-suboxic-oxic conditions, consisting of humic kerogen. Correlation result between source rocks and oils in Limau Graben, indicating that fluvio-deltaic oil families in Limau Graben are strongly correlate with not only the source rocks of Talangakar Formations but also with source rock of Lemat Formation.
Key words: biomarker, terrestrial, fluvio-deltaic
INTRODUCTION
South Sumatra Basin is a potential and mature basin for hydrocarbon kitchen. There are a number of sub-basins which is potential as the hydrocarbon kitchen in this basin. Limau Graben is one of sub-basin on the South Palembang Sub-basin, formed in Upper Cretaceous to Lower Tertiary, in extensional phase, this is the beginning of sedimentation in this area. Lemat Formation in Limau Graben has been considered as syn-rift sediments until now, consist of terrestrial sediment (lacustrine), creating source rock with fluvio-lacustrine characterization. While based on existing publications, showing that oil from Limau Graben having fluvio-deltaic
charac-terization and generated by source rock from Talangakar Formation with fluvio-deltaic characterization. This is interesting to study further, especially about possibility of source rock with fluvio-lacustrine characterization in research area. This study emphasized to source rocks of Lemat and Talangakar Formation in Limau Graben, South Palembang Sub-basin, South Sumatra Basin.
RESEARCH AREA
17
RESEARCH METHODS
This paper emphasizes geochemistry methods. Source rock analysis, consist of 26 samples for carbon isotope and 14 samples for biomarker, while oil analysis, consist of 15 samples for carbon isotope and 19 samples for biomarker. Characterization has been based on qualitative and quantitative data. Qualitative data comprise evaluation based on chromatograms and mass-fragmentograms, whereas quantitative data consists of a series of cross-plots, eg. cross plot of carbon isotope δ13C saturates - aromatics, distribution of C27-C28-C29 sterane, Pr/nC17-Ph/nC18, Pr/Ph-Pr/nC17, carbon isotope δ13C saturates-Pr/Ph, Pr/Ph-total hopane/Pr/Ph-total sterane, and ratio of C26/C25 (tricyclic).
The results of this study expected could explain the character of source rocks and oil in the Limau Graben, also to find out the possibility of lacustrine source rock existence and determine the correlation between source rocks and oils in this area, so can be known whether Lemat Formation source rocks also have contributed to produce oil in this area or not. In addition, to provide a new opportunity in the exploration of hydrocarbons in the Limau Graben which considered as a mature and potential basin for hydrocarbon.
REGIONAL STRUCTURAL GEOLOGY OF SOUTH SUMATRA BASIN
Geological structures that control the regional of South Sumatra (Figure 1) were influenced by three tectonic phases (Pulunggono et al., 1992):
Compression (Upper Jurassic – Lower Cretaceous)
Tension (Upper Cretaceous – Lower Tertiary)
Compression (Middle Miocene – Recent)
The first phase: started in Upper Jurassic – Lower Cretaceous, characterized with the subduction of India-Australia plate as a movement mechanism to yield primary stress to the Sundaland trending N 30o W. This subduction resulted simple shear (N 300o E) as strike slip fault that was actively moved laterally. This was assumed as the cause of
linearity trending N-S as antithetic fault which was inactive.
The second phase: commenced during Upper Cretaceous-Lower Tertiary, characterized by the change of the subduction trend of the India-Australia plate into N-S. This event resulted in the formation of some geological structures (fractures) caused by tension force as linearity with N-S direction. This phenomenon caused the formation of grabens and depressions, such as Benakat Gulley. Initiation of graben filling with Tertiary sediments was started. In general faults and grabens formed during this phase show N-S and WNW-ESE directions.
The third phase: commenced in the Middle Miocene-present, shown with, again, the change of the subduction direction into N 6o E, causing rejuvenation and inversion processes on the paleostructures (N 300o E/N-S) by Plio-Pleistocene (N 330o E) and the uplifting of the Barisan Montains and also the formation of some thrust faults with the Lematang fault pattern. During this phase, the Lematang fault pattern that initially acted as depocenter of the Muara Enim Deep has been uplifted being anticlinorium series of Pendopo-Limau (Figure 2.5). Folding and thrust-faulting processes caused by compression force occurred in the back-arc basinal and floured during Plio-Pleistocene.
REGIONAL STRATIGRAPHY OF SUMATRA BASIN
Based on the tectonostratigraphy framework, Ryacudu (2008) divides Early Tertiary rock units in the South Sumatra Basin as follows (Figure 2):
Pre-rift sequences
pre-18 Tertiary rocks are unknown, while the relation with the Formation above is unconformity. Syn-rift sequences
Syn-rift sequence consists of rock group of Lahat Group consisting of Lemat and Benakat Formation with interfingering relations. The main constituent of Lemat Formation are coarse clastic rocks (sandstone) with Tuff Member and conglomerate Member, while Benakat Formations dominated by fine clastic rocks (shale). The group does not contain fossils, dating is determined by palinomorf
Meyeripollis naharkotensis in shale of Benakat Formations indicating Upper Oligocene – Lower Early Miocene. The group has non-conformity relationship with rock Formations above and below it. Sandstones of Lemat Formation deposited in fluvial environment, while conglomerate is interpreted as an alluvial fan sediment. Shale of Benakat Formations interpreted as the result of deposition in the lake system (lacustrine). Post-rift sequences
This sequence consists of a rock from Telisa group consisting Tanjungbaru, Talangakar, Baturaja, and Gumai Formation. Tanjungbaru Formation, originally considered a GRM (Gritsand Member) formerly known as a member of the Talangakar Formation. This unit is dominated by conglomeratic sandstone deposition system as a result of braided river. Unconformity contact with Lahat Group below it. Member of the Formation Talangakar commonly referred to as TRM (Transition Member) proposed a Talangakar Formation. This Formation consists of alternating sandstones and shales, with thin coal interbedded, deposited in the transition environment. Baturaja Formation, Early Miocene (N5-N6), composed of limestone bioclastic, kalkarenit, bioclastic sandy limestones and reefal bioherm with interbedded of calcareous shale, deposited on the carbonate platform. Gumai Formation, Early Miocene to Middle Miocene, composed by calcareous mudstone that contains fossil planktonic foraminifera Globigerina and shales napalan with glaukonitic quartz sandstones. The deposition of Gumai Formation marked the peak transgression of
the South Sumatra Basin. Air Benakat Formation, Middle Miocene, composed by the dominance of shallow-marine mudstone with sandstone interbedded which is thickening and dominating upward. Sandstone at the top is a quartz sandstone, tufaan and glaukonitic. The presence of the tufa material in the Formation marked the beginning of the influence of the source sediments from the south or uplifting of the Bukit Barisan Mountains. Furthermore, the marine condition is getting shallower so that it becomes transition environment, and then the Formation Muaraenim deposited. Muara Enim Formation, Middle Miocene to Late Miocene. Consists of mudstone, shale, and sandstone and coal interbedded deposited in the delta system or transitional environment. Kasai Formation, Pliocene. Is a volcaniclastic sediment, consisting of mudstone and sandstone's tufa interbedded deposited in fluviatil and terrestrial environments.
CHARACTERIZATION OF SOURCE ROCKS AND OILS IN LIMAU GRABEN
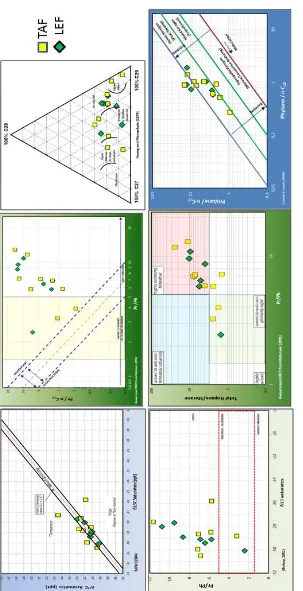
Figure 3 shows location map of research area and data location of oil and source rocks in Limau Graben. Figure 4 shows a cross plot Pr/nC17-Ph/nC18 and Pr/Ph – Pr/nC17, source rocks of lemat and Talangakar Formations, and oils in Limau Graben. This image shows both source rocks of Lemat and Talangakar Formation and oils, consists of humic kerogen in suboxic-anoxic until oxic conditions, but mostly in oxic conditions. Cross plot of carbon isotope δ13C saturates - δ13C aromatics and carbon isotope δ13C saturates - Pr/Ph, source rocks of Lemat and Talangakar Formations and oils in Limau Graben shown in Figure 5. This figure shows source rocks of Lemat and Talangakar Formations and oils consists of terrestrial and mixed material, in anoxic-suboxic to oxic conditions, but mostly in oxic conditions.
19 derived from estuarine or shallow lacustrine to terrestrial environments, whereas Talangakar Formation and oils derived from marine or deep lacustrine, estuarine or shallow lacustrine, and terrestrial environments. Figure 7 is a comparison of biomarker characterization qualitatively between source rocks of Lemat and Talangakar Formation and oils in Limau Graben. From this picture it appears that source rocks of Lemat and Talangakar Formations and oils, according to ten Haven and Schiefelbein (1995), and Peters et al. (2005), is not lacustrine sediments because has C26/C25 (tricyclic) smaller than 1. Based on tricyclic data, according to Price et al. (1987), Lemat Formation and oils show terrestrial pattern, whereas Talangakar Formations show marine and terrestrial pattern. These data indicate Lemat Formation interpreted as fluvio-deltaic sediment, whereas Talangakar Formation having more marine characterization than Lemat Formation. Based on data of 29H and 30H (hopane) distribution, it appears that source rocks of Lemat Formation and oils are marine clastic sediments because it shows a pattern 29H <30H, while Talangakar Formation not only show 29H<30H but also show 29H>30H is evaporates-carbonate sediment (Zumberge (1984); Connan et al. (1988); Price et al. (1987), all in Waples and Machihara (1991). From data of homohopana distribution which decreased regularly from C31 to C35, source rock of Lemat, Talangakar Formations, and oils in Limau Graben interpreted as depositional environment which associated with clastic sediments (Waples and Machihara, 1991) or more oxidizing conditions (Peters and Moldowan, 1993). Based on these data, oil in the Limau Graben interpreted originated from fluvio-deltaic source rocks and has a correlation with Lemat and Talangakar Formations in Limau Graben.
CONCLUSION
Source rocks of Lemat and Talangakar Formations and oils in Limau Graben consists of humic kerogen and terrestrial and mixed material. Source rocks of Lemat and Talangakar Formations and oils in Limau Graben, is not derived from a lacustrine sediments, affected by terrestrial material in anoxic -suboxic until oxic conditions, but
mostly on high oxic conditions. Besides, its also looks like Lemat Formations derived from estuarine or shallow lacustrine to terrestrial environments, whereas Talangakar Formation and oils in Limau Graben derived from marine or deep lacustrine, estuarine or shallow lacustrine, and terrestrial environments. Based on tricyclic data, Lemat Formation and oils in Limau Graben show terestrial pattern, whereas Talangakar Formations show marine and terrestrial pattern. These data indicate Lemat Formation interpreted as fluvio-deltaic sediment, whereas Talangakar Formation having more marine characteriztion than Lemat Formation. Oils in the Limau Graben interpreted originated from fluvio-delta source rocks, has a correlation with Lemat Formation and Talangakar Formation in Limau graben.
ACKNOWLEDGEMENTS
We would like to thank the management of Directorate General of Oil and Gas, Pertamina EP, and Medco EP for their permission to publish this paper.
REFERENCES
Artono, E. and Tamtomo B. (2000): Pre Tertiary reservoir as a hydrocarbon prospecting opportunity in the South Sumatra basin, Western Indonesia in the third millennium, AAPG International Conference & Exhibition, Bali, Indonesia. Doust, H. and Noble, R.A., (2008): Petroleum
system of Indonesia, Marine and Petroleum Geology, Vol. 25, p. 103–129.
Ginger, D. and Fielding, K. (2005): The Petroleum systems and future potential of the South Sumatra basin, Proceedings Indonesian Petroleum Association, thirtieth Annual Convention & Exhibition, Jakarta, Indonesia, p. 67-89.
Hall, R. and Morley, C.K. (2004): Sundaland basins, In Continent–ocean interactions within the East Asian marginal seas, ed. Clift, P., Wang, P., Kuhnt, W., dan Hayes, D.E., Geophysical Monograph, Vol. 149, p. 55–85.
20 Beaumont E.A., The American Association of Petroleum Geologist, p. 6.3-6.41.
Magoon, L.B., and Dow, W.G. (1994): The Petroleum system-From source to trap: American Association of Petroleum Geologists Memoir 60, 655 pp.
Mello, M.R. and Maxwell, J.R. (1990): Organic geochemical and biological marker characterization of source rocks and oils derived from Lacustrine environments in the Brazilian continental margin, In Lacustrine basin exploration, Case studies and modern analogs, ed. Katz B.J., AAPG Memoir 50, p. 77-97.
Morley, R.J. (2009): Sequence biostratigraphy of Medco South Sumatra acreage, not published, 85 pp.
Noble, R., Orange, D., Decker J., Teas P., and Baillie, P. (2009): Oil and gas seeps in deep marine sea floor cores as indicators of active petroleum systems in Indonesia, Proceedings Indonesia Petroleum Association, thirty third IPA Annual Convention & Exhibition, Jakarta, Indonesia.
Peters, K.E., and Moldowan, J.M. (1993): The Biomarker guide “Interpreting molecular fossils in petroleum and ancient sediments”, Prentice Hall, Englewood Cliffs, New Jersey, 363 pp.
Peters, K.E., Walters, C.C., and Moldowan J.M. (2005), Volume 1, The Biomarker guide, Cambridge University press, 474 pp. Peters, K.E., Walters, C.C., and Moldowan
J.M. (2005), Volume 2, The Biomarker guide, Cambridge University press, p. 475-1155.
Peters, K.E. and Cassa M.R. (1994): Applied source rocks geochemistry, Dalam The Petroleum system from source to trap, ed. Magoon L.B. dan Dow W.G., AAPG Memoir 60, p. 93-117.
Price, P.L., Sullivan, T.O., and Alexander, R. (1987): The Nature and occurrence of oil in Seram, Indonesia, Proceedings Indonesia Petroleum Association, sixteenth Annual Convention, Jakarta, Indonesia.
Pulunggono, A., Agus, H. S. and Kosuma, C. G. (1992): Pre-Tertiary and Tertiary fault systems as a framework of the South
Sumatra basin; A Study of SAR maps. Proceedings Indonesian Petroleum Association, twenty first Annual Convention & Exhibition, Jakarta, Indonesia, p. 339-360. Rashid, H., Sosrowidjojo, I.B., and Widiarto, F.X. (1998): Musi platform and Palembang high: A New look at the petroleum system, Proceedings, Indonesian Petroleum Association, twenty-Sixth Annual Convention, Jakarta, Indonesia, p. 265-276. Robinson, K.M. (1987): An Overview of
source rocks and oils in Indonesia, Proceedings Indonesian Petroleum Association, sixteenth Annual Convention, Jakarta, Indonesia, p. 97-122.
Ryacudu, R. (2008): Tinjauan stratigrafi Paleogen Cekungan Sumatra Selatan, Sumatra Stratigraphy Workshop, IAGI, p. 99-114.
Sarjono, S. and Sardjito (1989): Hydrocarbon source rock identification in the South Palembang subbasin, Proceedings Indonesian Petroleum Association, eighteenth Annual Convention, Jakarta, Indonesia, p. 424-467.
Suseno, P.H., Zakaria, Mujahidin, N., and Subroto, E.A. (1992): Contribution of Lahat Formation as hydrocarbon source rock in South Palembang area, South Sumatra, Indonesia, Proceedings Indonesian Petroleum Association, twenty first Annual Convention, Jakarta, Indonesia, p. 325-337. ten Haven and Schiefelbein (1995): The
petroleum systems of Indonesia, Proceedings Indonesian Petroleum Association, twenty fourth Annual Convention, Jakarta, Indonesia, p. 443-459. Waples, D.W. and Curiale J.A., (1999): Oil–
21
Fig
ur
e
3. L
o
ca
ti
on
m
ap
of
t
he
st
udy
ar
ea
and
a sum
m
ar
y
of
t
he
sour
ce
rock
g
eoc
hem
ica
l d
at
a
in L
im
au
g
rabe
n
22
Fig
ur
e
4. C
ross
p
lo
t
of
P
r/
n
C17
-Ph/nC
18
and Pr
/Ph
–
Pr
/nC
17
, sour
ce r
o
ck
s
of
l
em
at
and
T
al
ang
ak
ar
Fo
rm
at
ion, an
d oi
ls
in
L
im
au
g
rabe
s o
f t
h
e 1
st
I
nt
er
nat
iona
l C
onf
er
enc
e
on Ene
rg
y
and
Indones
ia
–
M
al
ay
si
a G
eohe
rit
ag
e Confe
ren
ce
Y
ogy
ak
ar
ta, 20
-21 N
ov
e
m
ber
20
14
23
24
F
ig
u
re
6. C
ross plot
of Pr
/P
h
-hopa
ne
/st
era
n
e
and s
ter
ane
dist
ributi
on C
27
, C
28
, a
nd C
29
, sourc
e r
oc
ks
of
lema
t a
nd Ta
la
n
g
aka
r
F
or
mation, and oil
s
in
L
imau
g
ra
be
25
Fig
ur
e
7. C
om
par
ison
o
f bi
om
ar
k
er
cha
ra
ct
er
iz
at
ion
q
ual
it
at
iv
el
y
be
tw
ee
n
sour
ce
r
ock
s of
l
em
at
and
T
al
ang
ak
ar
Form
at
io
n,
and oi
ls
in
L
im
au
g
rabe
n
26
Determination of Ancient Volcanic Eruption Centre
Based on Gravity Methods
in Gunungkidul Area Yogyakarta
Agus Santoso
1,2,a, Sismanto
3, Ary Setiawan
4, Subagyo Pramumijoyo
5 1Ph.D. Student, Physics Department, Gadjah Mada University, Indonesia
2Geophysical Engineering, UPN "Veteran" University, Yogyakarta, Indonesia
3Physics Department, FMIPA Gadjah Mada University, Indonesia
4Physics Department, FMIPA Gadjah Mada University, Indonesia
5Geology engineering Gadjah Mada University, Indonesia
a[email protected]. (Corresponding author)
ABSTRACT
Ancient eruption centers can be determined by detecting the position of the ancient volcanic material, it is important to understand the elements of ancient volcanic material by studying the area geologically and prove the existence of an ancient volcanic eruption centers using geophysics gravity method. The measuring instrument is Lacoste & Romberg gravimeter type 1115, the number of data are 900 points. The area 60x40 kilometers, the modeling 2D software is reaching depth of 30 km at the south of the island of Java subduction zone. It is suported by geological data in the field that are found as the following:
1. Pyroclastic Fall which is a product of volcanic eruptions, and lapilli tuff with felsic mineral. 2. Pyroclastic flow with Breccia, tuffaceous sandstone and tuff breccia. 3. Hot springs near Parangwedang Parangtritis. 4. Igneous rock with scoria structure in Parang Kusumo, structured amigdaloida which is the result of the eruption of lava/volcanic eruptions, and Pillow lava in the shows the flowing lava into the sea.
Base on gravity anomaly shows that there are strong correlationship between those geological data to the gravity anomaly. The 2D modeling shows the position of ancient of volcanic eruption in this area clearly.
Keywords:Ancient Volcano, Gravity method. 2D program
INTRODUCTION
Theory of Gravity is proposed by Sir Isaac Newton (1642-1727) states that the attraction force of between two particles is proportional to the multiplication of two masses and inversely proportional to the square of the distance between the two centers, so the greater of the distance the second object, the gravitational force is getting smaller, the method is often used for the preliminary survey on monitoring volcano. The research location is in the area of Gunungkidul, Bantul and Klaten, precisely located at geographic coordinates of E 422000-472000, and S 9090000-9145000.[8].
GENERAL GEOLOGY
27 Subzona Wonosari a plateau (± 190 m) located in the central part of the Southern Mountains Zone, namely Wonosari and surrounding area. This plain is bounded by Subzona Baturagung on the west and north side, while the south and east side borders the mountain Subzona Sewu. The main river in this area is K. Oyo that is flowing to the west and merges with K. Opak. The sediment surface in this area is black clay and ancient lake sediments, whereas the rock is essentially limestone.[9].
STRATIGRAPHY
Naming litho units of the Southern Mountains has been widely expressed by some researchers who distinguish stratigraphic western region (Parangtritis – Wonosari). Stratigraphic (fig 1).
Figure 1. Stratigraphic sequence of Gunungkidul by some authors.
BASIC CONCEPTS OF GRAVITY METHOD
The theory of gravity states that the force of attraction between two particles is proportional to the multiplication of two masses and inversely proportional to the square of the distance between the two centers [1] and[13]. It can be written as;
g
where,
F: forces of attraction between two masses (N)
R : distance between M and m (meters)
M : mass of object 1 (kg)
G: gravitational constant Nm2/kg2
m: mass of object 2 (kg)
28 The gravitational constant value G can be derived from the experimental results [12], i.e.,
G = 6.673 x 10⁻⁸ dyne cm2/g2 = 6.673 x 10⁻¹¹ Nm2/kg2.
The equation (1) shows that the magnitude of gravity is directly proportional to the mass, while the mass is directly proportional to the mass density ρ and the volume of the object, so that the magnitude of gravity measured, reflecting both these quantities, the volume would be related to the geometry of objects [13]. The flowchart or the diagram of processing gravity data is shown in Figure 2.
Figure 2. Flowchart of the processing data.
The standard by step correction concepts and data processing see [8,13].
GRAVITY INTERPRETATION
In general, the interpretation of the gravity data is divided into two type, i.e, quantitative (Physical Modeling) and qualitative interpretation (Geological Modeling).
Quantitative Interpretation (Physical Modeling)
Quantitative interpretation is an indirect method, the method of trial and error (trial-error) using 2D modeling [12], The Talwani modeling, basically is performed by varying the form of polygons model in accordance with the consideration of geological geometric of model and sample that are taken from the area of study, and then do a match or fitting of the calculation gravity response of model (anomaly) to the corrected observations. Before calculations the response of the object model, the separation of regional to local effect have to be performed [4]. The regional effect of the anomaly reflects the deep and wide objects, while the local effect of anomaly shows the shallow object [5]..
In general in figure 3, the Bouguer anomaly reflect the effect of rock anomaly areas of study; the general the high anomaly value more than 100 mGal located at the edge of the vicinity study area, i.e., Mt. Nglanggran, Mt. Sudimoro, east of Mt. Nglanggran, until Rongkop Ponjong area and surrounding of cave Cerme near Parangtritis [7]. In figure 4 and figure 5, Mt. Pendul with anomalies of 81-82 mGal shows that the depth of the rock is about 600-2000 meters and the density contrast of 0.2 kg/cm3. The 2.85 kg/cm3 density areas in the basement is so low that indicated the presence of anomalies around 60-70 mGal.
The polygon shape display from 2.85 to 2.9 kg/cm3 can be interpreted as igneous intermediate as a basement [4] that these rocks is the ocean crust rocks. According to this model the mélange and oceanic rocks are as revealed in Karangsambung [2]
Profile A – B, is a profile which extends from Parangtritis Mt Sudimoro, Mt. Nglanggran indicates that the rock has a density of 2.85 kg/cm3 is Andesite, density of 2.5 kg/cm3 is breccia and sandstone density is 2.2 kg/cm3 and 2.4 kg/cm3 is the density of coral limestone (figure 4).
Profile C – D, figure 5 is a profile from the Rongkop and Ponjong to Mt Nglanggran and Gantiwarno Klaten shows that the gravity anomaly pattern is also similar to the model of Mt. Sudimoro to Mt. Nglanggran, where the Calibration
Data acquisition and correction
Griding and Contouring
Separation anomaly Polynomial method
Residual anomaly Regional anomaly
2D MODELING
Qualytative Interpretation
Sub Surface Model
Quantitative Interpretation
29 density is 2.85 kg/cm3 at the bottom as an igneous rock, density 2.5 kg/cm3 is breccia, density is 2.2 kg/cm3 is and density 2.4 kg/cm3 is a reef limestone.]
From the quantitative analysis and contour patterns of anomalies and patterns adapted to the configuration of the object model, there are some indications of geological structures such as faults Opak that involve to rock groups with a depth of 700 meters. It generally occupies the western side of the area to the northern side area.
Qualitative Interpretation (Geological Modeling)
Geological modeling is a geological interpretation based on the contour patterns of gravity anomaly that resulting from the distribution of density rock bodies of or the subsurface geological structures. Further, the anomalies gravitational interpreted are produced by local geological information in the form of distribution of objects with different density contrasts or geological structure, which is used as the basis of estimation of the actual geological conditions. To carry out the geological interpretation of the subsurface is through several cross-sectional approaches to gravity data with surface geological data such as geological structure pattern [9] The study area includes the South Java that the value of gravity anomaly is between 60 mGal to 240 mGal. The variations of the shallow bedrock depths are 500 - 1700 meters, at the perimeter of the high Bouguer anomaly is relatively circular in shape around the area of study. It is interpreted as an ancient volcano. In geologically, this area consists of Tertiary age rocks that are covering Nglanggran Formation volcanic breccia, formation Sambipitu (sandstone, clay, calcareous sand, and tuff). and Wonosari Formation which consists of coral limestone and limestone layered. Those formations were intruded by intrusive andesite into the surface such as Mt. Nglanggran and Mt. Sudimoro.[3]. In briefly, the gravity models in this area suggests that the possibility of the bedrock in the study area is an igneous rock i.e., andesite continental crust. The Formation rocks above it may occur at the end of the Cretaceous era [11]. However, geodynamics processes that occur in Cretaceous is not known for a
moment. The gravity section shows a large fault that extends along the river Opak to Northwest – Southeast ward.
Bouguer anomaly map (figure 3), the basin boundary is obtained by riffing deposited on coral limestone formation known as Wonosari that was located above the andesitic breccias.
TECTONIC PROCESSES
According to [4,6]. Geological interpretation based on the contour patterns of anomalous gravity field resulting from the distribution of density anomalies bodies of rock or subsurface geological structures. Further anomalies interpreted gravitational field produced by local geological information in the form of distribution of objects with different density contrasts or geological structure, which is used as the basis of estimation of the actual geological conditions [2].
GEOLOGICAL HISTORY
1. In the early - Middle Miocene [8, 10].: The huge eruption of the volcano in Gunungkidul areas produce materials pyroclastic material spread out to 10-20 km radial.
2. Middle Miocene: because of the Huge eruption of a great many times, and there was wide graben caldera which the middle is the city of Wonosari, this graben. Many fault caused by the edge of the mountain section contained around the caldera 3. In the Upper Miocene - Pliocene: the case
of transgression so surface mount caldera sank below sea level, and the life of the coral reef comes the mid section of the caldera
4. Pliocene - Pleistocene: a process of removal (tectonic) that Caldera was lifted up in the earth's surface, the reef becomes Wonosari Formation.
5. Recent : Erosion and denudation resulting in the appearance of the topography and morphology were present.
CONCLUSIONS
30 and Mt Nglanggran interconnected to form eruptive fissure with the northwest – southeast direction, it is forming a high pattern of gravity anomaly.
2. The low pattern in the middle area is the basin that located above Wonosari volcanic breccias, and the high pattern anomaly boundaries are forming a circular shape.
3. The high pattern area Ponjong, Rongkop and Wediombo are an ancient volcano that located in the eastern area needs further investigation due to the intrusion not disclosed on the surface.
0 20 20 20 40 40 40 40 40 40 40 40 6 0 60 6 0 60 60 60 60 60 60 8 0 80 8 0 80 80 80 80 1 00 100 100 100 100 100 1 0 0 1 00 100 100 1 20 120 120 120 120 120 120 14 0 14 0 140 140 140 140 16 0 160 160 16 0 1 80 1 80 1 8 0 2 00 2 00 220 220 24 0 2 6 0
4 2 5 0 0 0 4 3 0 0 0 0 4 3 5 0 0 0 4 4 0 0 0 0 4 4 5 0 0 0 4 5 0 0 0 0 4 5 5 0 0 0 4 6 0 0 0 0 4 6 5 0 0 0 4 7 0 0 0 0 4 7 5 0 0 0 9 0 9 5 0 0 0
9 1 0 0 0 0 0 9 1 0 5 0 0 0 9 11 0 0 0 0 9 11 5 0 0 0 9 1 2 0 0 0 0 9 1 2 5 0 0 0 9 1 3 0 0 0 0 9 1 3 5 0 0 0 9 1 4 0 0 0 0
-20 0 20 40 60 80 100 120 140 160 180 200 220 2 40 260 28 0 300
BOUGUER ANOMAL
Figure 3 : Y MAP GUNUNGKIDUL AREA
Anomali Bouguer (mGals) Baron Para ngtritis Bantul Mt. Sudimoro Mt Nglanggran Wediombo Sadeng Wonosari Bayat Klaten Samudra Hindia N Skala : 0 5 K m
31
Distance 444053 434053
37 75 111 150
300
500
800
454053
A B
PHYSICS MODEL
GEOLOGY MODEL
0
A B
300
500
800 200
Mt. Nglanggran
Mt Sudimoro
Parangtritis
L
au
t Limestone
Breccia
Andesite intrusion
Sandstone
Density = 2,8 2,5
2.2 2.4
Legend :e
Wonosari Formation: Reef Limestone Clastic limestone.,
Sambipitu Formation : Sandstone, tuff, clay
Nglanggran Formation: Andesitic Breccia, Lava, Sandstone, Pyroclastic Tuff
Andesit : e Intrusion.
.
Mt. SUDIMORO - Mt. NGLANGGRAN
Figure 4 : PROFILE A - B BOUGUER ANOMALY
246
104 mGal
123
61
1000
1500 m
452791 462791 Distance 472791
Density = 2,8
2,5 2,4 2,2
500
1000
1500 m
C Mt. Nglanggran D
Andesiteintrusion
Breccia Limestone Sandstone
Legend :e
Wonosari Formation: Reef Limestone Clastic limestone.,
Sambipitu Formation : Sandstone, tuff, clay
Nglanggran Formation: Andesitic Breccia, Lava, Sandstone, Pyroclastic Tuff Andesit :e Intrusion.
GEOLOGY MODEL PHYSICS MODEL
.
Mt. SUDIMORO - Mt. NGLANGGRAN - Mt Baturagung
Figure 5 : PROFILE C - D. BOUGUER ANOMALY
32
3. Upper Miocene : Tectonic Processes, Transgresion (below sea level)
2. Middle Miocene : Eruption resulting the Formation of Caldera
1. Early - Middle Miocene : Eruption volcano in Gunungkidul
Sea Level
Magma Pyroclastic rocks
Sea Level
Caldera
Sea Level
Caldera
Magma
Magma Pyroclastic rocks
Pyroclastic rocks Eruption
.
4. Upper Miocene - Pliocene : Coral reef was growing up formed Wonosari Formation (Limestone rocks)
Magma Reef Pyroclastic rocks
5. Pliocene - Pleistocene : Tectonic processes/regression followed by intrusion around the edge of the caldera.
Sea Level
Magma Reef Pyroclastic rocks
Sea Level
6. Recent : Erosion resulting in the Formation of current topography now
Limestone/Reef (Wonosari Formation)
Pyroclastic rocks : Breccia, Sandstone, Tuff (Semilir Formation & Nglanggran Formation) Magma
Volcanic bedrock
Oceanic floor Explanation
Magma Reef Pyroclastic rocks
Sea Level
. .
33
REFERENCES
[1] Blakely, Richard.J, 1995, Potential Theory in Gravity and Magnetic Application,
Cambridge Univ. Press.
[2] Bronto, S., Misdiyanta, P., Hartono, G., dan Sayudi, S., 1994. Penyelidikan Awal Lava Bantal Watuadeg, Bayat dan Karangsambung, Jawa Tengah, Kumpulan Makalah Seminar: Geologi dan Geotektonik Jawa, Sejak Akhir Mesozoik Hingga Kuarter. Jur. Tek. Geologi, F. Teknik, UGM, Yogyakarta, h. 123-130.
[3] Cas, R.A.F., dan Wright, J.V., 1987.
Volcanic Succession: Modern and Ancient, Allen & Unwin, London, 534.
[4] Dobrin, M,B and Savit, CH 1988, “Introduction to Geophysical Prospecting”,
Mc Graw Hill Co, Fourth edition, New York, San Fransisco.
[5] Grant,F,S. & West,G,F, 1965, “Interpretation Theory in Applied Geophysics”, Mc Graw Hill Co, New York,
San Fransisco, Toronto, London, Sydney. [6] Hartono, G. dan Syafri, I., 2007. Peranan
Merapi Untuk Mengidentifikasi Fosil Gunung Api Pada “F. Andesit Tua”
[7] Macdonald, A.G., 1972. Volcanoes. Prentice-Hall, Inc. Englewood Cliffs, New Jersey, 510.
[8] Rahardjo, W., Sukandarrumidi dan Rosidi, H. M. D., 1977. Peta Geologi Lembar Jogjakarta, Jawa, skala 1 : 100.000. Puslitbang Geologi, Bandung.
[9] Sartono, S., 1990. Extensive Slide Deposits In Sunda Arc Geology, The Southern Mountain of Java, Indonesia. Buletin Geologi, Bandung, 20. 3-13.
[10] H.O. Seigel, 1995. A Guide To High Precision Land Gravimeter Surveys. Scintrex Limited 222 Snidercroft Road Concord, Ontario. Canada.
[11] Soeria-Atmadja, R., Maury, R.C., Bellon, H., Pringgoprawiro, H,. Polve, M., dan Priadi, B., 1991. The Tertiary Magmatic Belts in Java. Proceeidings of Silver Jubilee Symposium On the Dynamics and Its
Products. Research and Development Center for Geotechnology-LIPI; Yogyakarta, September 17-19, h. 98-112.
[12] Talwani, M., J. L. Worzel, and M. Landisman (1959), Rapid Gravity Computations for two-Dimensional Bodies with Application to the Mendocino Submarine Fracture Zone, J. Geophys. Res., 64(1), 49-59,
[13] Telford, W,M, Geldart,L.P, Sheriff,R,E & Keys, D,A, 1976, “ Applied Geophysics” second edition, Canbridge University Press, New York, London Melbourne.
34
Stability Analysis of Single Slope on Soft Rock Using
Saptono‟s Chart Stability
S. Saptono
a a)Mining Engineering Department
Pembangunan Nasional Veteran Yogyakarta University
Email: [email protected]
ABSTRACT
Stability analysis mining slope is an important activity in the life an open pit coal mine as composed of soft rock. This is because of the safety to mine, machine and personal as well as economic impact on production. In this paper, especially study of existing single slope on soft rock is analyzed using saptono‟s graphics stability. The soft rock properties are determined in laboratory like cohesion, angle of friction, and density. The stability of single slope is simulated for extreme conditions like saturated conditions. The use of saptono‟s graphic stability in calculation of safety factor has to overcome the weakness of rock mass. An analysis of stability was applied to a slope, of complex condition, composed of joints condition, spacing, roughness, orientation and water condition. That condition will be calculated with classification rock mass i.e. rock mass rating (RMR). Therefore, RMR is parameter input on stability analysis. It is pertinent to use the slope stability measures or change the slope geometry on soft rock.
Key word: Graphic Stability, Soft Rock, Rock Mass Rating, Cohesion and friction angle, Safety Factor.
INTRODUCTION
This paper discusses the principles of the theoretical work, and demonstration their application in design chart and in the results of computer analyses. During the past half century, a vast body of literature on the subject of circular failure has accumulated, and no attempt will be made to summarize the standard soil mechanics (Hoek & Bray, 1981). Slope stability criteria that have been widely used are based on the limit equilibrium and numerical methods. While the statistical and graphical methods are rarely used and bearing in mind the nature of the mining operation is very dynamic, the most appropriate method to assess slope stability would then be the graphical method.
Hoek & Bray (1981) was the first one to use a graphical method (curve) for determining the slope stability of loose and homogeneous material. The curve uses cohesion that is derived from Mohr and Coulomb criteria. In its development, Lie et al (2008) also proposed slope stability criteria with graphical method
and the rock strength was determined by the Hoek & Brown rock strength criteria (2002). The Hoek & Bray graphical method does not include rock mass characteristics, whereas Lie et al (2008) incorporate the characteristics of the rock mass in the form of rock constants m, s and Geological Strength Index (GSI, Hoek, 2002). Determination of the rock constants of m and s were done by statistics method based on triaxial test of igneous rocks obtained from an open copper mine in Papua Nuigini.
PROPOSED STABILITY CURVE
35 As mentioned before that the slope stability curves of Hoek & Bray (1981) and Lie et al (2008) include the cohesion of intact rock that is obtained from direct shear test in laboratory scale. Although the stability curve of Lie et al uses rock mass constants such as m and s for scaling up the cohesion to be representing rock mass condition, it would have been better if the cohesion and internal friction angle are obtained from direct shear tests in the field which take account scale effect (Kramadibrata & Jones, 1993).
Hence, a series of slope stability curves is proposed incorporating all parameters given in that of Hoek & Bray and Lie at al. and by taking account the scale effect and weathering that lead to the strength deterioration. It is expected that the proposed slope stability curve will be well appropriate in the application for assessing slope stability in Indonesian as soft rock.
DERIVATION OFCIRCULAR FAILURE CHARTS IN SOFT ROCK
Dimensional analysis has been extensively used in solving complex engineering problems. Its application is dependent on listing of all the dimensional variables affecting the problems.
It has been of immeasurable value in analyzing complex engineering problems in many field notably fluid mechanics and heat transfer. It has also been used to establish the modeling criteria for the scale model testing of coal-face production system (Roxborough & Eskikaya, 1974), and more recently its use in subsidence modelling was referred to by Whittaker & Reddish (1989) and Kramadibrata (1996). The authors therefore decided to apply this technique to develop a rock slope stability curve with the intention of deriving a set of dimensionless groups which could thereafter
be used to correlate the experimental data and develop appropriate functional relationships. Application of the dimensional analysis for slope stability analysis is to link 10 physical quantities of which consists of a slope height (h), specific weight of slope material (), water content (w), slake durability (sd), uniaxial compressive strength (UCS-c), cohesion (c), friction angle (), area of shear plane (A), joint frequency per meter (JF), and Rock Mass Rating (RMR) with water surface condition is saturated (Kramadibrata, 2011). In view of that the rock formation is soft; allowing the UCS varies from 1 MPa to 20 MPa, the relationships between RMR and cohesion of equation can therefore be generated as shown in Figure 1 and 2.
DETERMINATION OF SLOPE STABILITY
Slope Model
Illustration of slope model is shown in Figure 3 with height of h and slope of, and the parameters used to represent the rock mass properties constituting the slope are uniaxial compressive strength (UCS or c), RMR and specific weight (. The RMR is determined using the data site rock characterization (ISRM, 1981) and the slope is assumed as a single slope, the slope stability calculation is based on the limit equilibrium approach and slope failure occurs at the toe of the slope. Slope Stability Determination Procedure
36
Figure 1. Curve for determination of cohesion with RMR and UCS parameters input (Saptono, 2012)
Figure 2. Curve for determination of internal friction angle with RMR parameter input (Saptono, 2012)
0.05 0.10 0.15 0.20 0.25 0.30 0.35 0.40 0.45 0.50 0.55
0 10 20 30 40 50 60 70 80 90 100
C
o
h
e
si
o
n
,
c
(
M
Pa
)
RMR
0 10 20 30 40 50 60
0 10 20 30 40 50 60 70 80 90 100
In
te
ral
f
ri
ct
ion
an
gl
e,
(
o)
37
Figure 3. Single Slope Model and rock properties parameters
Figure 4. The slope stability chart at different slope angles use of on soft rock (Saptono, 2012)
Use of the Failure Chart
In order to use the charts to determine the factor of safety of a slope, the step outlined here and shown in Figure 5 and 6 should be followed.
Step 1: Decide upon rock characterization by Rock Mass Rating (RMR) based on Bieniawski (1989) and select rock strength parameters appli-cation based on uniaxial compr-essive strength
(UCS)