Jurnal Sains Materi Indonesia
Indonesian Journal of Materials Science ISSN : 1411-1098
EFFECT OF PRESSURE ON THE IONIC CONDUCTIVITY
OF (AgI)
0.7(AgPO
3)
0.3GLASS
Mardiyanto, E. Kartini, Gunawan, A. Hindasyah, and M. Ihsan
Technology Center for Industrial Nuclear Materials - BATANKawasan Puspiptek, Serpong 15314, Tangerang
ABSTRACT
EFFECT OF PRESSURE ON THE IONIC CONDUCTIVITY OF (AgI)0.7(AgPO3)0.3GLASS. Since the discovery of ionic conductivity in glass systems a few decades ago, the research and development on the ionic conductive superionic glass has become quite active. In particular, the proposed application of glass electrolytes to rechargeable batteries has strongly stimulated the research and development effort. A key issue is the understanding of the nature of the ionic transport mechanism. The ionic conductivity is a product of the charge carrier concentration and the charge carrier mobility, which, in glass electrolytes, is strongly associated with the mobility of the ionic carrier through the microscopic glass defect. In order to improve our understanding about the ionic conductivity the effect of pressure on the ionic conductivity of silver based electrolyte glass of (AgI)0.7(AgPO3)0.3 has been studied. From these experiments it is shown that the higher the pressure the larger the ionic conductivities are obtained. The powder electrolyte glasses were pressed into coin type samples with pressure of 100 kg/cm2, 200 kg/cm2, 300 kg/cm2, 700 kg/cm2and their conductivities of 1.66 x 10-05[S/cm],
1.01 x 10-04[S/cm], 1.32 x 10-04[S/cm], 1.63 x 10-04[S/cm] were obtained when they were measured with
LCR meter at 50 Hz. The change of the conductivities may be caused by the increase of the microscopic defects in the material due to the higher applied pressures. Densities of the coin type samples were also calculated. The results of the calculations were 3.950 g/cm3, 4.015 g/cm3, 4.115 g/cm3, 5.477 g/cm3for the applied
pressures of 100 kg/cm2, 200 kg/cm2, 300 kg/cm2, 700 kg/cm2respectively.
Key words: Solid state battery, superionic electrolyte glass, ionic conductivity
ABSTRAK
PENGARUH TAKANAN PADA KONDUKTIVITAS IONIC DARI BAHAN ELEKTROLIT GELAS (AgI)0.7(AgPO3)0.3.Semenjak penemuan gelas yang bersifat menghantarkan ion beberapa dasawarsa yang lalu, banyak dilakukan penelitian dan pengembangan bahan konduktor ionik gelas tersebut. Penelitian terhadap bahan ini semakin gencar dilakukan sejalan dengan diusulkannya pemakaian elektrolit gelas pada baterai padat yang dapat diisi ulang. Pembahasan utama yang terkait dengan penelitian tersebut adalah bagaimana memahami mekanisme pergerakan ion dan sifat kealamiahannya. Konduktivitas ionik berkaitan dengan terbentuknya konsentrasi ion dalam bahan elektrolit dan kemobilitasan ion yang bergerak melalui cacat mikroskopis pada bahan gelas. Di dalam rangka untuk lebih memahami tentang konduktivitas ionik dilakukan studi pengaruh tekanan terhadap konduktivitas ionik dari bahan elektrolit gelas (AgI)0.7(AgPO3)0.3. Dari penelitian ini diperoleh bahwa bahan yang dipelet dengan menggunakan tekanan lebih tinggi maka konduktivitas ioniknya menjadi semakin besar. Dibuat beberapa sampel serbuk gelas elektrolit dengan tekanan 100 kg/cm2 , 200 kg/cm2, 300 kg/cm2, 700 kg/cm2kemudian diukur konduktivitas ioniknya dengan menggunakan LCRmeter
dan diperoleh harga konduktivitas sebesar 1,66 x 10-05 (S/cm); 1,01 x 10-04 (S/cm); 1,32 x 10-04(S/cm);
1,63 x 10-04(S/cm). Kenaikan harga konduktivitas ini mungkin disebabkan adanya peningkatan jumlah cacat
mikroskopis bahan akibat kenaikan tekanan. Dalam penelitian ini juga dilakukan pengukuran densitas untuk masing-masing sampel dan diperoleh harga masing-masing sebesar 3,950 g/cm3; 4,015 g/cm3; 4,115 g/cm3;
5,477 g/cm3untuk masing-masing tekanan tersebut di atas.
Kata kunci:Solid state battery, superionik elektrolit gelas, konduktivitas ionik
INTRODUCTION
(AgI)x (AgPO3 )1-x glasses are relatively new ion conducting materials which are technologically very interesting because of their possible applications in sensors, batteries, and displays [1]. Many researchers have been carrying out their experiments to explore the knowledge about the
A solid state superionic glasses or fast ionic conducting (FIC) glasses are generally formed by three components i.e. a glass network former, glass network modifier (metal oxides or metal sulfides), and a dopant such as AgI. Among the superionic glasses, FIC glasses of (AgI)x (AgPO3)1-xwere determined to have ionic conductivity as high as 0.01 S/cm at room temperature [2]. While doing the theoretical models, some researchers also tried to do the experiments to support the available models such as the measurements of both ionic and electrical conductivity and the dielectric constant [5, 6]. By increasing the macroscopic pressure on the samples, the dimension of cavities becomes smaller and the surface contact among the grain increases sharply so that both the electronic and ionic conduction will rise significantly.
Based on the work done by E. Kartini et al [7] on the electrolyte (AgI)x(AgPO3)1-xglasses the optimum ionic conductivity could be obtained when x=0.7. In order to improve this ionic conductivity the sample will be pressed with the varied pressures from 100 kg/cm2to 700 kg/cm2.
As mentioned above, many studies have been done to understand the superionic conductivity behavior of the glass based ionic materials. This paper reports a systematic study of the effecs of pressure on the both electrical and ionic conductivity of (AgI)0.7 (AgPO3)0.3 glass. The results will be used to support our works in the application of the glasses in the field of solid state batteries.
THEORY
Generally, ionic conductivity depends on many parameters such as emperature, frequency, pressure etc. The temperature dependence of the ionic conductivity s is usually described by the empirical equation given by Vogel–Tamman–Fulcher (VTF) as :
exp{-B/[R(T-T
o)]} ... (1)
whereTis the absolute temperature,A,B, andTo are fitting constants.Ris the universal gas constant andB
may be considered as a pseudo-activation energy.
Tocan be considered the critical temperature at which the free volume disappears. The ionic conductivity temperature dependence also can be better described by the Arrhenius :
exp(-H/kT) ... (2)
where A is a pre exponential factor andH is the activition
enthalpy of conductivity.
On the other hand, the ionic conductivity of a materials also depends on the pressure. When a material is pressed with a certain pressure above the atmospheric pressure the macroscopic dimension such as its volume decreases. From the experimental results done by
D. Bamford et al [8] the activation volumeVapp of the ionic conductivity may be estimated using the equation
Vapp= -
RT
ln /ln
p
) ...……....…
3
where T is the temperature and R the universal gas constant. Strictly speaking, the activation volume depends not only on the pressure dependence of the conductivity, but also on the compressibility of the material and on the pressure dependence of the charge carrier number.
EXPERIMENTAL METHODS
The glasses were prepared by melting mixed AgNO3, NH4H2PO4, and AgI stoichiometrically at 923 K for about 6 hours. The melting sample then was quenched by pouring it into an Al2O3crucible filled with liquid nitrogen. The ingot of (AgI)0.7(AgPO3)0.3 glass then ground for the next sample preparation processes. Six grams of (AgI)0.7(AgPO3)0.3powder was divided into four and each of them was 1.5 grams. Each portion was then poured into a die and pressed separately into coin type sample. The four coin type samples have the thicknesses and diameters of 0.215cm, 0.210 cm, 0.205 cm, 0.155 cm and 1.500 cm, 1,505 cm, 1.505 cm, 1.500 cm respectively. Each sample was pressed with the pressure of 100 kg/cm2, 200 kg/cm2, 300 kg/cm2, and 700 kg/cm2
within 5 minutes. Densities of the coin type samples were also calculated. The results of the calculations were 3.950 gr/cm3, 4.015 gr/cm3, 4.115 gr/cm3, 5.477 gr/cm3
for the applied pressures of 100 kg/cm2, 200 kg/cm2,
300 kg/cm2dan 700 kg/cm2respectively.
The conductivity of the coin type samples were measured using LCR meter HIOKI 3522-50. For connecting the coin type sample with the LCR meter, two discs of copper conductors were attached with silver paste at the both sides of the sample. In order to obtain good results of the measurements it is necessary to make good contacts between the two cooper conductors and the sample. It was done by using a casing which can hold the sample perfectly. The casing was designed for room temperature and atmosphere environment. It consists of a top cover, a bottom cover and a body cell. The casing was made from flexi glass. The casing was equipped a metal spring for forcing the sample from one side.
After putting the sample into the casing the measurements were done between frequency 50 Hz and 5 MHz in the air and room temperature environment. The measurements were carried out using the facility of the Agency for the Assessment and Application of Tecnology.
RESULTS AND DISCUSSION
Jurnal Sains Materi Indonesia
Indonesian Journal of Materials Science ISSN : 1411-1098
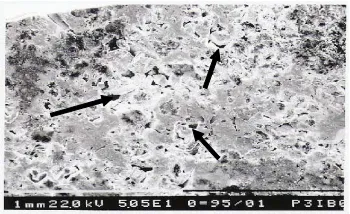
microscope (SEM) and shown in Figure 1, Figure 2 and Figure 3. The three samples were pressed employing pressure of 100 kg/cm2, 300 kg/cm2, and 700 kg/cm2
respectively. From the calculations, the three samples have densities of 3.950 g/cm3; 4.115 g/cm3; 5.477 g/cm3
respectively. By comparing the three images it can be seen clearly that when the sample is pressed with the
lower pressure ( 100 kg/cm2) there are some macroscopic
cavities as shown in Fig. 1.a. By increasing the pressure (100 kg/cm2), the dimension of cavities becomes smaller
(Figure 1.b and 1.c). Consequently, surface contact among the grain increases sharply so that both the electronic and ionic conduction will rise significantly. The cavities behave as the obstacles for the movement of the electrons and ions because they have bigger resistance than the (AgI)0.7(AgPO3)0.3glass matrix.
It can also be seen from Figure 1, Figure 2 and Figure 3 that by increasing the pressure, from 100 kg/cm2to 300 kg/cm2, on the coin type sample, the
electrolyte AgPO3which initially inhibits more space (the white portion in Figure 1) becomes more dense (shown in Figure 2) and arranges itself as a mesh like form. When the bigger pressure is given (700 kg/cm2)
the mesh like form of AgPO3 constructs a canal with bigger size (Figure 3). According to one of the model of AgI-based superionic (AgI)0.7(AgPO3)0.3glass [2] that the glass AgPO3forms a bridging oxygen structure so that the AgI electolyte can not be dispersed so much in the glass.
The model is supported by the results of the experiment done here that by increasing the macroscopic pressure the bridging oxygen of the glass makes more tight structure. In order to be more sure, the composition of the glass (white area) and the rich AgI area (black area) was measured using EDAX. The results of the measurements are shown in the Table 1. From the table, we can see that after being pressed the chemical composition in the white and black area changes (for P in the white area : 11.36% becomes 15.12%; in the black area: 7.85% becomes 12.83% ). It may be caused by the glass particles are harder than the AgI particles, so that after being pressed AgI particles hide among the glass particles. It results in the both areas the composition are dominated by the glass which contains P element.
Based on the previous study [9] the structure of Ag based glasses can be considered as consisting of a network component and a salt component. The salt component provides the stability of the cross links of the network, stability for the disorder structure, the pathways for the ionic conduction. Ag that forms the
Table 1. The measurement of composition of elements using EDAX
Pressure : 300 kg/cm2 Pressure : 700 kg/cm2
Element In the white
area (% weight)
In the black area (% weight)
Element In the white
area (% weight)
In the black area (% weight)
P 11.36 7.85 P 15.12 12.83
Ag 52.47 54.01 Ag 51.91 50.79
I 36.18 38.14 I 32.97 36.38
Figure 1.The images of three samples that were pressed by the pressures of 100 kg/cm2.
Figure 2.The images of three samples that were pressed by the pressures of 300 kg/cm2
cross links has more O neighbours and less I neighbours and will be less mobile. On the other hand, Ag with more I neighbours will be more mobile and more involved in the conduction process.
Theorethical density can not be obtained, because (AgI)0.7(AgPO3)0.3glass was made by melting the mixed AgI , (NH4)H2PO4and AgNO3powder. Here, we measured the density of (AgI)0.7(AgPO3)0.3glass as the result of melt rapid quenching process. The density is called “as true density”, that is the density of the bulk glass before being ground and pressed into a coin type sample or as made glass. The density was measured by using a pycnometer and it was 6.2 gr/cm3. The result of
the conductivity measurement was
5 x 10
-4S/cm
[10].From Table 2 we can see that the highest density is obtained when the glass is still in its original form (as made). For making a solid state coin type battery, the electrolyte glass was ground and pressed into a coin type pellet. Therefore, the density of the pellet is smaller then the as made electrolyte glass, but it increases again with higher pressures.
By increasing pressures on the samples, two phenomena can be obtained namely the cavities become less and the gathering of the glass links becomes bigger so that the densities increase. These two phenomena provide better electronic and ionic conductivity of the AgI based superionic glasses as shown in Figure 4 and Figure 5 shows that by increasing the pressure on the sample the conductance of the (AgI)0.7(AgPO3)0.3glass also increases over the wide range of the frequency from 50 Hz. to 5 MHz. The powder electrolyte glasses were pressed into coin type samples with pressure of 100 kg/cm2, 200 kg/cm2, 300 kg/cm2, 700 kg/cm2
and their conductivities of 1.66 x 10⁻⁵ (S/cm),
1.01 x 10⁻⁴ (S/cm), 1.32 x 10⁻⁴(S/cm); 1.63 x 10⁻⁴(S/cm)
were obtained when they were mea ured by using LCRmeter at 50 Hz.
If we fit the curves of Figure 5 it seems that each curve can be divided into two parts. These are the linear part over the range of low frequency from 50 Hz to about 6 kHz and the exponential part over the range of frequency bigger than 6 kHz. In the linear part the relation between the conductivity and the frequency can stated using the equation :
Log = S log + ...…… (4)
Here is DC conductivity of the superionic glass. From Figure 5 it can be seen that the slope of the line near to zero. It means that in this range of frequency the conductivity is not a function frequency and the movement of the ions is only a hoping process. Meanwhile in the second part the conductivity changes with the increase of the frequency. Here the movement of the ions is caused by the vibration of the ions.
CONCLUSIONS
The conductivities of AgI-based superionic (AgI)0.7 (AgPO3)0.3 glass has been studied by using Scanning Electron Microscope and LCR meter. Samples with higher pressure is resulting in better electronic and ionic conductivities over the wide range of the frequency from 50 Hz. to 5 MHz, due to the decrease of the cavities and the formation of AgPO glass pathways for ionic
As made glass P1
Mass 1.4998 gr. 1.5000 gr. 1.4999 gr. 1.5000 gr.
Density 6.200 gr/cm3 3.950 gr/cm3 4.015 gr/cm3 4.115 gr/cm3 5.477 gr/cm3
Conductivity 5.00E-04 S/cm 1.66E-05 [S/cm]; 1.01E-04 [S/cm] 1.32E-4 [S/cm] 1.63E-4 [S/cm]
Table 2. The measured volume, mass, demsity, and conductivity of the samples with different pressures
Figure 4.Plot of conductivity [S/cm] versus density
Jurnal Sains Materi Indonesia
Indonesian Journal of Materials Science ISSN : 1411-1098
conduction. The conductivities at 50 Hz of the pellets with pressures of 100, 200, 300, and 700 kg/cm2are
1.66 x 10⁻⁵(S/cm), 1.01 x 10⁻⁴(S/cm), 1.32 x 10⁻⁴(S/cm);
1.63 x 10⁻⁴(S/cm) respectively.
ACKNOWLEDGEMENT
This works is financially supported by Indonesian International Joint Research Programme (RUTI IV). The use of Facilities at BATAN and BPPT is greatly acknowledged.
REFERENCES
[1]. J. D. WICKS, L. BORJESSON, G. BUSHNELL-WYE, W.S. HOWELLS and R.L.MCGREEVY,Modelling the Structure and Ionic Conduction of (Agi)
x
(AgPO
3)1-xGlasses, Physica Scripta15, 127-123,
1995.
[2]. MICHIKO NAKAYAMA, MINORU HANAYA, ATSUO HATATE, and MASAHARU OGUMI,
Journal of Non-Crystalline Solids,172-174(1994) 1252-1261.
[3]. K. FUNKE, B. ROLING, M. LANGE,Solid State Ionics,105(1998) 195-208
[4]. K.L. NGAI,Solid State Ionics,105(1998) 231-235. [5]. K. PATHMANANTHAN, S.R. HOPE, G.P. JOHARI,
Te Dielectrisc Study Of Superionic Conduction In 0.5 Agi-0.5 Agpo
3Glasses
[6]. A. DOI AND E. OHBA,Solid State Ionics,57(1992) 15-19
[7]. E. KARTINI, M.F. COLLINS, T. PRIYANTO, S. YUSUF, N. INDAYANINGSIH, E.C. SVENSSON, S.J. KENNEDY, Physical Review B, 61 (2) (2000) 1036-1042
[8]. D. BAMFORD, A.DLUBEK, A.REICHE, M.A. ALAM, W. MEYER, P. GALVOSAS, and F. RITTIG,
Journal of Cheical Physics,115(15) (2001) [9]. J. SWENSON, R.L. MCGREEVY, L. BORJESSON,
J.D. WICKS,Solid State Ionics,105(1998) 55-65 [10].E.KARTINI,RUT VI Final Report1998-2000, Dewan
![Figure 4. Plot of conductivity[S/cm] versus density[gram/cm3].](https://thumb-ap.123doks.com/thumbv2/123dok/1667904.2074185/4.595.99.293.622.745/figure-plot-of-conductivity-s-versus-density-gram.webp)
