THIS REPORT CONTAINS ASSESSMENTS OF COMMODITY AND TRADE ISSUES MADE BY USDA STAFF AND NOT NECESSARILY STATEMENTS OF OFFICIAL U.S. GOVERNMENT POLICY
Date:
GAIN Report Number:
Soybean production in marketing year (MY) 2017/18 (Oct-Sept) is revised down to 10 million metric tons (MMT) produced from an estimated planted area of 10.5 million hectares. The latest planting report from Ministry of Agriculture (MinAg) indicates soybean planted area is 10.2 million hectares, nine percent below last year. However, a minor upward revision in planted area may follow in future updates from MinAg. The preceding observation assumes near normal yield and favorable weather conditions through harvest.
Regarding total oilseed production, after considering net decline in kharif (fall harvest) oilseed Amit Aradhey
Mark Wallace
August 2017
Oilseeds and Products Update
India
production and assuming a normal output for winter-sown oilseeds, total oilseed production for MY 2017/18 is now revised down from 38.6 MMT to 35.9 MMT. As a result, an estimated six percent less oilseed will be available for crushing. Edible oil imports will rise modestly to 16.6 MMT given
sufficient current stocks but oil meal export sales will get trimmed to 2.4 MMT to adjust for local demand and competition from international suppliers.
Author Defined:
2017 Kharif Soybean Production Revised Down from 11.5 to 10 MMT
The 2017 kharif soybean, peanut, and sunflower crops were planted on 13.9 million hectares, 10.4 percent below last year. Erratic rainfall distribution and intermittent dry spells delayed re/planting operations particularly from June through mid-July (peak planting period). This in turn encouraged farmers to shift a part of their cultivable land from oilseeds to more profitable cotton, short-duration black gram, forage crops, and vegetable crops. During that same time, lower price realization for oilseeds discouraged some farmers from expanding their planted area. Market prices for oilseeds in recent months were almost 20 to 30 percent below last year. Note: The planting data is from the MinAg, Government of India (GOI) and is for crop year 2017 (July-June).
Assuming normal growing conditions through September (harvest period), MY 2017/18 soybean production is revised down from 11.5 MMT to 10 MMT to indicate lower than normal area planted. (The 5-year average is 11 million hectares). Yield is expected to be near normal, again assuming weather remains favorable through harvest. Compared to last year, soybean planting is down nine percent to 10.2 million hectares with Madhya Pradesh (MP) reporting more than 10 percent decline. Minor upward revisions in planted area may follow in future updates from MinAg. However, unlike last year, no new additional area was planted to soybeans, particularly in the states of Telangana, Andhra Pradesh, and Karnataka.
The above assessment is preliminary and is based on prevailing weather conditions. The monsoon rainfall from June 1 through Aug 21 across India was four percent below the Long Period Average (LPA) of 89 cm (for period 1951-2000). Of the major soybean growing regions, only central
Maharashtra, parts of Gujarat, and eastern Rajasthan (which cover less than 20 percent of total soybean planted area) received normal rainfall; the remaining regions (80 percent of production) have received rainfall 20-25 percent below normal and are experiencing soil moisture stress. However, the most current Indian Meteorological Department weather forecast of widespread rains in central India (for period Aug 17 to 23) should bring some relief to the standing soybean crop, particularly in Maharashtra and western MP.
Soybean yield and quality of beans are often affected by adverse weather conditions such as sporadic, heavy, and untimely rains; little or poor sunshine during critical growth stages; and poor drainage. The affect is greatest when soybeans are in the reproductive or advanced stage of maturity. Any incidence of pests, disease, or weeds cause decreases in effective yields. Adverse crop growing conditions suggest the need for a robust weather-linked insurance mechanism to safeguard farmers’ interest against all kinds of risk.
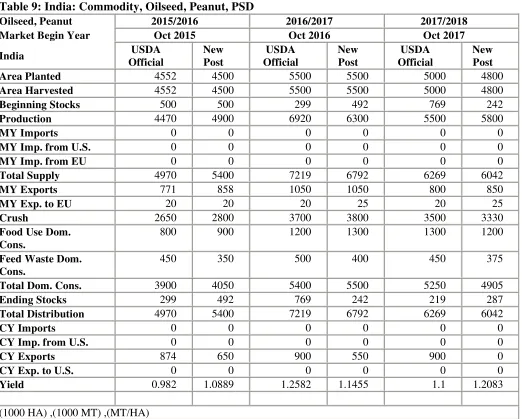
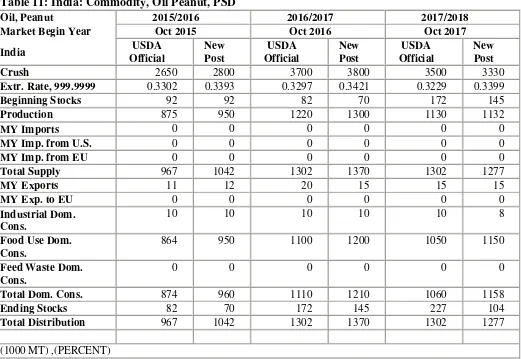
Regarding the peanut crop, area and production for MY 2017/18 are revised lower to 4.8 million hectares and 5.8 MMT, respectively. Major peanut growing regions in Andhra Pradesh, Karnataka, Madhya Pradesh and Maharashtra experienced a shortage of rainfall and as a result peanut planted area in these regions declined by more than 750,000 hectares compared to last season. Moreover, some additional area planted in Gujarat, Uttar Pradesh and Rajasthan could only compensate for less than a third of the net decline reported from Southeastern and central Indian states combined. The latest planting report (as of August 10, 2017) indicates kharif peanut planting at 3.7 million hectares, thirteen percent below last season. The summer planting is assumed to be normal. Peanut planted area and production for MY 2016/17 remain unchanged at 5.5 million hectares and 6.3 MMT.
Similarly, assuming normal growing conditions during the 2017 rabi (winter-sown) season, total
sunflower area and production for MY 2017/18 is revised lower to 315,000 hectares and 265,000 metric tons, respectively. The latest planting report indicates kharif sunflower planted on 116,000 hectares compared to 142,000 hectares planted last season. As indicated previously, the average annual decline
in sunflower production is estimated at 13 percent mostly due to farmers’ shifting to other crops which
offer better returns.
After considering net decline in kharif oilseed production and assuming a normal output for winter-sown oilseeds, total oilseed production for MY 2017/18 is now revised down from 38.6 MMT to 35.9 MMT. As a result, an estimated six percent less oilseed will be available for crush to meal and oil. Edible oil imports will rise only modestly given already sufficient stocks and oilmeal trade will adjust to local demand and price competitiveness in international markets.
MY 2017/18 Edible Oil Imports Will Rise 10 Percent to 16.6 MMT
palm oil due to minimal price difference with crude palm oil (CPO), [leading to larger imports of refined at cost of CPO]. Referring to Table-1 below, except for refined palm and crude sunflower oil (combined share in import basket is currently 35%), import of other edible oils (65%) had shrunk compared to last year. As a result, MY 2016/17 edible oil imports are now revised lower to 15 MMT, which is 6.4 percent below the previous estimate.
Despite the decrease in imports, edible oil stocks are apparently sufficient to meet consumption demand.
India’s monthly requirement is about 1.75 MMT and operates at 30 days reserve stock; current stocks are 2.47 MMT, or 42 days of reserve stock (SEA press release).
Meanwhile, MY 2017/18 edible oil import is revised down from 16.8 MMT to 16.6 MMT to reflect
present trade estimates. However, compared to the current year’s estimate of 15 MMT, import growth is
at a modest 10 percent. Tightening palm oil supplies will slightly limit imports but will encourage import of soft oils at competitive prices to partially fill the gap. The import basket is expected to include 10 MMT of palm oil, 4.2 MMT of soybean oil, 2 MMT of sunflower seed oil and remaining ‘other’ oils.
MY 2017/18 Oilmeal Export Forecast is Trimmed to 2.4 MMT
The MY 2017/18 oilmeal export forecast is trimmed to 2.4 MMT, 11 percent below last estimate to indicate lower than anticipated quantity of oilseeds available for crush. However, the future direction of export sales will depend on competitiveness of Indian oilmeals in the international markets and local demand from poultry integrators.
Table 1. India: Edible Oil Imports, 1000 Metric Tons
Oct-16 Nov-16 Dec-16 Jan-17 Feb-17 Mar-17 Apr-17 May-17 Jun-17 Jul-17 Oct 16- Jul-17
Oct 15 - Jul-16
% Change
RBD palm-olein 222 241 246 197 233 219 232 294 241 294 2,419 2,211 9
Crude palm oil 514 557 473 408 498 454 511 492 572 515 4,997 5,007 0
Crude palm olein 0 473 0 0 0 0 0 0 0 0 0 0
Crude Palm kernel oil 3 408 4 4 4 7 9 12 7 11 65 71 9
Total palm oil 739 801 723 609 736 680 753 799 820 820 7,481 7,289 3
Crude soybean oil 278 164 232 167 252 230 305 340 291 438 2,697 3,564 24
Refined soybean oil 0 0 0 0 0 0 0 0 0 0 0 0 0
Total soy oil 278 164 232 167 252 230 305 340 291 438 2,697 3,564 24
Crude sun oil 97 158 186 215 209 182 235 155 169 201 1,806 1,316 37
Refined sun oil 0 0 0 0 0 0 0 0 0 0 0 0 0
Total sun oil 97 158 186 215 209 182 235 155 169 201 1,806 1,316 37
Canola Rape oil 44 32 33 18 37 0 32 29 13 0 239 272 12
Cottonseed Oil 0 0 0 0 0 0 0 0 0 0 0 0 0
Saflower oil 0 0 0 0 0 6 0 0 0 0 6 0
Coconut oil 0 0 0 0 0 0 0 0 0 0 0 0
Grand Total 1,158 1,156 1,174 1,008 1,234 1,098 1,324 1,324 1,294 1,459 12,229 12,441 2
Source: Solvent Extractors’ Association (SEA) of India
Table 2. India: Oilmeal Exports, Metric Tons
Oct-16 3,177 23,720 514 0 27,411
Nov-16 51,805 12,304 411 0 64,520
Dec-16 160,949 2,292 513 0 163,754
Jan-17 111,060 2,261 296 0 113,617
Feb-17 207,977 22,858 362 0 231,197
Mar-17 107,059 7,666 310 0 115,035
Apr-17 124,374 35,850 0 0 160,224
May-17 48,900 56,107 0 0 105,007
Jun-17 45,975 58,899 0 0 104,874
Jul-17 30,678 2,639 205 0 33,522
Surface Transport
(Oct-16 to May 2017) 335,000 36,150 0 371,150
Oct 16-July-17 1,226,954 260,746 2,611 0 1,490,311
Oct 15-July-16 156,663 151,233 809 0 308,705
% Change 683 72 223 383
Soybean meal Rapeseed meal Peanut meal Sunflower meal Total
Statistical Tables:
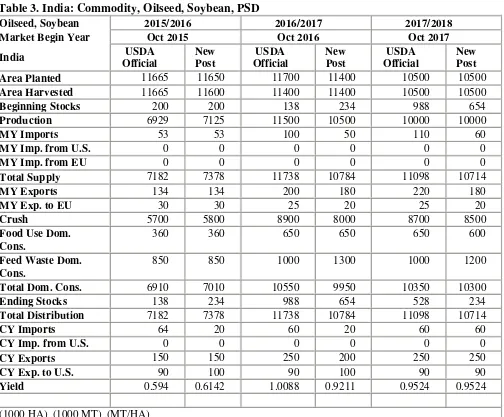
Table 3. India: Commodity, Oilseed, Soybean, PSD
Oilseed, Soybean 2015/2016 2016/2017 2017/2018
Market Begin Year Oct 2015 Oct 2016 Oct 2017
Feed Waste Dom. Cons.
850 850 1000 1300 1000 1200
Total Dom. Cons. 6910 7010 10550 9950 10350 10300
Ending Stocks 138 234 988 654 528 234
Total Distribution 7182 7378 11738 10784 11098 10714
Table 4. India: Commodity, Meal, Soybean, PSD
Meal, Soybean 2015/2016 2016/2017 2017/2018
Market Begin Year Oct 2015 Oct 2016 Oct 2017
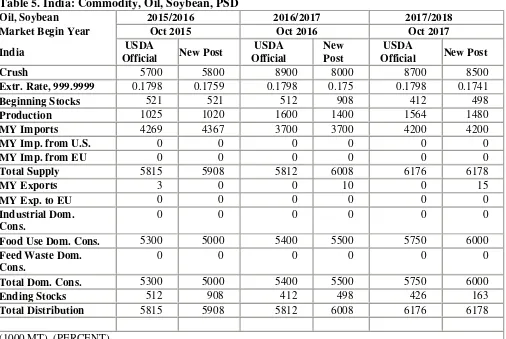
Table 5. India: Commodity, Oil, Soybean, PSD
Oil, Soybean 2015/2016 2016/2017 2017/2018
Market Begin Year Oct 2015 Oct 2016 Oct 2017
India USDA
Official New Post
USDA Official
New Post
USDA
Official New Post
Crush 5700 5800 8900 8000 8700 8500
Extr. Rate, 999.9999 0.1798 0.1759 0.1798 0.175 0.1798 0.1741
Beginning Stocks 521 521 512 908 412 498
Production 1025 1020 1600 1400 1564 1480
MY Imports 4269 4367 3700 3700 4200 4200
MY Imp. from U.S. 0 0 0 0 0 0
MY Imp. from EU 0 0 0 0 0 0
Total Supply 5815 5908 5812 6008 6176 6178
MY Exports 3 0 0 10 0 15
MY Exp. to EU 0 0 0 0 0 0
Industrial Dom. Cons.
0 0 0 0 0 0
Food Use Dom. Cons. 5300 5000 5400 5500 5750 6000
Feed Waste Dom. Cons.
0 0 0 0 0 0
Total Dom. Cons. 5300 5000 5400 5500 5750 6000
Ending Stocks 512 908 412 498 426 163
Total Distribution 5815 5908 5812 6008 6176 6178
(1000 MT) ,(PERCENT)
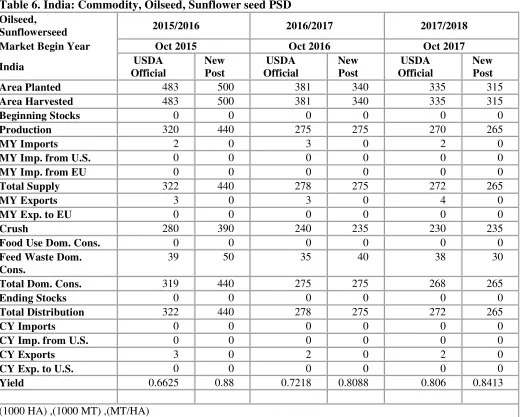
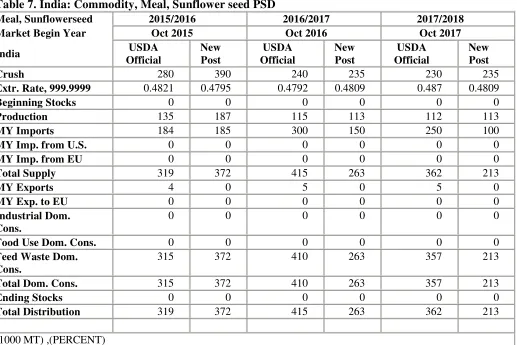
Table 6. India: Commodity, Oilseed, Sunflower seed PSD Oilseed,
Sunflowerseed 2015/2016 2016/2017 2017/2018
Market Begin Year Oct 2015 Oct 2016 Oct 2017
Table 7. India: Commodity, Meal, Sunflower seed PSD
Meal, Sunflowerseed 2015/2016 2016/2017 2017/2018
Market Begin Year Oct 2015 Oct 2016 Oct 2017
India USDA
Official
New Post
USDA Official
New Post
USDA Official
New Post
Crush 280 390 240 235 230 235
Extr. Rate, 999.9999 0.4821 0.4795 0.4792 0.4809 0.487 0.4809
Beginning Stocks 0 0 0 0 0 0
Production 135 187 115 113 112 113
MY Imports 184 185 300 150 250 100
MY Imp. from U.S. 0 0 0 0 0 0
MY Imp. from EU 0 0 0 0 0 0
Total Supply 319 372 415 263 362 213
MY Exports 4 0 5 0 5 0
MY Exp. to EU 0 0 0 0 0 0
Industrial Dom. Cons.
0 0 0 0 0 0
Food Use Dom. Cons. 0 0 0 0 0 0
Feed Waste Dom. Cons.
315 372 410 263 357 213
Total Dom. Cons. 315 372 410 263 357 213
Ending Stocks 0 0 0 0 0 0
Total Distribution 319 372 415 263 362 213
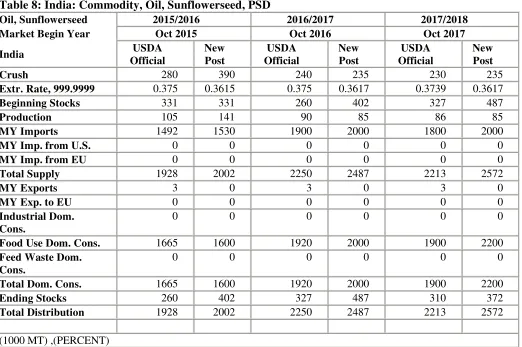
Table 8:India: Commodity, Oil, Sunflowerseed, PSD
Oil, Sunflowerseed 2015/2016 2016/2017 2017/2018
Market Begin Year Oct 2015 Oct 2016 Oct 2017
India USDA
Official
New Post
USDA Official
New Post
USDA Official
New Post
Crush 280 390 240 235 230 235
Extr. Rate, 999.9999 0.375 0.3615 0.375 0.3617 0.3739 0.3617
Beginning Stocks 331 331 260 402 327 487
Production 105 141 90 85 86 85
MY Imports 1492 1530 1900 2000 1800 2000
MY Imp. from U.S. 0 0 0 0 0 0
MY Imp. from EU 0 0 0 0 0 0
Total Supply 1928 2002 2250 2487 2213 2572
MY Exports 3 0 3 0 3 0
MY Exp. to EU 0 0 0 0 0 0
Industrial Dom. Cons.
0 0 0 0 0 0
Food Use Dom. Cons. 1665 1600 1920 2000 1900 2200
Feed Waste Dom. Cons.
0 0 0 0 0 0
Total Dom. Cons. 1665 1600 1920 2000 1900 2200
Ending Stocks 260 402 327 487 310 372
Total Distribution 1928 2002 2250 2487 2213 2572
Table 9: India: Commodity, Oilseed, Peanut, PSD
Oilseed, Peanut 2015/2016 2016/2017 2017/2018
Market Begin Year Oct 2015 Oct 2016 Oct 2017
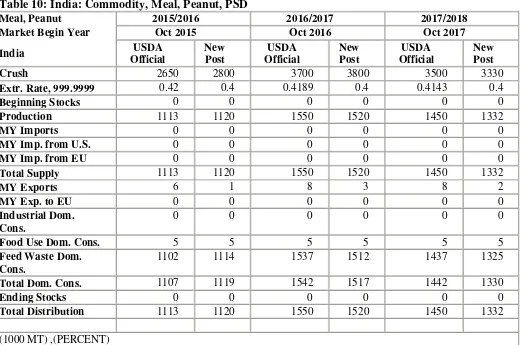
Table 10: India: Commodity, Meal, Peanut, PSD
Meal, Peanut 2015/2016 2016/2017 2017/2018
Market Begin Year Oct 2015 Oct 2016 Oct 2017
India USDA
Official
New Post
USDA Official
New Post
USDA Official
New Post
Crush 2650 2800 3700 3800 3500 3330
Extr. Rate, 999.9999 0.42 0.4 0.4189 0.4 0.4143 0.4
Beginning Stocks 0 0 0 0 0 0
Production 1113 1120 1550 1520 1450 1332
MY Imports 0 0 0 0 0 0
MY Imp. from U.S. 0 0 0 0 0 0
MY Imp. from EU 0 0 0 0 0 0
Total Supply 1113 1120 1550 1520 1450 1332
MY Exports 6 1 8 3 8 2
MY Exp. to EU 0 0 0 0 0 0
Industrial Dom. Cons.
0 0 0 0 0 0
Food Use Dom. Cons. 5 5 5 5 5 5
Feed Waste Dom. Cons.
1102 1114 1537 1512 1437 1325
Total Dom. Cons. 1107 1119 1542 1517 1442 1330
Ending Stocks 0 0 0 0 0 0
Total Distribution 1113 1120 1550 1520 1450 1332
Table 11: India: Commodity, Oil Peanut, PSD
Oil, Peanut 2015/2016 2016/2017 2017/2018
Market Begin Year Oct 2015 Oct 2016 Oct 2017
Table 12: India: Commodity, Oil, Palm, PSD
Oil, Palm 2015/2016 2016/2017 2017/2018
Market Begin Year Oct 2015 Oct 2016 Oct 2017
India USDA
Official
New Post
USDA Official
New Post
USDA Official
New Post
Area Planted 0 282 0 296 0 310
Area Harvested 80 0 80 0 80 0
Trees 0 0 0 0 0 0
Beginning Stocks 539 539 496 307 446 237
Production 200 218 200 230 200 240
MY Imports 8857 9150 9000 9000 9500 10000
MY Imp. from U.S. 0 0 0 0 0 0
MY Imp. from EU 0 0 0 0 0 0
Total Supply 9596 9907 9696 9537 10146 10477
MY Exports 0 0 0 0 0 0
MY Exp. to EU 0 0 0 0 0 0
Industrial Dom. Cons.
500 600 550 500 700 700
Food Use Dom. Cons. 8600 9000 8700 8800 8900 9500
Feed Waste Dom. Cons.
0 0 0 0 0 0
Total Dom. Cons. 9100 9600 9250 9300 9600 10200
Ending Stocks 496 307 446 237 546 277
Total Distribution 9596 9907 9696 9537 10146 10477
CY Imp. from U.S. 0 0 0 0 0 0
CY Exports 0 0 0 0 0 0
CY Exp. to U.S. 0 0 0 0 0 0
Yield 2.5 0 2.5 0 2.5 0