Full Terms & Conditions of access and use can be found at
http://www.tandfonline.com/action/journalInformation?journalCode=vjeb20
Download by: [Universitas Maritim Raja Ali Haji] Date: 11 January 2016, At: 19:16
Journal of Education for Business
ISSN: 0883-2323 (Print) 1940-3356 (Online) Journal homepage: http://www.tandfonline.com/loi/vjeb20
Textbooks for Responsible Data Analysis in Excel
Nathan Garrett
To cite this article: Nathan Garrett (2015) Textbooks for Responsible Data Analysis in Excel, Journal of Education for Business, 90:4, 169-174, DOI: 10.1080/08832323.2015.1007908 To link to this article: http://dx.doi.org/10.1080/08832323.2015.1007908
Published online: 26 Feb 2015.
Submit your article to this journal
Article views: 96
View related articles
Textbooks for Responsible Data Analysis in Excel
Nathan Garrett
Woodbury University, Burbank, California, USA
With 27 million users, Excel (Microsoft Corporation, Seattle, WA) is the most common business data analysis software. However, audits show that almost all complex spreadsheets have errors. The author examined textbooks to understand why responsible data analysis is taught. A purposeful sample of 10 textbooks was coded, and then compared against spreadsheet development best practices. The results show a wide range of approaches, and reveal that none of the 10 books fully cover the methodologies needed to create well-rounded Excel data analysts. There is a need to re-evaluate the teaching approaches being used in office application courses.
Keywords: data analysis, Excel, spreadsheet, textbooks
Excel (Microsoft Corporation, Seattle, WA) is the most popular data analysis tool used in business, with estimates suggesting 27 million users (Scaffidi, Shaw, & Myers, 2005). Excel fills a vital role in most companies, with 80– 90% of firms using spreadsheets in mission-critical finan-cial reporting and forecasting (Panko & Port, 2012).
The problem is that Excel, for all its ubiquity, is almost always used badly. A synthesis of audit reports (Kruck, 2006) show that 75% find an error rate above 35%, with a median value of 50%. Other audit approaches have found that 85–100% of Excel spreadsheets contain errors (Panko & Port, 2012).
Few companies test spreadsheets thoroughly, and those with formal policies are rarely followed (Panko & Port, 2012). This has resulted in a range of horror stories, from the inadvertent release of sensitive information, to range errors reversing GPD growth rates, or even incorrect bids that lose millions of dollars (European Spreadsheet Risks Interest Group, 2014).
Worryingly, experience with Excel is not a predictor of success. Comparing master of business administration (MBA) students with minimal Excel experience against those with more than 250 hours shows no difference in error rates (Panko & Sprague, 1999). Professional research-ers are not exempt. The conclusions from (Reinhart & Rog-off, 2010) were featured in theWall Street Journal, NPR,
The Economist, and BusinessWeek, and were heavily cited
in justifying austerity policies (Coy, 2014). However, the underlying Excel data set contained a range error, that when corrected, changed high-debt country growth rates from –0.3% toC2.6% (Konczal, 2013).
Why do experienced Excel users not have lower error rates? One suggestion may be the way Excel is taught as an application, and not as programming. Vandeput (2009) explained this:
[T]he use of software in order to carry out a task is often considered like a practical process devoid of any intelligent approach. . . . For instance, the use of a word processing
program is considered by lots of people like a sequence of elementary commands.. . .So the trainer will insist on the
graphical elements of the environment (menus, buttons, checkboxes. . .) and on graphical aspects of the process
results. (p. 2)
Excel users struggle with deep knowledge. New Excel tends to be locked in the menu bar or menu items and have a button pushing mentality (Tort, 2010). While able to do superficial manipulations, they have trouble with tasks requiring deep knowledge, particularly with formulas (Tort, 2010). Questions posted in online forums show that users struggle with foundation issues, such as how to set up a problem, and ask fewer feature-based questions (Chambers, Sommers, & Scaffidi, 2012).
Spreadsheet courses should focus on turning students into professional Excel analysts. Instead of training that focuses on surface-level graphic elements or new features, we should encourage the teaching of professional
Correspondence should be addressed to Nathan Garrett, Woodbury University, School of Business, 7500 N. Glenoaks Boulevard, Burbank, CA 91504, USA. E-mail: [email protected]
ISSN: 0883-2323 print / 1940-3356 online DOI: 10.1080/08832323.2015.1007908
quantitative and analytic skills. There is a significant differ-ence between professional and amateur approaches, as the following quote from Weinberg (1998) explains:
The amateur [programmer], being committed to the results of the particular program for his own purposes, is looking for a way to get the job done. If he runs into difficulty, all he wants is to surmount it—the manner of doing so is of lit-tle consequence. Not so, however, for the professional [pro-grammer]. He may well be aware of numerous ways of circumnavigating the problem at hand.. . . But his work
does not stop there; it begins there. It begins because he must understand why he did not understand, in order that he may prepare himself for the programs he may someday write which will require that understanding. (p. 125)
Excel courses should teach logical thinking, and not but-ton pushing. This view is supported by a study showing that training in Excel was linked to an increase in logical skills, as measured by the ETS Diagramming Relationships test (Kruck, Maher, & Barkhi, 2003). Importantly, students’ logical skills were related with their success in producing error-free spreadsheets.
This project examines a selection of books to see how they teach Excel. Do they teach software development methodologies? Which best practices are covered? Which books target superficial features and button clicking, and which target deep knowledge and skills?
LITERATURE REVIEW
Research literature on Excel data analysis can be separated into lifecycle methodology and spreadsheet features sections.
Lifecycle Methodology
Spreadsheet modeling is the combination of technical skills (executing a narrowly defined task), as well as a craft skill (prototyping and simplifying a complex problem) (Powell & Baker, 2013). As users develop a spreadsheet, they are actively engaged in a problem exploration and discovery process (Nardi & Miller, 1990, 1991).
As a result, prespecification of the spreadsheet may not be advisable, or even possible. As Ronen, Palley, and Lucas (1989) said, “one of the major advantages of spreadsheets is their ease of use. . .[a]dvocating more formal approaches to
spreadsheet design may be viewed by some as a step back-wards” (p. 84). An agile process (Powell & Baker, 2013) has the following repeating phases: explore the mess, search for information, identify a problem, search for solu-tions, evaluate solusolu-tions, and implement solutions.
Because Excel relies on spatial organization, properly laying out cells can be a way of conveying information (Bewig, 2005; Rajalingham, Chadwick, & Knight, 2001;
Rajalingham, Chadwick, Knight, & Edwards, 2000; Ronen et al., 1989). Some common approaches to improving this layout can be called block structuring.
Block structuring can be done through a variety of approaches:
Use a separate sheet for input, calculation, and outputs
(Bewig, 2005);
Only refer to cells above and to the left (Powell &
Baker, 2013; Read & Batson, 1999); or
For each row, use only a single formula copied over
from left to right (Bewig, 2005; Read & Batson, 1999).
There is empirical support for the usefulness of a block structuring approach. Surveys have found that heavier users of Excel followed these rules to a larger degree than novice users (Baker & Powell, 2006). Experiments with students have shown that following block rules doubles their rate of error detection (Rajalingham et al., 2001). Several popular financial modeling methodologies also recommend block structuring (Grossman & Ozluk, 2010).
Testing is an essential part of a methodology. Finding errors is difficult, with individual code inspections of indi-vidual cells finding only 63% of errors, and group inspec-tions catching only 83% of errors (Panko, 1999). Cell-by-cell inspection by a group is the only proven technique to catch most of the errors (Panko, 2000). There is a range of common problems, but they often involve formulas and cell reference errors (Hendry & Green, 1994).
High Excel error rates are a natural result of human errors rates and cognition (Panko, 2000). Humans average between 2–5% errors on tasks in general, and when consid-ering the number of formulas in a complex sheet, this natu-rally results in significant numbers of errors. Unlike writing, where a single error may lie unnoticed, a spread-sheet’s cumulative nature means that an error in any part of the chain results in cascading errors toward final results. Research on error rates has shown that no studies of spread-sheets has shown that errors are rare or of low significance (Powell, Baker, & Lawson, 2008).
A significant problem with spreadsheet development is developer overconfidence (Panko, 2000, 2003). In particu-lar, novice users rely too much on quantitative data, have little abstract conceptualization, and do not check their own work (Powell & Willemain, 2006; Willemain & Powell, 2006).
Fortunately, addressing student overconfidence can be effective. Panko (2003) was able to reduce overconfidence by providing a warning as to the error rates in solving an Excel problem. This decreased the rate of solutions with errors from 93% to 73%.
Last, documentation of Excel spreadsheets is an essen-tial part of any methodology. Documentation may be expressed as a how-to sheet (Bewig, 2005; Read & Batson,
170 N. GARRETT
1999), or in comment cells (Powell & Baker, 2013). While spreadsheets may start with a single user, many are shared in larger groups (Nardi & Miller, 1990, 1991). Documenta-tion is key to ensuring spreadsheets remain free from error.
Spreadsheet Features
Most spreadsheets are used to store lists of data (Chambers & Scaffidi, 2010). A sample of 400 spreadsheets from the End-Users Shaping Effective Software (EUSES) Spreadsheet Corpus provides a detailed breakdown (Chambers, Scaffidi, & Sommers, 2010). A total of 56% of the spreadsheets were used for data entry, contained tabular data, and frequently had no formulas. 25% of the spreadsheets were used as data-bases, contained mostly text tabular data, and had no formu-las or charts. The remaining 19% were used for data visualization, data entry, or a combination of purposes.
One survey asked Excel users what features they used most (Lawson, Baker, Powell, & Foster-Johnson, 2009). Ranked from most popular to least, they included the fol-lowing: if, data sort, chart wizard, find and replace, lookup, financial functions, conditional formatting, macros, formula auditing tools, pivot tables, data tables, solver, and goal seek. Another study found that the following features were used occasionally or higher: if, data sort, chart wizard, find and replace, financial functions, and the function wizard (Baker & Powell, 2006). Features used at lower rates included conditional formatting, macros, formula auditing, pivot tables, data table tool, solver, and goal seek (Baker & Powell, 2006).
Beyond simply identifying the most commonly used fea-tures, how can we best use formulas, shortcuts, and formatting?
First, formulas are frequently the most error-prone sec-tions of workbooks. As a result, a number of guidelines pro-mote ways to improve their auditability. Some of the most basic guidelines include the following:
Break complex formulas into multiple cells
(Gross-man & Ozluk, 2010; Powell & Baker, 2013; Read & Batson, 1999);
Do not hard-code constants into formulas (Powell &
Baker, 2013); and
Protect formula so users cannot manually overwrite
them with hard-coded variables (Panko, 2000).
Second, keyboard shortcuts can promote low error rates and speed development time. FAST and OPERIS method-ologies stress the need to learn keyboard shortcuts to enable best practices and reduce errors (Grossman & Ozluk, 2010). Shortcuts are particularly useful in creating block structures, and encourage users to have the same formulas throughout a single column or row.
Third, formatting is an effective way to signal data and meaning, as opposed simply providing decoration (Gross-man & Ozluk, 2010; Powell & Baker, 2013; Raffensperger, 2001). For example, formulas may use a consistent back-ground color, and cells linking to other sheets a different font. Borders, font, and colors can all act as signals.
STUDY DESIGN
This goal of this study was to catalog the range of ways that Excel is taught. It was not designed to provide a representa-tive sample of textbooks, or to evaluate the effecrepresenta-tiveness of the different approaches. Instead, its purpose was to cata-log the range of approaches, and compare these approaches to the existing literature on best practices.
I chose all textbooks suitable for a first semester course on Microsoft Office. I excluded books that were exclusively quick references, second or third courses, or touch-based interface only.
Data Gathering
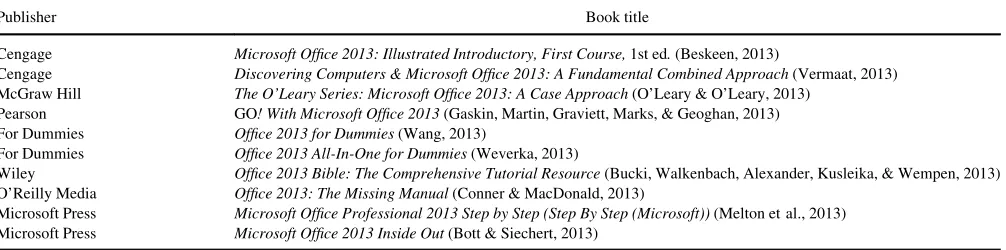
This project began by selecting a purposeful sample of Microsoft Office textbooks. A list was created through searches of retailers, publishers, and Office Application course syllabi. This list included both college-focused books, as well as more practitioner-oriented and popular press introductions. After creating a list, a subset was selected for analysis. The subset (shown in Table 1) included at least one textbook from each major publisher or series, and included a range of authors.
Coding
I read and coded each book. The coding scheme was further developed during the process, which required each book to be analyzed at least twice to ensure accuracy. These codes used are described in the following list.
Pedagogical approach.
Conceptual:Do books explain the concepts behind a
feature, or only give a step-by-step process? Books are coded as conceptual (no step-by-step instructions are given), mixed, and step by step (no conceptual information is given).
Implementation details: Do books assume that Excel
works properly? Books are coded as assume all fea-tures work, limitations given, and limitations and work-around given.
Lifecycle: Do books follow a lifecycle model, or do
they only provide individual illustrations? Books are coded as lifecycle, extended example, or illustration.
Lifecycle approach.
Lifecycle:Do books model a lifecycle approach? Block structuring: Do books explain how to layout
data? Are assumptions separated from calculations, and outputs place on a separate sheet?
Documentation: Do books explain the need to
com-ment a spreadsheet?
Test: Do books show how to test or debug a
spreadsheet?
RESULTS
The following section presents the results of the coding analysis.
Pedagogical Approach
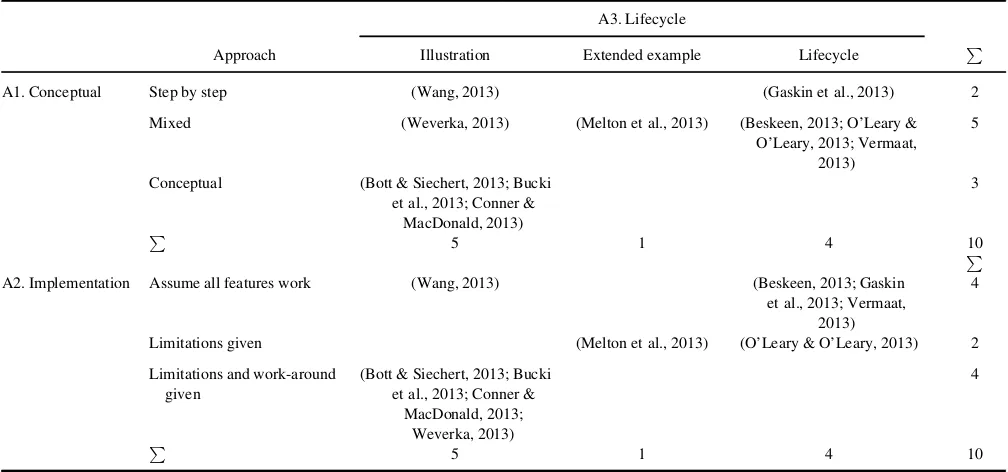
The books have diverse pedagogical approaches, but can be separated into three groups (shown in Table 2).
A third use a lifecycle approach with mixed step-by-step and conceptual explanations. These books guide students through problem description, design requirements, data input, visualization, and printing. Two examples of this approach include Vermaat (2013) and O’Leary and O’Leary (2013).
The second third use illustrative examples and con-ceptual explanations. These comprehensive references did not present overall development methodologies. Instead, they described the value of individual features, and give limitations and work-arounds. Conner and MacDonald’s (2013) is good example of this approach. For example, it is the only text that explains that sub-tracting a larger time from a smaller time will result in a ##### error message.
The remaining books use a variety of approaches. For example, Gaskin, Martin, Graviett, Marks, and Geoghan (2013) used a lifecycle approach, but has step-by-step explanations with minimal conceptual information.
Lifecycle Methodology
Lifecycle. Only two books model and explain a life-cycle development approach. While some books show a lifecycle approach, most do not explain why a structured approach is important.
Many of the features needed for accurate documentation are ignored. For example, only three books present the comment feature. Only one book stresses the need for documentation.
Most disappointingly, only one book suggests auditing spreadsheets for errors. None of the books present error rates, or provide examples of what can go wrong when a spreadsheet is shared among multiple developers.
Block structuring. Unfortunately, the textbooks fall short in providing guidelines for good spatial layout. While good practices are sometimes modeled, their justification and explanation are almost entirely absent. While three sep-arate assumptions from calculations, only Vermaat (2013) explains why this is important. Two books separate calcula-tions from output, but rely upon the reader to understand why.
Nine of the books show how to manage summary data sheets, but two do not show how to manage lists. Pivot tables are also mainly absent, with only four books showing how they work.
Using spreadsheets as what-if tools is common, with five books providing a walkthrough of changing input parame-ters to impact output cells.
Documentation. Almost without exception, books do not show how to document a spreadsheet. Only Vermaat (2013) explained the need for documentation, or shows for-matting as conveying meaning (instead of as decoration). The comment feature is only shown in three books. Using styles to show the purpose of cells is the most popular docu-mentation feature. Seven books present information about cell styles, though they are generally explained as decora-tion and not documentadecora-tion.
TABLE 1 Books Analyzed
Publisher Book title
Cengage Microsoft Office 2013: Illustrated Introductory, First Course,1st ed.(Beskeen, 2013)
Cengage Discovering Computers & Microsoft Office 2013: A Fundamental Combined Approach(Vermaat, 2013)
McGraw Hill The O’Leary Series: Microsoft Office 2013: A Case Approach(O’Leary & O’Leary, 2013)
Pearson GO! With Microsoft Office 2013(Gaskin, Martin, Graviett, Marks, & Geoghan, 2013)
For Dummies Office 2013 for Dummies(Wang, 2013)
For Dummies Office 2013 All-In-One for Dummies(Weverka, 2013)
Wiley Office 2013 Bible: The Comprehensive Tutorial Resource(Bucki, Walkenbach, Alexander, Kusleika, & Wempen, 2013)
O’Reilly Media Office 2013: The Missing Manual(Conner & MacDonald, 2013)
Microsoft Press Microsoft Office Professional 2013 Step by Step (Step By Step (Microsoft))(Melton et al., 2013)
Microsoft Press Microsoft Office 2013 Inside Out(Bott & Siechert, 2013)
172 N. GARRETT
Test. None of the books present information on error rates. Only Vermaat (2013) strongly supported the need to audit an Excel sheet for errors. When it comes to error mes-sages, the books tend to be more successful. Half explain all of the basic # error messages (such as #ref or ######). A majority of the books teach debugging tools. Half show how to print formulas, and seven show the controlC»
shortcut that reveals formulas. Some strategies for data val-idation and protection are shown. Six books show how to hide a sheet, and three how to protect a sheet. Four show the data validation feature.
CONCLUSION
How well do the books teach professional spreadsheet anal-ysis? This analysis has found a surprising range of approaches, but they can be roughly grouped into three categories.
First, some books teach Excel primarily in terms of fea-ture-oriented step-by-step processes. For example, Gaskin et al. (2013) and Wang (2013) walk the user through a series of steps, but rarely explain why or when to use each feature. While users with a background in data management and soft-ware development may find these texts useful, novice users without this background will be left with significant gaps.
Second, the best reference books (Bucki, Walkenbach, Alexander, Kusleika, & Wempen, 2013; Conner & Mac-Donald, 2013; Melton et al., 2013) show why, when, and how to use individual features. But, they do not show how to combine these features into a larger design methodology.
Third, some books teach solid methodology. Unfortu-nately, the two best methodology books do not show how to use Excel for managing lists (and ignore the filter and sort functions). This is a critical gap, since Excel is gener-ally used to manage lists.
All of the analyzed books require supplements. These include the following:
Lifecycle methodology,
Excel error rates, auditing, and documentation
approaches,
Data normalization, and Block formatting rules.
Teaching Excel as a point-and-click tool, or only exam-ining individual features in isolation, results in amateur excel programmers who understand features, but do not know how to tie these features together. The universally high error rates found in the field show the need for improv-ing the state of instruction. Curriculum needs to reflect a professional approach. Without this shift, amateur work will continue to be the norm.
REFERENCES
Baker, K., & Powell, S. (2006). Comparison of characteristics and
practi-ces amongst spreadsheet users with different levels of experience.
Pro-ceedings of EuSpRIG 2006 Conference, 205–220. Retrieved from http:// arxiv.org/abs/0803.0168
Beskeen, D. (2013).Microsoft Office 2013: Illustrated introductory, first
course. Stamford, CT: Cengage Learning. TABLE 2
Pedagogy, Conceptual, and Implementation Details
A3. Lifecycle
Approach Illustration Extended example Lifecycle P
A1. Conceptual Step by step (Wang, 2013) (Gaskin et al., 2013) 2
Mixed (Weverka, 2013) (Melton et al., 2013) (Beskeen, 2013; O’Leary &
O’Leary, 2013; Vermaat, 2013)
5
Conceptual (Bott & Siechert, 2013; Bucki
et al., 2013; Conner & MacDonald, 2013)
3
P
5 1 4 P10
A2. Implementation Assume all features work (Wang, 2013) (Beskeen, 2013; Gaskin
et al., 2013; Vermaat, 2013)
4
Limitations given (Melton et al., 2013) (O’Leary & O’Leary, 2013) 2
Limitations and work-around given
(Bott & Siechert, 2013; Bucki et al., 2013; Conner &
MacDonald, 2013; Weverka, 2013)
4
P
5 1 4 10
Bewig, P. (2005). How do you know your spreadsheet is right?arXiv. Retrieved from http://arxiv.org/abs/1301.5878
Bott, E., & Siechert, C. (2013).Microsoft Office inside out: 2013 edition. Redmond, WA: Microsoft Press.
Bucki, L. A., Walkenbach, J., Alexander, M., Kusleika, D., & Wempen, F.
(2013).Office 2013 Bible: The comprehensive tutorial resource. San
Francisco, CA: Wiley.
Chambers, C., & Scaffidi, C. (2010). Struggling to Excel: A field study of
challenges faced by spreadsheet users.Proceedings of the 2010 IEEE
Symposium on Visual Languages and Human-Centric Computing, 187– 194. Retrieved from http://ieeexplore.ieee.org/xpl/articleDetails.jsp? arnumber=5635221. doi:10.1109/VLHCC.2010.33
Chambers, C., Sommers, Z., & Scaffidi, C. (2012). A study of help
requested online by spreadsheet users.Journal of Organizational and
End User Computing, 24(4), 41–53. Retrieved from http://www.igi-global.com/article/content/70427
Conner, N., & MacDonald, M. (2013).Office 2013: The missing manual.
Sebastopol, CA: O’Reilly Media.
Coy, P. (2014, April 18). FAQ: Reinhart, Rogoff, and the Excel error that
changed history.Business Week. Retrieved from http://www.business
week.com/articles/2013-04-18/faq-reinhart-rogoff-and-the-excel-error-that-changed-history
European Spreadsheet Risks Interest Group. (2014).Spreadsheet mistakes:
News stories. Retrieved from http://www.eusprig.org/horror-stories.htm Gaskin, S., Martin, C. L., Graviett, N., Marks, S., & Geoghan, D. (2013).
GO! With Microsoft Office 2013. Upper Saddle River, NJ: Prentice Hall. Grossman, T., & Ozluk, O. (2010). Spreadsheets grow up: Three spread-sheet engineering methodologies for large financial planning models. Proceedings of EuSpRIG 2010 Conference. Retrieved from http://arxiv. org/abs/1008.4174
Hendry, D. G., & Green, T. R. G. (1994). Creating, comprehending and explaining spreadsheets: a cognitive interpretation of what discretionary
users think of the spreadsheet model.International Journal of
Human-Computer Studies,40, 1033–1065.
Konczal, M. (2013, April 16). Researchers finally replicated
Reinhart-Rog-off, and there are serious problems.Next New Deal: The Blog of the
Roosevelt Institute. Retrieved from http://www.nextnewdeal.net/rorty bomb/researchers-finally-replicated-reinhart-rogoff-and-there-are-seri ous-problems
Kruck, S. E. (2006). Testing spreadsheet accuracy theory.Information and
Software Technology,48, 204–213.
Kruck, S. E., Maher, J. J., & Barkhi, R. (2003). A framework for cognitive skill aquisition and spreadsheet training. In M. A. Mahmood (Ed.), Advanced topics in end user computing(Vol. 2, pp. 212–233). El Paso, TX: University of Texas at El Paso.
Lawson, B., Baker, K., Powell, S., & Foster-Johnson, L. (2009). A compar-ison of spreadsheet users with different levels of experience.Omega,37, 579–590. doi:10.1016/j.omega.2007.12.004
Melton, B., Dodge, M., Swinford, E., Couch, A., Legault, E., Schorr, B.
M., & Rusen, C. (2013).Microsoft Office Professional 2013 step by
step. Redmond, WA: Microsoft Press.
Nardi, B. A., & Miller, J. R. (1990). An ethnographic study of distributed
problem solving in spreadsheet development.CSCW 90 Proceedings,
197–208. Retrieved from http://dx.doi.org/10.1145/99332.99355 Nardi, B. A., & Miller, J. R. (1991). Twinkling lights and nested loops:
Distributed problem solving and spreadsheet development.International
Journal of Man-Machine Studies,34, 161–184. doi:10.1016/0020-7373 (91)90040-E
O’Leary, L., & O’Leary, T. (2013). Microsoft Office 2013: A case
approach. New York, NY: McGraw-Hill.
Panko, R. R. (1999). Applying code inspection to spreadsheet testing. Journal of Management Information Systems,16, 159–176.
Panko, R. R. (2000). Spreadsheet errors: What we know. what we think we
can do. Proceedings of the Spreadsheet Risk Symposium European
Spreadsheet Risks Interest Group (EuSpRIG), 7–17. Retrieved from http://arxiv.org/abs/0802.3457
Panko, R. R. (2003). Reducing overconfidence in spreadsheet
develop-ment. Proceedings of EuSpRIG 2003 Conference, 49–66. Retrieved
from http://arxiv.org/abs/0804.0941
Panko, R. R., & Port, D. (2012). End user computing: The dark matter (and
dark energy) of corporate IT.Proceedings of the 45th Hawaii
Interna-tional Conference on System Sciences, 1–14. Retrieved from http://ieeex plore.ieee.org/xpls/abs_all.jsp?arnumber=6149451
Panko, R. R., & Sprague, R. H. J. (1999). Hitting the wall: Errors in
devel-oping and code-inspecting a “simple” spreadsheet model.Decision
Sup-port Systems,22, 337–353.
Powell, S. G., & Baker, K. R. (2013).The art of modeling with
spread-sheets: Management science, spreadsheet engineering, and modeling craft(3rd ed.). San Francisco, CA: Wiley.
Powell, S. G., Baker, K. R., & Lawson, B. (2008). A critical review of
the literature on spreadsheet errors. Decision Support Systems, 46,
128–138.
Powell, S. G., & Willemain, T. R. (2006). How novices formulate models.
Part I: qualitative insights and implications for teaching.Journal of the
Operational Research Society,58, 983–995.
Raffensperger, J. F. (2001). New guidelines for spreadsheets.Proceedings
of EuSpRIG 2001 Conference, 61–76. Retrieved from http://arxiv.org/ abs/0807.3186
Rajalingham, K., Chadwick, D., & Knight, B. (2001). An evaluation of a
structured spreadsheet development methodology. Proceedings of
EuSpRIG 2001 Conference, 39–59. Retrieved from http://arxiv.org/abs/ 0801.1516
Rajalingham, K., Chadwick, D., Knight, B., & Edwards, D. (2000). Quality control in spreadsheets: A software engineering-based approach to
spreadsheet development.Proceedings of the 33rd Hawaii International
Conference on System Sciences. Retrieved from http://ieeexplore.ieee. org/xpls/abs_all.jsp?arnumber=926736
Read, N., & Batson, J. (1999). Spreadsheet modelling best practice.
Retrieved from http://www.eusprig.org/smbp.pdf
Reinhart, C. M., & Rogoff, K. S. (2010).Growth in a time of debt.
Work-ing paper no. 15639. Retrieved from http://www.nber.org/papers/ w15639
Ronen, B., Palley, M. A., & Lucas, H. C. (1989). Spreadsheet analysis and
design.Communications of the ACM,31, 84–93. Retrieved from http://
dl.acm.org/citation.cfm?id=63244
Scaffidi, C., Shaw, M., & Myers, B. (2005). Estimating the numbers of end
users and end user programmers.Proceedings of 2005 IEEE Symposium
on Visual Languages and Human, 207–214. Retrieved from http://dx. doi.org/10.1109/VLHCC.2005.34
Tort, F. (2010). Teaching spreadsheets: Curriculum design principles.
Pro-ceedings of EuSpRIG 2010 Conference, 99–110. Retrieved from http:// arxiv.org/abs/1009.2787
Vandeput, E. (2009). Milestones for teaching the spreadsheet program. In Proceedings of EuSpRIG 2009 Conference, 133–143. Retrieved from http://arxiv.org/abs/0908.1189
Vermaat, M. E. (2013). Discovering computers and Microsoft Office
2013: A fundamental combined approach. Stamford, CT: Cengage Learning.
Wang, W. (2013).Office 2013 for dummies. San Francisco, CA: Wiley.
Weinberg, G. (1998).The psychology of computer programming. New
York, NY: Dorset House.
Weverka, P. (2013).Office 2013 all-in-one for dummies. San Francisco,
CA: Wiley.
Willemain, T. R., & Powell, S. G. (2006). How novices formulate models.
Part II: A quantitative description of behaviour.Journal of the
Opera-tional Research Society, 58, 1271–1283. doi:10.1057/palgrave. jors.2602279
174 N. GARRETT