Quarterly Fiscal Bulletin April – June 2016 Page 1
QUARTERLY FISCAL BULLETIN
April – June 2016
Government Finance Statistics
(GFS)
GFS Vol. 14
Executive Summary
By the 30th June 2016, the General Government of Timor - Leste (GGoTL),
including the Petroleum (PF) and Donor fund (DF) ran a net operating balance of $.-38.0 million and had a net lending capacity of $-186.6 million. This is showing current fiscal position, as this money is being invested in the PF. However, the GGoTL is still strongly reliant on the PF to run its current level of operations, as without the PF and DF, the GGoTL would have ran a net operating Balance of $51.1 million.
Quarterly Fiscal Bulletin April – June 2016 Page 2 1. Revenues
By the end of June 2016 total revenues for the GGoTL, PF and DF amounted to $501.5 million. This was divided into 92.4 million from non-oil revenues, $334.7 million from oil revenues and $74.4 million from
DF.1
1.1. Non-oil Revenues
Non-oil revenues are composed of taxes, grants and other revenue by the end of second quarter of 2016. representing 14.8% of total oil and non-oil revenues by the end of second quarter 2016. These are divided into:
Non-oil taxes are the greatest source of revenue in the domestic non-oil economy (72.5% of total non-oil revenues) totalling $67.0 million by the end second quarter of 2016. These are divided into:
Taxes on income, profits and capital gains were 29.8% higher at the end of June 2016 compared to the same period last year, reaching $29.1 million at the end of the second quarter of 2016.
Taxes on goods and services totalled 31.3 million at the end of the second quarter of 2016. This collection was 34.2 % higher than the $ 23.3 million collected in the second quarter of 2015.
Taxes on international trade and transactions were 22.7% higher at the end of the second quarter of 2016
compared to the same period 2015 and amounted to $6.4 million by the 30th June 2016.
Other taxes totalled $0.26 million at the end of the second quarter 2016, compared to no other taxes collected during the same period of 2015.
Grants: By the end of second quarter of 2016, $440 million were received in transfers from the PF, this is 24.7% of the budgeted combination of ESI and excess withdrawals compared to 1,781.5 million in the Rectification budget of 2016.
Other revenue totalled $25.4 million by the end of the second quarter 2016, 2.3 % higher than the same period 2015. This increase was mostly due to a strong increase in revenue from sales of goods and services and other contributions such as property income.
Development Partner revenues
Revenues to the Donor Fund are obtained by means of grants received from all development partners which is classify by each appropriation category. By the end of the second quarter of 2016, amounted to $ 74.4 million.
1.2. Oil Revenues
Total Revenue from the PF accumulated $ 334.7 million by the end second quarter of 2016, which was 54.9% lower compared to the same period in 2015.
Oil revenues are the major source of revenues in Timor-Leste (representing 66.8% of total oil and non-oil revenues by the end of second quarter). These are divided into:
1Abstract
Quarterly Fiscal Bulletin April – June 2016 Page 3 Taxes in the second quarter of 2016 totalled $70.4 million, mostly due to income taxes recorded under taxes on income, profits and capital gains which reached $66.9 million and Taxes on goods and services by the end of the second quarter of 2016.
Other revenue included profit from oil, second tranche petroleum, interest, and trust and dividend income
and totalled $264.3 million by 30th of June 2016.
2. Expenses
Expenses incurred by the end of the second quarter of 2016 by the GGoTL, PF and DF amounted to $539.4 million. The GGoTL which spent $481.2 million, DF spent $49.7 million whilst $8.5 million were expenditures in the PF as operational cost.
a. General Government Expenditures
Expenditure categories for GGoTL are composed of:
Compensation of Employees was 3.3 % higher than the $82.1 million spent by the end of the second quarter
2015, totalling $84.8 million by 30th June 2016.
Use of Goods & Services reached $ 82.5 million by the end of the second quarter of 2016 ( -5.2% lower than the same period of 2015 which was $ 106.6 million).
Social benefits totalled $53.8 million by the end of the second quarter of 2016, 52.8% higher than was
recorded in the same period of 2015. It was mainly affected by cash advances on personal benefit payment.
Other expenses increased by 53.1% at the end of the second quarter of 2016 and totalled $ 260. million, compared to the same period of 2015 which amounted to $165.3 million during the second quarter of 2015. This was mostly due to a strong increase in current transfers of public grants and membership payments to international organizations, and other contributions.
Donor Fund Expenditures
Donor fund expenditure reached $49.7 million by the 30th June 2016. This was divided into $25.7 million on
other expenses; $4.3 million were expenditures on compensation of employees and $19.6 million was spent on use of goods and services.
b. Petroleum Fund Expenditures
Petroleum Fund expenses reached $448.5 million by the end of the second quarter of 2016, composed out of management fees, which increased by 4.7 % compared to the same period in 2015 reaching $ 8.5 million, and expenditure on grants to the GGoTL which totalled $440.0 million, decreasing by 1.1% compared to the same period in 2015.
3. Net Operating Balance
The net operating balance is calculated as revenues minus expenses and shows the government’s ability to sustain its current level of operations.
At the end of the second quarter of 2016, the GGoTL, DF and the PF were running a net operating deficit of $-38.0 million. However, petroleum revenues played a key role in the overall fiscal surplus. The net
operating deficit of the PF was $ -113.7 million by the 30th June 2016, which is mostly due to declined
revenue. The GGoTL received financial injections from the PF to run a net operating surplus of $126.9 million.
Quarterly Fiscal Bulletin April – June 2016 Page 4 The net acquisition of financial assets records transactions that change GGoTL’s holdings of non-financial assets. It is broadly equivalent to capital expenditure as recorded in the Charter of Accounts in Timor-Leste.
At the end of the second quarter of 2016, total acquisition of non-financial assets for the GGoTL including DF and PF stood at $148.6 million. $24.6 million was spent by the DF and $123.9 million was spent by the GGoTL (particularly on building and structures which totalled $123.5 million by the end of the second quarter of 2016).
5. Net Lending/Borrowing
Net lending / borrowing is the net amount a unit or a sector has available to finance, directly or indirectly, other units or other sectors. Net lending for the GGoTL including the PF and DF was $ - 186.6 million at the end of the second quarter of 2016, taking into account the combination of total revenue, expenditures and acquisition of non-financial assets. This means that the GGoTL and the PF incurred a deficit which is being invested in financial and non financial assets, but which was also affected by $11.5 million from loan disbursements at the end of the second quarter 2016.
6. Net Acquisition of Financial Assets
The increase in the Government’s holdings of financial assets is recorded under net acquisition of financial assets. In the case of Timor-Leste, the net lending capacity is being invested, mostly through the PF, in a range of financial assets including shares, securities, currency and deposits, cash and other equities.
By the end of the second quarter of 2016, the net acquisition of financial assets for the GGoTL, DF and the PF was $-175.1 million. This was composed of two parts: $-61.40 million due to the deficit from the CFTL cash balance to finance the gap between expenses and revenues in the GGoTL (this explains why the value is negative for currency and deposits in the tables in the annex) and a $-113.7 million deficit which was invested in financial instruments in the PF. Changes to the value of assets are attached in the table on Petroleum Fund stocks and flows.
7. Net Incurrence of Liabilities
The net incurrence of liabilities shows the loans disbursement to date in the GGoTL. This totalled $11.5 million by the 30th June 2016.
8. Final Conclusion
Quarterly Fiscal Bulletin April – June 2016 Page 6 Note: Statistical Discrepancy should be zero, Consumption of fixed capital will have to be calculated from inventory
Without PF, GGoTL runs Net Operation deficit US. $ 389.0 Million which is Total Domestic Revenue minus Total Expenditure
Quarterly Fiscal Bulletin April – June 2016 Page 9 Table 5 Petroleum Fund Stock and Flow (Balance sheet)
Stock (Balance sheet) Q3 Q4 Q1 Q2 Q3 Q4
Cash & cash equivilent 148.3 135.2 213.73 709.6
Receivables 50.5 26.9 50.41 36.97
Flow (Balance sheet) Q3 Q4 Q1 Q2 Q3 Q4
Cash & cash equivilent 55.2 (13.1) 78.55 495.83
Receivables 25.3 (23.6) 23.52 -13.44
2015
2015 2016
2016
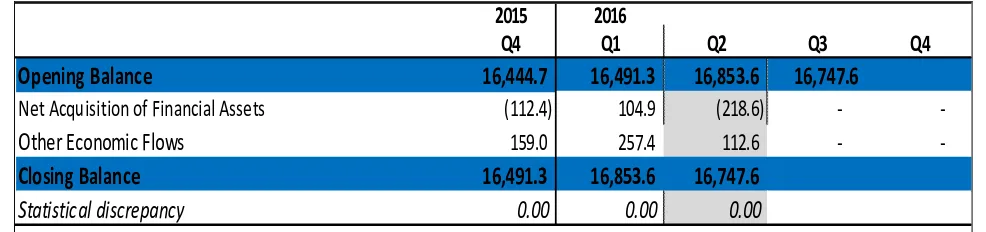
Table 6. Analytical Framework for the Petroleum Fund
2016
Q4
Q1
Q2
Q3
Q4
Opening Balance
16,444.7
16,491.3
16,853.6
16,747.6
Net Acquisition of Financial Assets
(112.4)
104.9
(218.6)
-
-Other Economic Flows
159.0
257.4
112.6
-
-Closing Balance
16,491.3
16,853.6
16,747.6
Statistical discrepancy
0.00
0.00
0.00
Note: Statistical Discrepancy should be zero.
Consumption of fixed capital will have to be calculated from inventory