The use of electrical impedance spectroscopy to assess the
physiological condition of kiwifruit
Anne D. Bauchot
a,1, F. Roger Harker
a,*, W. Michael Arnold
baThe Horticulture and Food Research Institute of New Zealand Ltd., Mt Albert Research Centre,Pri
6ate Bag92 169, Auckland,New Zealand
bIndustrial Research Ltd.,Gracefield Research Centre,P.O.Box31-310,Lower Hutt,New Zealand
Received 30 December 1998; received in revised form 9 August 1999; accepted 10 August 1999
Abstract
The electrical impedance of kiwifruit [Actinidia deliciosa(A. Chev) C.F. Liang et A.R. Ferguson, cv. Hayward] was studied during fruit ripening. Measurements were made on whole fruit, and tissues excised from the outer pericarp, inner pericarp and core. Alternating current at frequencies between 50 Hz and 1 MHz was passed through fruit and tissue samples, and complex impedance spectra were separated into the resistances of the apoplast, cytoplasm and vacuole, and capacitances of the plasma membrane and tonoplast. The differences in R50 Hz andR1 MHz between
tissues (representative of apoplast resistance and total tissue resistance, respectively) were explained in terms of the anatomy and composition of the respective tissues. Some variations were seen from one year to the other. During ripening, there was little change in the impedance characteristics of the fruit, despite a 10-fold decrease in firmness. This was unexpected since previous studies with nectarine, persimmon and tomato fruit have shown a considerable reduction in impedance during ripening. The failure to observe any impedance change was checked using a number of different methods for measuring impedance, by two different laboratories, and confirmed by measuring electrolyte leakage from tissue discs. All the results suggested that the mobility of electrolytes within the cell wall did not change during kiwifruit ripening. We speculate that physicochemical interactions that take place within the cell wall may have a major impact on the impedance of kiwifruit tissue. © 2000 Published by Elsevier Science B.V. All rights reserved.
Keywords:Apoplast; Cell wall; Fruit ripening; Kiwifruit; Reactance; Resistance
www.elsevier.com/locate/postharvbio
1. Introduction
Electrical impedance spectroscopy (EIS) has been widely used to assess the in vivo condition of animal and plant tissues (Cole, 1972; Settle et al., 1980; Lewis et al., 1989). Recently, there has been an increasing interest in the use of this technique to assess fruit ripening (Harker and Dunlop, 1994; * Corresponding author. Tel.:+64-9-8493660; fax: +
64-9-8154202.
E-mail address:[email protected] (F.R. Harker)
1Present address: Department of Agricultural Botany,
School of Plant Sciences, The University of Reading, Whiteknights, PO Box 221, Reading, Berkshire RG6 6AS, UK.
Harker and Maindonald, 1994; Inaba et al., 1995). The advantage of EIS is that electrical circuit diagrams can be used to interpret impedance spectra in terms of components of resistance and capacitance associated with struc-tures at the cellular level (Zhang et al., 1990; Zhang and Willison, 1991).
Electrical impedance studies have provided a useful insight into ripening of nectarines (Harker and Dunlop, 1994; Harker and Maindonald, 1994), persimmon (Harker and Forbes, 1997) and tomato (Varlan and Sansen, 1996). For example, the resistance of the apoplast declined by 60% when nectarine fruit were ripened immediately after harvest, and differences in cell wall resis-tance were associated with the presence and ab-sence of woolly texture (Harker and Maindonald, 1994). Furthermore, the development of chilling injury during storage of New Zealand-grown ‘Fuyu’ persimmon fruit was indicated by changes in the cytoplasmic resistance (Harker and Forbes, 1997). In the present study, we have extended this research to kiwifruit; which has been used as a model for studying fruit softening (MacRae and Redgwell, 1992). The kiwifruit consists of four distinct tissue zones: skin, outer pericarp, inner pericarp and seeds, and the core. Each of these tissues differs in firmness (Jackson and Harker, 1997), mineral and sugar contents (Ferguson, 1980; MacRae et al., 1989), cell wall composition (Redgwell et al., 1991, 1992) and cell characteris-tics (Hallett et al., 1992). The core is composed of a single population of spherical/ellipsoidal cells (0.1 and 0.2 mm diameter), whereas the outer pericarp is composed of a population of large cells (0.5 – 0.8 mm diameter) dispersed in a matrix of smaller cells (0.1 – 0.2 mm diameter) (Hallett et al., 1992). The inner pericarp consists of the locules, which are enclosed within locule walls (Hallett et al., 1992). Each locule is composed of large radi-ally elongated thin-walled cells (0.2 – 0.4 mm×\ 1 mm) and seeds, while the locule wall is a narrow region composed of smaller thicker walled cells (Hallett et al., 1992). In this study, the impedance characteristics of individual tissues, outer pericarp, inner pericarp and core, as well as whole fruit, have been examined during fruit ripening.
2. Material and methods
2.1. Plant material
Kiwifruit (Actinidia deliciosa C.F. Liang et A.R. Ferguson cv. ‘Hayward’) weighing 130 – 150 g were harvested at commercial maturity from orchards in the Bay of Plenty (New Zealand) in May 1995, 1996 and 1997, and stored at 0°C. Fruit were stored for various lengths of time before they were ripened. Ripening was initiated using a 12 h ethylene treatment (1 ml l−1
) and then changes in firmness, soluble solids content and electrical impedance were followed through-out the ripening process. All ripening treatments and fruit evaluations were at 20°C, and a mini-mum of ten fruit per day was evaluated at each assessment date. In 1995, fruit were stored for up to 10 weeks, and samples removed as required. In 1996, fruit were assessed on the day following harvest (15 May) and again after 29 weeks storage at 0°C. In 1997, fruit were ethylene-treated on 21 May, and ripening was followed over a 9-day period.
2.2. Fruit firmness and soluble solids content
A patch of skin was removed from the fruit equator and a 7.9 mm Effegi probe was driven into the flesh at 240 mm min−1using an Instron
materials testing machine (Model 4301, Instron, Canton, MA). The soluble solids content (%) was determined for juice expressed from the blossom and stem ends of each kiwifruit using a hand-held refractometer (Model N-20E, Atago, Tokyo, Japan).
2.3. Preparation of tissue samples
according to Repo (1994). The ends of a cylindri-cal tissue plug were inserted into insulating tubes (30 mm long, 5 mm inner diameter) filled with an electrode gel (Sigma Gel, Parker Lab. Inc., Orange, NJ). Silver/silver chloride half cells (Ag/AgCl; 2 mm diameter×5 mm; World Precision Instruments, Sarasota, FL) were inserted into the gel and connected to the measurement instrumentation. This method of preparing the tissue samples and connecting them to instrumentation caused some prob-lems (see Section 3.1). Thus, a number of modifi-cations were made to the method in subsequent years.
In 1996, rectangular blocks of tissue (5×5×35 mm) were excised from the outer pericarp so that one surface consisted of the fruit skin, and thus was undamaged. The tissue block was im-paled by a linear array of four silver wire (0.5 mm diameter; World Precision Instruments, Sarasota, FL) electrodes, spaced at 10 mm intervals, as described previously (Harker and Dunlop, 1994; Harker and Maindonald, 1994). In turn, silver wire electrodes 1 and 2, then 1 and 3, and finally 1 and 4, were connected to the measurement instrumentation. In 1997, the impedance was measured in whole fruit and ex-cised blocks of tissue (5×5×35 mm) from the outer pericarp, inner pericarp and core. Measure-ment of excised tissues was carried out as de-scribed for the 1996 studies. However, for whole fruit impedance measurements, two Ag/AgCl half-cells were impaled 20 mm apart into fruit. Measurements were made on opposite sides of each fruit.
2.4. Electrical impedance measurements
Initially (in 1995), the tissue impedance compo-nents were measured according to Zhang and Willison (1991) and Harker and Dunlop (1994), using a function generator (Thurlby Thandar Model TG230, Huntingdon, UK) and an oscillo-scope (Iwatsuo Model SS-7610, Tokyo, Japan). Alternating current at frequencies between 50 Hz and 1 MHz was passed through the tissue sam-ples. Impedance characteristics were determined from the dimensions of an ellipse traced on the
oscilloscope. In later work, impedance character-istics were determined using either a Hewlett-Packard Model HP4194A impedance analyser (Packard, Hyogo, Japan), or a Hewlett-Packard Model HP4284A Precision LCR meter (Hewlett-Packard, Hyogo, Japan). The HP4194A was operated at 100 mV generator voltage, and scanned 101 spot frequencies between 100 Hz and 10 MHz. The HP4284A was operated at genera-tor voltages of 300 mV for excised tissues and 500 mV for whole fruit, and scanned 36 spot frequen-cies between 50 Hz and 1 MHz.
2.5. Calculations of tissue resistance and reactance
When electrical contact with the tissue sample was made via Ag/AgCl half cells placed into an electrode gel or directly into whole fruit, the electrode resistance (the resistance associated with electrochemical interactions at the electrode surface) was minimal, and the impedance data could be directly used in electrical models (see below). However, when an array of silver wire electrodes was impaled into the tissue sample, it was necessary to account for the electrode resis-tance before the data could be modelled. A linear plot of resistance and reactance against interelec-trode distance did this. The intercept on the y axis reflects the electrode resistance (or reactance) and the slope reflects the tissue resistance (or reactance) (Zhang and Willison, 1991). Only tis-sue resistance and reactance were considered fur-ther.
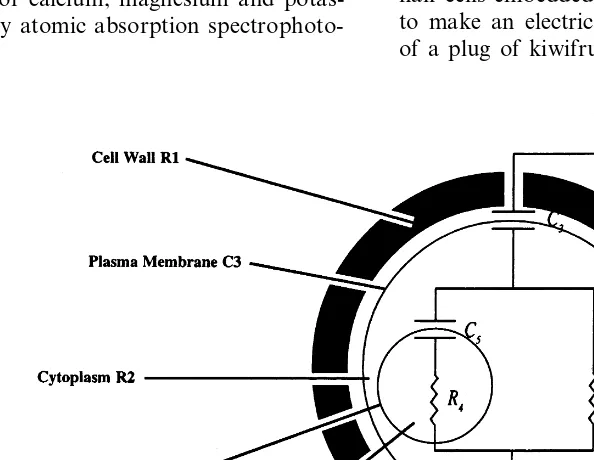
2.6. Modelling of impedance in fruit tissue
For each tissue sample, tissue resistance and reactance was fitted to an electrical circuit dia-gram (Fig. 1) using S-PLUS functions described by Harker and Maindonald (1994). The model is based on the structure of plant cells, as proposed by Zhang et al. (1990).
2.7. Electrolyte leakage and mineral analysis
into 4 mm thick slices, and 5 mm diameter discs of outer pericarp or core tissue excised using a cork borer. It was not possible to use discs of inner pericarp tissue, due to poor tissue cohesion during incubation in solutions. The discs were rinsed for 1 min in 0.6 osmol mannitol (corresponding to the isotonic concentration of the fruit, Harker and Hallett, 1994) and blotted dry. For each ripening treatment, four lots of discs, about 2 g of tissue, were incubated in 20 ml 0.6 osmol mannitol or 20 ml of water for 4 h at 25°C in a shaking water bath. Electrolyte leakage was estimated at regular intervals throughout the experiment using a con-ductivity meter (Konductimeter CG875, Schott Geraete, Germany). The total electrolyte leakage was measured after the discs had been freeze-thawed.
Upon completion of the experiment, the min-eral content of the tissue and an aliquot of the leakage solution was determined. Samples were dried at 60°C, digested in HNO3– HClO4,
and analysed for calcium, magnesium and potas-sium content by atomic absorption spectrophoto-metry.
3. Results and discussion
3.1. De6elopment of methods for measuring
impedance in kiwifruit
Preliminary studies in 1993 used samples of kiwifruit outer cortical tissue with dimensions similar to those used in studies with nectarine (10×10×50 mm; Harker and Maindonald, 1994) which were impaled by a linear array of electrodes. In these early studies we were unable to detect any influence of ripening on impedance (data not presented). It was thought that this may have been due to a small amount of inner pericarp tissues contained within the large blocks of outer pericarp providing a short circuit pathway. In 1995 we ensured that samples contained a single tissue zone by excising shorter (25 mm length) and thinner (5 mm diameter) plugs of tissue. With these small tissue plugs it was only possible to make an electrical connection using the approach of Repo (1994) on Scots pine shoots. Ag/AgCl half cells embedded in an electrode gel were used to make an electrical contact with opposite ends of a plug of kiwifruit tissue.
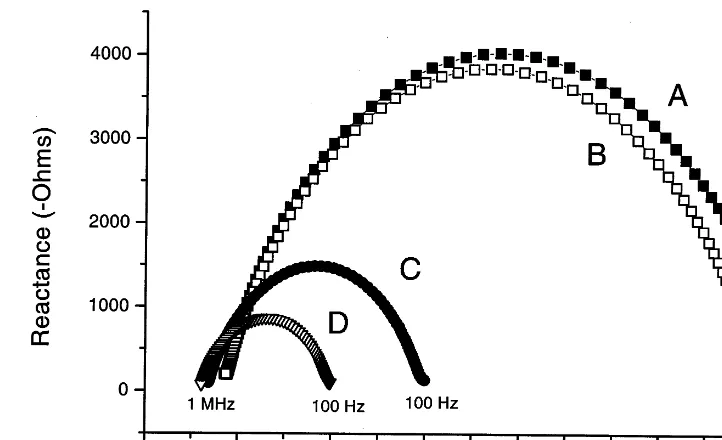
Fig. 2. Cole – Cole plots showing the effect of the electrode gel on impedance of kiwifruit tissue. The impedance of a plug of tissue was measured after 3 min (A) and 10 min (B), as described in the text, with the electrode gel placed at both ends of the plug. At the 11th minute, the plug was cut into three sections, which were sandwiched together in series with electrode gel, before re-measuring impedance at 12 min (C) and 20 min (D).
Even with this method, no change in impedance characteristics of outer pericarp, inner peri-carp, or core during fruit ripening (data not shown) was observed. In addition, the electrical impedance of the tissue seemed to reduce during the time it took to scan the different frequency measurements. The test took 20 min to complete because the measurements were being made man-ually using an oscilloscope and a function genera-tor. To confirm that there was no impedance change during ripening, a complementary study was undertaken at Gracefield Research Centre using a Hewlett Packard HP4194A impedance analyser. In this case it was possible to character-ise the time-dependent reductions in impedance of individual tissue samples, since each frequency sweep took less than 1 minute. Fig. 2 shows the reduction in impedance that occurred within a tissue sample over a 10 min period (curves a and b). The arcs were generated by plotting reactance against resistance for each of the spot frequencies tested (Fig. 2), and the contraction in the diameter
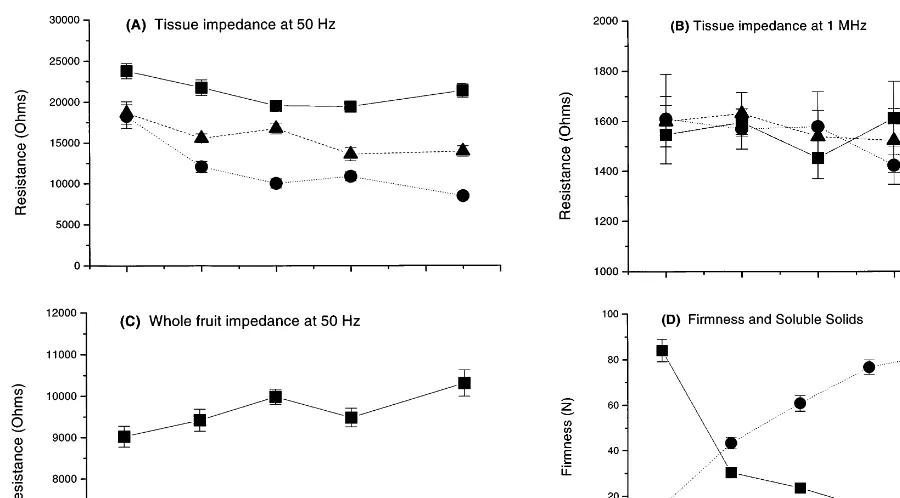
Fig. 3. Changes in electrical resistance, firmness and soluble solids during kiwifruit ripening (1997 data). (A) Resistance at 50 Hz of excised blocks (5×5×35 mm) of outer pericarp (), inner pericarp ( ) and core () tissue. (B) Resistance at 1 MHz of excised tissue blocks (symbols as in A). (C) Resistance at 50 Hz of whole kiwifruit. (D) Firmness () and soluble solids ( ). Points represent mean9S.E. (n=10).
3.2. Differences between tissue zones and changes during ripening
Generally, the resistance of the cell wall and associated extracellular fluid is measured at low frequencies (50 Hz), while the resistance through the entire cell is measured at high frequencies (1 MHz) (Cole, 1972; Stout, 1988; Zhang and Willison, 1991). In kiwifruit, R50 Hz of the core
was always highest, while R50 Hz of the inner
pericarp was always lowest (Fig. 3). In 1995, R50 Hz of the outer pericarp was similar to that of
the core at all stages of ripeness (data not shown). In 1997,R50 Hzof the outer pericarp was similar to
the inner pericarp at harvest, but decreased more slowly than the inner pericarp during ripening. Thus from day 2 onwards, R50 Hz of the outer
pericarp was intermediate between the core and
Table 1
Resistances of the apoplast, cytoplasm and vacuole, and capacitance of the plasma membrane in kiwifruit outer pericarp, inner pericarp and core tissuesa
Residuals Resistance (ohms)
Tissue Capacitance of plasma membrane (nF)
Apoplast Cytoplasm Vacuole
1.9690.21 37009200
13,9009300
Outer pericarp 17,1009700 30009100 30009100 13,0009400
15,0009800
Inner pericarp 1.6090.19 32009200
15,4009600 13,0009300 30009100 1.7790.20 33009200 Core
aValues represent the mean9S.E. for 49 fruit (all stages of ripeness combined) studied in 1997, as modelled using the circuit
Table 2
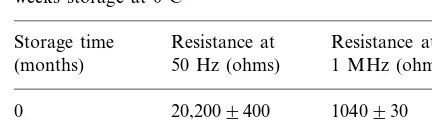
Resistance of outer pericarp tissue at harvest and after 29 weeks storage at 0°Ca
Storage time Resistance at Resistance at 1 MHz (ohms)
aValues represent mean9S.E. for 50 fruit; data from 1996.
ited impedance changes occur in ripening kiwifruit. However, an earlier study using whole kiwifruit found that impedance declined during kiwifruit ripening (Sugiyama et al., 1987). Differences in the results obtained in this study and that of Sugiyama et al. (1987) may reflect differences in the inherent quality of the fruit, the storage times and perhaps development of chilling-type disorders. Indeed, we found that kiwifruit impedance declined during 29 weeks storage at 0°C (Table 2), suggesting that ripening/softening during long-term storage differs from that following ethylene treatment of freshly harvested fruit. Further confirmation that impedance did not change during ripening of ethylene-treated fruit was sought by studying elec-trolyte leakage.
3.3. Electrolyte leakage
Measurements of electrolyte leakage may be useful when trying to confirm the results obtained using electrical impedance spectroscopy. Earlier studies have found that tissues with highR50 Hztend
to have low rates of electrolyte leakage from tissue discs (Furmanski and Buescher, 1979). A high rate of electrolyte leakage might be expected when cellular membranes are permeable, so that solutes rapidly diffuse into the apoplast and then out into the incubation solution. R50 Hz is an in vivo
mea-surement that is sensitive to the concentration of electrolytes in the apoplast. Thus, when electrolyte leakage is high, the apoplast will probably contain high concentrations of electrolytes and R50 Hzwill
be low, and vice versa.
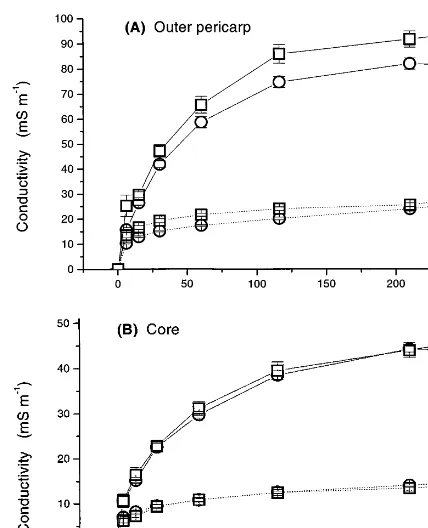
When measuring electrolyte leakage, it is impor-tant to incubate the tissue discs in isotonic solu-tions, since fruit cells burst and rapidly loose their contents when placed in water (Simon, 1977). In kiwifruit, outer pericarp and the core disks, the ion leakage in 0.6 osmol mannitol was about one-third that in water (Fig. 4). However, when the tissue disks were incubated in either water or mannitol, the outer pericarp disks released more than twice as much electrolyte as the core disks (Fig. 4). This was related to the level of cations (mainly potassium) initially present in the tissues (Table 3).
The conductivity of solutions after incubation of freeze-thawed tissue (Table 3) is a measure of total inner pericarp (Fig. 3). The low resistance of the
inner pericarp may be explained by being the softest tissue zone (Jackson and Harker, 1997) and very translucent, suggesting that it contains compara-tively less air space and perhaps more fluid-filled extracellular spaces than other tissues. Results obtained at 1 MHz were not consistent between years. In 1995, the resistance at 1 MHz (R1 MHz) of
the core was generally higher than that of the outer or inner pericarp, which were similar; 56009300, 29009200 and 28009100 (mean9S.E. ohms), respectively. However, in 1997, there was no differ-ence between tissue zones (Fig. 3). These differdiffer-ences in R1 MHz, where they exist, may relate to
differ-ences in the concentrations of sugars and elec-trolytes in the cells. Sugars have insulatory properties while electrolytes have conductive prop-erties (Stout, 1988). The core has the lowest concen-tration of mobile cations such as potassium (Table 3; Ferguson, 1980) and the highest concentration of sugars (MacRae et al., 1989), which would have contributed to its high electrical resistance in 1995. Mineral and sugar content of tissues was not determined in 1997, and therefore we are unable to confirm whether or not electrolyte and sugar con-centrations were similar in all three tissue zones. The modelled cellular electrical characteristics of different tissue zones in 1997 are shown in Table 1.
lim-Fig. 4. Conductivity changes reflecting electrolyte leakage from discs of unripe () and ripe () kiwifruit during incubation in mannitol (dotted line) and water (solid line). All samples used 2 g tissue in 20 ml of liquid. Points represent mean9S.E.; data from 1995.
was slightly lower in the ripe pericarp disks than in the unripe disks, this difference was not significant (Fig. 4). The observation that leakage of ions from unripe and ripe disks was the same supports the impedance data in suggesting that there is no change in concentration of apoplastic electrolytes during ethylene-induced ripening.
3.4. Implications for the physicochemical nature of the kiwifruit cell wall
The ultrastructural and chemical changes that occur in the kiwifruit cell wall during ripening have been well characterised (Hallett et al., 1992; MacRae and Redgwell, 1992). However, knowl-edge of the physicochemical interactions that oc-cur within the fruit cell wall and apoplast is limited. Such interactions must take account of the ionic and sugar composition of the apoplast, inter-actions between water molecules and polysaccha-rides, as well as chemical and ultrastructural changes. There are few such studies, and our understanding of water relations within the fruit cell wall/apoplast is largely based on fundamental knowledge of water relations in plants (e.g. To-mos, 1988) and molecular interactions between polysaccharides and water molecules (Suggett, 1975). Most recently, Redgwell et al. (1997) char-acterised the in vivo and in vitro swelling be-haviour of cell walls from nine temperate fruit species. Cell walls from fruit that softened markedly during ripening tended to exhibit either in vivo or in vitro swelling, whilst cell walls from fruit that only softened slightly did not swell. Out of the nine species studied, kiwifruit cell walls amount of electrolytes available for leakage.
Incu-bation for 4 h in water or mannitol resulted in 94% or 38% of these total electrolytes leaking from core disks, and 98% or 37% of total electrolytes leaking from outer pericarp disks (Fig. 4; cf. Table 3). Leakage of electrolytes was identical in disks of unripe and ripe core tissue, and although leakage
Table 3
Mineral analyses of kiwifruit tissues and total conductivity of electrolytes released by freeze-thawing of 2 g tissue samples in 20 ml of liquidsa
Mineral content (mg g−1FW) Total conductivity (mS m−1)
Magnesium Potassium
Ripeness
Tissue Calcium In mannitol In water
8292 7092
0.6390.02 0.1490.01
9.0190.44 Unripe
Outer pericarp
0.1690.01 0.6990.03 7692
Ripe 10.2390.10 9794
Core Unripe 4.5190.66 0.2690.01 0.4190.01 3893 4791 Ripe 4.2390.27 0.2690.02 0.4290.07 3792 4992
exhibited the greatest capacity to swell both in vivo and in vitro (Redgwell et al., 1997). Redistri-bution of water between symplast and apoplast is necessary for hydration and subsequent swelling of cell walls. As a consequence of in vivo swelling, an expansion of the volume of the apoplast and an associated decline in the electrical resistance might be expected.
At low frequencies, EIS essentially measures the conductivity of the apoplast. The absence of any impedance change during kiwifruit ripening is a phenomenon that differs markedly from that observed in tomato and nectarine, both of which exhibit substantial reductions in impe-dance during ripening (Harker and Maindonald, 1994; Varlan and Sansen, 1996). This suggests that physicochemical changes to the apoplast dur-ing ripendur-ing may differ considerably between fruit types. We speculate that the lack of any change during ripening of kiwifruit can occur as a result of two mechanisms. Firstly, there is an increase in transmembrane leakage of electrolytes (as is generally assumed during ripening of most fruit; Brady, 1987), but changes in the cell wall structure result in the binding of these elec-trolytes. Alternatively, membrane function may be maintained during kiwifruit ripening so that there is no net increase in electrolytes in the apoplast.
It is often suggested that the electrolytes are immobilised by a gel that develops in the cell wall during woolly breakdown in stonefruit (Furman-ski and Buescher, 1979; Harker and Maindonald, 1994). A similar explanation could also account for the lack of impedance change during kiwifruit ripening. Explanations that involve electrolytes being bound or held within the cell wall generally invoke formation of some form of cell wall gel. Polysaccharide gels are common in biology and indeed most polysaccharides can be induced to gel under some conditions (Suggett, 1975). Mecha-nisms for gelling can include the formation of helical junctions (e.g. agarose and carrageenans), stacked junctions (e.g. pectinate and alginate gels formed by the addition of Ca2+), micelle junc-tions (e.g. methylcellulose gels formed as a result of ‘hydrophobic bonding’; Suggett, 1975). If a gel forms within kiwifruit tissue, it is most likely to be
a pectin-based gel. Commercially, pectins can be induced to form a gel upon cooling particularly when the water activity is lowered, or at low pH in the presence of calcium (Suggett, 1975). Ki-wifruit have remarkably high concentrations of calcium when compared to other fruit (Ferguson, 1980), and thus the possibility of calcium gel must be considered.
The alternative explanation — i.e. that there is no change in net electrolyte concentrations in the apoplast since electrolyte leakage from the symplast and active uptake from the apoplast remain in equilibrium throughout fruit ripening — is not supported by the available information. This explanation implies that the plasma mem-brane must at least retain a constant level of ion transport throughout ripening. However, the function of the cell membranes is known to change. Transmembrane potentials in cells and isolated cytoplasmic vesicles are much lower in stored kiwifruit than in fresh kiwifruit (homme and Rona, 1988). In their study, Ched-homme and Rona (1988) demonstrated that electrical polarisation difference between stored and fresh kiwifruit was not only due to a diffusive process.
In conclusion, differences in the R50 Hz and R1 MHz of the outer pericarp, inner pericarp and
core could be explained through differences in firmness and volume of extracellular fluid, as well as differences in the sugar and ionic content of cells, respectively. However, the impedance of these various tissues did not change markedly during kiwifruit ripening. This was an unexpected observation since impedance generally decreases during ripening of other fruit such as nectarine, tomato and persimmon (Harker and Maindonald, 1994; Varlan and Sansen, 1996; Harker and Forbes, 1997). We speculate that the failure to observe any de-crease in R50 Hz during ripening indicates that
Acknowledgements
We thank the New Zealand Foundation for Research Science and Technology for funding this study, and Teresa Wegrzyn for her help and advice.
References
Brady, C.J., 1987. Fruit ripening. Annu. Rev. Plant Physiol. 38, 155 – 178.
Chedhomme, F., Rona, J.P., 1988. Electrical properties of tonoplasts from cells and vesicles of storage kiwifruits. J. Plant Physiol. 133, 89 – 95.
Cole, K.S., 1972. Membranes, Ions, and Impulses. A Chapter of Classical Biophysics. University of California Press, Berkeley, CA.
Ferguson, I.B., 1980. Movement of mineral nutrients into the developing fruit of the kiwifruit (Actinidia chinensis Planch.). New Zealand J. Agric. Res. 23, 349 – 353. Furmanski, R.J., Buescher, R.W., 1979. Influence of chilling
on electrolyte leakage and internal conductivity of peach fruits. HortScience 14, 167 – 168.
Hallett, I.C., MacRae, E.A., Wegrzyn, T.F., 1992. Changes in kiwifruit cell wall ultrastructure and cell packing during postharvest ripening. Int. J. Plant Sci. 153, 49 – 60. Harker, F.R., Dunlop, J., 1994. Electrical impedance studies
of nectarines during coolstorage and fruit ripening. Postharvest Biol. Technol. 4, 125 – 134.
Harker, F.R., Forbes, S.K., 1997. Ripening and development of chilling injury in persimmon fruit: an electrical impedance study. New Zealand J. Crop Hortic. Sci. 25, 149 – 157.
Harker, F.R., Hallett, I.C., 1994. Physiological and mechani-cal properties of kiwifruit tissue associated with texture change during coolstorage. J. Am. Soc. Hortic. Sci. 119, 987 – 993.
Harker, F.R., Maindonald, J.H., 1994. Ripening of nectarine fruit: changes in the cell wall, vacuole, and membranes detected using electrical impedance measurements. Plant Physiol. 106, 165 – 171.
Inaba, A., Manabe, T., Tsuji, H., Iwamoto, T., 1995. Electri-cal impedance analysis of tissue properties associated with ethylene induction by electric currents in cucumber (Cu-cumis sati6usL.) fruit. Plant Physiol. 107, 199 – 205. Jackson, P.J., Harker, F.R., 1997. Changes in firmness of the
outer pericarp, inner pericarp, and core ofActinidiaspecies during ripening. New Zealand J. Crop Hortic. Sci. 25, 185 – 189.
Lewis, G.S., Aizinbud, E., Lehrer, A.R., 1989. Changes in electrical resistance of vulvar tissue in holstein cows during ovarian cycles and after treatment with prostoglandin F2a.
Anim. Reprod. Sci. 18, 183 – 197.
MacRae, E., Redgwell, R., 1992. Softening in kiwifruit. Postharvest News Inform. 3, 49N – 52N.
MacRae, E.A., Bowen, J.H., Stec, M.G.H., 1989. Maturation of kiwifruit (Actinidia deliciosa cv Hayward) from two orchards: differences in composition of the tissue zones. J. Sci. Food Agric. 47, 401 – 416.
Redgwell, R.J., Melton, L.D., Brasch, D.J., 1991. Cell-wall polysaccharides of kiwifruit (Actinidia deliciosa): effect of ripening on the structural features of cell-wall materials. Carbohydr. Res. 209, 191 – 202.
Redgwell, R.J., Melton, L.D., Brasch, D.J., 1992. Cell wall dissolution in ripening kiwifruit (Actinidia deliciosa): solu-bilization of the pectic polymers. Plant Physiol. 98, 71 – 81.
Redgwell, R.J., MacRae, E., Hallett, I., Fischer, M., Perry, J., Harker, R., 1997. In vivo and in vitro swelling of cell walls during fruit ripening. Planta 203, 162 – 173.
Repo, T., 1994. Influence of different electrodes and tissues on the impedance spectra of scots pine shoots. Electro-Magne-tobiology 13, 1 – 14.
Settle, R.G., Foster, K.R., Epstein, B.R., Mullen, J.L., 1980. Nutritional assessment: whole body impedance and body fluid compartments. Nutr. Cancer 2, 72 – 80.
Simon, E.W., 1977. Leakage from fruit cells in water. J. Exp. Bot. 28, 1147 – 1152.
Stout, D.G., 1988. Effect of cold acclimation on bulk tissue electrical impedance 1. Measurements with Birdsfoot Tre-foil at subfreezing temperatures. Plant Physiol. 86, 275 – 282.
Suggett, A., 1975. Polysaccharides. In: Franks, F. (Ed.), Wa-ter: A Comprehensive Treatise, vol. 4. Plenum, NewYork, pp. 519 – 567.
Sugiyama, J., Hayashi, T., Horiuchi, H., 1987. Electrical impedance of kiwifruit. Nippon Shokuhin Kogyo Gak-kaishi 33, 725 – 730.
Tomos, A.D., 1988. Cellular water relations in plants. Water Sci. Rev. 3, 186 – 277.
Varlan, A.R., Sansen, W., 1996. Nondestructive electrical impedance analysis in fruit: normal ripening and injuries characterization. Electro-Magnetobiology 15, 213 – 227. Zhang, M.I.N., Willison, J.H.M., 1991. Electrical impedance
analysis in plant tissues: a double shell model. J. Exp. Bot. 42, 1465 – 1475.
Zhang, M.I.N., Stout, D.G., Willison, J.H.M., 1990. Electrical impedance analysis in plant tissues: symplasmic resistance and membrane capacitance in the Hayden model. J. Exp. Bot. 41, 371 – 380.