Vol. 16, No. 1 (2010), pp. 51–67.
THE NEW NOTION DISTANCE OF CONTENT BASED
IMAGE RETRIEVAL (CBIR)
Dyah E. Herwindiati
1, Sani M. Isa
2, and Rahmat Sagara
31
Department of Informatics Engineering - Universitas Tarumanegara, [email protected]
2
Department of Informatics Engineering - Universitas Tarumanegara, [email protected]
3
Department of Mathematics Education - Sampoerna School of Education,
Abstract.This paper proposes a new notion distance on the CBIR process which is derived from the measure of multivariate dispersion called vector variance (VV). The minimum vector variance (MVV) estimator is robust estimator having the high breakdown point. The CBIR is a retrieval technique using the visual information by retrieving collections of digital images. The process of retrieval is carried out by measuring the similarity between query image and the image in the database through similarity measure. Distance is a metric often used as similarity measure on CBIR. The query image is relevant to an image in the database if the value of similarity measure is ’small’. This means that a good CBIR retrieval system must be supported by an accurate similarity measure. The classical distance is generated from the arithmetic mean which is vulnerable to the masking effect. The appearance of extreme data causes the inflation of deviation of the arithmetic mean, this implies the distance between the extreme data or the outlier becomes closer than it supposed to be. In the end of section we discuss the high performance of the MVV robust distance to CBIR process.
Key words and Phrases: High Breakdown Point, Image Retrieval, Query image, Similarity Measure, Image Visual Content
2000 Mathematics Subject Classification: 62H35 Received: 11-01-2010, accepted: 25-03-2010.
Abstrak.Karya ilmiah ini mengusulkan suatu ukuran jarak yang baru pada proses CBIR yang diturunkan dari ukuran dispersi multivariate yang dikenal dengan vek-tor varians (VV). Minimum vekvek-tor varians (MVV) adalah robust estimavek-tor yang mempunyaibreakdown pointtinggi. Metode CBIR adalah teknik untuk melakukan pencarian citra digital berdasarkan informasi visual dalam membangun sistem pen-carian untuk data berkapasitas besar. Sistem penpen-carian CBIR yang baik harus didukung oleh nilaisimilarity measureyang akurat.Similarity measureadalah su-atu teknik yang digunakan untuk mengukur tingkat kesamaan antara citra kueri dengan citra pada basis data berdasarkan jarak antara dua citra tersebut. Suatu citra kueri disebut relevan terhadap citra pada basis data jika nilaisimilarity mea-suredari citra tersebut ’kecil’. Beberapa ukuran jarak yang sering digunakan seba-gai ukuran kesamaan proses CBIR adalah jarak klasik yang dibangun dariaritmetic meandan rentan terhadapmasking effect. Sebuah data ekstrim dapat menyebabkan membesarnya deviasi observasi terhadap rata-ratanya, sehingga jarak antara nilai pusat terhadap rata-rata tersebut menjadi lebih dekat. Di akhir pembahasan karya ilmiah ini ditunjukkan kinerja yang baik dari jarak robust MVV untuk proses CBIR.
Kata kunci: Breakdown Point Tinggi, Image Retrieval, Citra Kueri, Similarity Measure,Image Visual Content
1. Introduction
Informations contained in an image can be visual informations or semantic informations. The visual informations can be stated in general contexts in form of colours, textures, shapes, spatial relations, or in other specified forms which valid in the domain of certain problems. Content-based image retrieval (CBIR) is a retrieval technique which uses the visual information by retrieving collections of digital images. The visual information are then extracted and stated as a feature vector which in the sequel then forms a feature database.
Content-based image retrieval (CBIR), is also known as query by image con-tent (QBIC) and concon-tent-based visual information retrieval (CBVIR) is an appli-cation of the computer vision to the problem of digital pictures retrieval in a large data base. This retrieval system is proposed as an attempt in providing better pictures management and retrieval, which traditionally uses explanation texts of the pictures. The process of retrieval is carried out by measuring the similarity between query image and the image in the database through similarity measure.
Distance is a metric which is often used as similarity measure on CBIR. The classical distance is often used in the retrieval process. The distance is generated from an arithmetic mean. The precission of classical distance is not high because of the masking effect. The appearance of extreme data causes a large enough deviation of the arithmetic mean, this implies that the masking effect causes the extreme data or the outlier becomes closer to the clean data. Barnet and Lewis [4] stated that the masking effect is caused by the tendency of extreme data which are not recognized as outliers, which in fact they are outliers. The data even covers other extreme data so they cannot be detected as outliers.
Various robust estimation methods have been proposed to reduce the masking effect. Recently, the most popular approach, is a robust approach that uses a crite-ria which minimize the determinant of covacrite-riance matrix, this is well known as min-imum covariance determinant (MCD). Some researchers, for example Rousseeuw and Van Zomeren [21], Hadi [9], Hawkins [12], Becker & Gather [5], Rousseeuw and Van Driessen [22], Billor et.al [6] gave interesting and important information about sub robust sample of MCD. The sub sample is used to compute robust estimator which is useful to generate a robust distance.
MCD is derived from the multivariate dispersion measure which is known as generalized variance (GV). The word dispersion synonyms to the word spread which is shown by a group of data (Anderson [2]). The most popular measure of dispersion in univariate data is the standard of deviation. Different from univariate data, the measure of dispersion on the multivariate data is generated based on the structure of covariance which is recorded in a matrix of covariance Σ. There are two popular multivariate dispersion, the total variance (TV), and the generalized variance (GV).
In the development of the multivariate analysis, GV is more popular than TV. This is very natural, since GV or|Σ|involves all of the information in every element ofΣ, no matter those is contained in the variance structure or covariance. Meanwhile the total variance (TV), which is defined as Tr(Σ) does not involve the covariance structure. TV only involves the variance structure.
This paper proposes robust distance on the CBIR process which is derived from the measure of multivariate dispersion called vector variance (VV). Good properties of VV mentioned by Herwindiati et.al [13] that VV takes shorter time of computation than CD. Further description of VV will be given on Section 3. Two examples in Section 4 discuss the CBIR process on the image of a flower based on feature of color and feature of texture. Section 4 also discusses the performance of MVV through the precision of retrieval process. We hope that the discussion on this paper will contribute to the development of CBIR.
2. Image Retrieval
the early of 90’s. In the last decade, a lot of progress attained in theoretical research CBIR or in the development of the CBIR system. But, up to now there are still many challenging problems in the field of CBIR which attracts attention of many scientists from various disciplines.
Late of 1970’s is the beginning era of research in CBIR. On 1979 there was conference on application of database technique in image, held in Florence. Since then, the application of image database management technique became an area of research that attracted many scientists. The technique used in the beginning of CBIR did not used the visual content yet, but relied on the textual information of each image (Text Based Image Retrieval – TBIR). On the other word, additional textual information is needed on every image before retrieval. Then the images can be retrieved by using the textual approach DBMS. Text based image retrieval uses the traditional database technique to manage the image database. Through textual description, image can be organized based on topic or level of hierarchies to make the navigation process and browsing easier. One thing which is almost impossible is to create a system that able to give additional textual information to every image, so most TBIR system needs manual process to add the textual information. This additional process is very difficult to carry on when the size of image database is too large, and it is very subjective, sensitive to the context and incomplete.
In 1992, National Science Foundation of United States held a workshop on Information Management System which aimed to determine future direction of the system of image database management. At that time researchers had already real-ized a fact that taking advantage of the visual properties contained in images is a more efficient way and intuitive in representing and indexing visual information of images. Scientist from various backgrounds such as computer vision, database man-agement, human-computer interface, and information retrieval since then started their research in CBIR. Since 1997, publication in visual information extraction, organization, indexing, user query and interaction, and database management has increased significantly. An advance in CBIR was marked by commercial develop-ment of image retrieval system for governdevelop-ment organization, private institutions and hospitals.
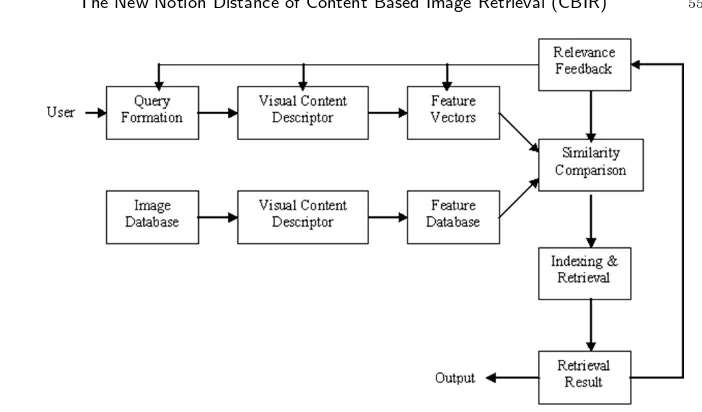
CBIR makes use of visual contents of image, such as shapes, texture, spatial layout, to represent and to index images. Generally in an image retrieval system, the visual content of images is stored in a multi dimension feature vector. To retrieve an image, users enter inputs of the form image query or sketch. Then the CBIR system computes the feature vector of the query images or sketch. Similarity between the feature vectors of query image/sketch is obtained based on a measure of distance or index scheme. The index scheme is a more efficient way to retrieve images on the database. The latest CBR system has entered feedbacks from users (relevance feedback) to alter the retrieval process to obtain better result, perceptually and to get more precise semantic meaning. Long [17] describes the CBIR process as Figure 1.
Figure 1. The Diagram of CBIR
information from the whole images, meanwhile the local descriptor makes use visual information of image region to describe the visual content of images. A system of image retrieval generally stores visual contents of an image in a multi dimension feature vector. In an image retrieval process, users enter inputs of the form query image. Next, the CBR system computes the feature vector of the query image. Similarity between the feature vectors of the query images is obtained based on the measurement of distance of index scheme. This research uses the distance measure as a measurement tool of similarity of global visual content.
3. The Robust Distance for Similarity OF CBIR
are applied to the multivariate data cases. Even for data mining of large data and high dimension, such as in data mining and knowledge discovery (Angiulli and Pizzuti, [3]), and intrusion detection (Ye et al., [27]), the mechanism of detection outlier is extremely important parts of a thorough analysis.
Derquenne [7] implicitly stated the measure of identification multivariate out-liers is created by a technique transforms random vectors to be random variables so that candidates of outlier will be seen more clearly. The most popular transfor-mation is the Mahalanobis distance.
Mahalanobis distance is a distance which measures every observation X~ to
~¯
X given by sample covarianceS, and formulated by
d2S(X,~¯ S) = (X~ −X~¯)tS−1(X~ −X~¯).
Presence of one or more outliers alters the arithmetic mean X~¯ significantly, and
d2
S(X,~¯ S) increases. The Mahalanobis distance is not robust to outliers and vulner-able to masking effect. Barnet and Lewis [4] define the masking effect as an effect of the tendency of extreme data which is not recognised as outliers, but in fact are outliers.
One of impacts of masking effect is occurrence of distortion of sample mean and variance. To handle this problem, the method of robust estimator introduced by Huber [14] is applicable as theoretical foundations of the construction of distance which is robust Mahalanobis.
Various methods of robust estimation can be found in literatures. Rousseeuw [19] introduced minimum volume ellipsoid (MVE) and minimum covariance deter-minant (MCD) methods withh= [n
2 + 1] andnis the size of the sample. Here [z]
represents the integer part ofz. Rousseeuw and van Zomeren [21] proposed the use of MVE to choose subsets having minimum volume of ellipsoid and covers at leasth
data. Hawkins [12] introduced the feasible solution algorithm (FSA) to determine
hdata which give covariance matrices of minimum determinant. For the same sake, Rousseeuw and van Driessen [22] proposed FMCD. The difference between the two methods lies in the process of determininghdata. It was mentioned by Hardin and Rocke [10], also Werner [24] that FMCD is faster than MVE, MCD or even than FSA.
MVV is generated by measure of disperse multivariate vector variance (VV). Different than CD, VV is still able to measure the multivariate dispersion, though, the covariance matrix is singular. Geometrically VV is a square of length of the diagonal of a parallelotope generated by all principal components ofX~, Djauhari [8]. This good property of VV motivated Herwindiati et al [13] to generate a new measure, MVV, as a measure to detect outliers. Relation among TV, GV or CD, and VV can be described as follow: Suppose X~ is a random vector of covariance matrix Σ of dimension (p×p) where λ1 ≥λ2 ≥. . . ≥ λp are eigen values of Σ.
Then TV = Tr(Σ) =λ1+λ2+. . .+λp, CD = GV =|Σ|=λ1·λ2·. . .·λp and
VV =λ2
1+λ22+. . .+λ2p.
Robust distance of MVV is a robust distance generated by the estimator MVV. This estimator is obtained from a criterion which minimizes the vector vari-ance (VV). Just like MCD, MVV estimator possesses high break down point and of affine equivariant. Another good property of MVV is that MVV possesses smaller time complexity than MCD, i.e. O(p2). Herwindiati et al [13] discussed the MVV algorithm in detailed fashion. A brief description of the algorithm is as follow: given nrandom samples X~1, ~X2, . . . , ~Xn of dimension ap-variate. Suppose TMVV
and CMVV are MVV estimators for location parameters and covariance matrix.
Both estimators are defined based on a set H consists of h= [n+p2+1] data which gives covariance matrix CMVV of minimum Tr(CMVV2 ) among all possiblehdata.
Then,
TMVV=
1
h
X
~ Xi∈H
~
Xi (1)
CMVV=
1
h
X
~ Xi∈H
(X~i−TMVV)(X~i−TMVV)t (2)
The one of the goodness estimator properties is the affine equivariant; which is property is not influenced by affine transformation. MVV estimator is affine equivariant estimator. Consider random samplesX~1, ~X2, . . . , ~Xnof random vectors
~
X of location parameter T ∈ Rp and scale parameter C in the space of p×p
symmetric matrices. SupposeX defines ann×pmatrix where thek-th row isX~t k.
A location estimatorTn(X)∈Rp is said to have the affine equivariant property if
for every vector~b∈Rp and every nonsingularp×pmatrixAthe condition
TMVV(AX+~b) = 1
h
X
~ Xi∈H
(AX~i+~b) =ATMVV+~b (3)
CMVV(AX +~b) =
1
h
X
~ Xi∈H
(AX~i−ATMVV)(AX~i−ATMVV)t
4. The MVV Robustness Measure
The breakdown point is a quantitative measure to describe the concept of robustness. Rousseeuw and Leroy [20] defined from the context of a sample that breakdown point is the smallest fraction of data which causes the value of estimator to be infinity when the value of all data in the fraction are changed to be infinity. The concept of breakdown point is highly related to the concept of estimator bias. Consider Tn(X) and Cn(X) are mean vector and covariance matrix of sample.
Suppose the estimatorTn(X) becomesTn(X∗) if the value ofmdata are changed.
Rousseeuw and Leroy [20] define breakdown pointε∗
n(T, ~X), for sample of sizenas
follows
bias(m, T, ~X) = sup X∗
kTn(X∗)−Tn(X)k (5)
ε∗
n(T, ~X) = min{
m
n|bias(m, T, ~X) infinite} (6)
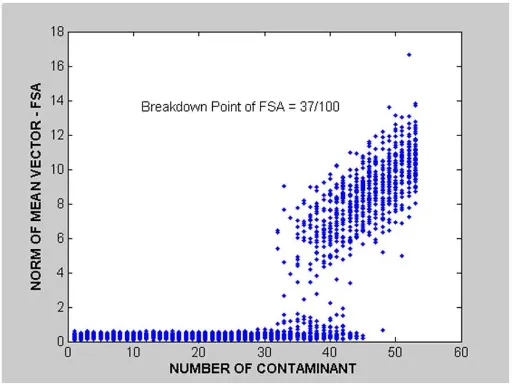
MVV is high breakdown point. The following figures: Figure 2, Figure 3 and Figure 4 are illustrated the breakdown point FSA, FMCD and MVV.
Figure 2. The Simulation Breakdown Point of FSA
Figure 3. The Simulation Breakdown Point of FMCD
Figure 4. The Simulation Breakdown Point of MVV
5. The Influence of Outlyingness Observations on MVV Estimators
change to the estimator. The estimator is said not sensitive if there is no significant change due to removal of outlier.
There are many ways to measure the sensitivity; this paper comes up bringing simple discussion, both on computations and the theoretical distribution. Consider data set Xn={X~1, ~X2, . . . , ~Xn}ofp-variate normal distribution, the scatter matrix
matrixAis of Wishart distribution with parameterΣand degree of freedomn−1, written asA∼Wp(Σ, n−1) ,Ais independent ofX~¯ (see Wilks [26]).
DefineA−i the scatter matrix removing the ith observation, say the ith
ob-servation is an outlying obob-servation. The scatter matrix A−i by is formulated
as
The ratio of scatter matrix as the consequence of removal theith observation is given by
~bi is of Normal distribution Np
~0,Σ and independent of Ai (see
Mar-dia et. al. [18]). Ri can be shown of distribuion beta n−2p−1,p2
. The proof was discussed in Mardia et. al. [18] and rewritten in Appendix completed with surveying the probability density function which was skipped by Mardia et. al. as an exercise. Since the distribution of 1−~bt
iA−1~bi is beta
The distribution of classical approach is well known, it is different with the robust approach. The distribution of robust is not easy to be composed. Usually we have to do the simulation approach to get the distribution. In the section will be discussed the sensitivity and the approximated distribution of robust approach. Let data set X ={X~1, ~X2, . . . , ~Xn}ofp-variate observations. If observations
taken from it a subset H ⊆ X consist of h data points, then X~1, ~X2, . . . , ~Xh are
The location and scale estimator can be computed as,
~¯
XR= 1
h
X
~ Xi∈H
~
Xi (9)
AR= X
~ Xi∈H
(X~i−X~¯R)(X~i−X~¯R)t (10)
Based on limit central theory, ifX~1, ~X2, . . . , ~Xn∼Np(~µ,Σ) then the
distri-bution of SRcan be approximated by
mc−1SR∼Wp(Σ, m) (11)
(see Hardin and Rocke [11]). It means that
AR= X
~ Xi∈H
(X~i−X~¯R)(X~i−X~¯R)t=c−1 SR
m (12)
Ifc= 1 thenAR∼ m1Wp(Σ, m).
The ratio of robust scatter matrix because of an outlier deletion
RRi =|A
R
−i|
|AR|.
To draw an analogy between the clasical approach to the robust approach, the distribution ofRRi approximated by
RRi ∼beta(n−p−2 2 ,
p
2). The estimator is said to be insensitive to an outlier when
RRi >beta(n−p−2 2 ,
p
2).
For the illustration of sensitivity of classical and MVV robust measure, let the multivariate data having size n = 100, p = 10 data contain k = 2 outliers which are far from a bulk of data. The sensitivities of two methods, the classic and robust MVV method, are measured by using the ratioR−k. Table 1.1 has contents
of ratio.
Table 1. The Ratio ofR−k
The Method:
The Value Classical Robust
R−k 0.123119 0.916667
Cut Off 0.958491 0.853018 Sensitivity to outliers Very sensitive* Insensitive
becomes to be inflated when the outliers ’present’ on the data set. The contrary with the classical sensitivity, the MVV estimator is not sensitive from ’presenting’ or removing outliers.
6. Experiment and Analysis
In this section is discussed the robust performance of MVV in two CBIR experiments on flower images by colors and textures.
The first experiment is carried out to find out whether the robust MVV distance able to differ species of flowers of ’almost the same colors’. For this purpose, it is chosen 3 species of flowers ofred colourandalmost redof different texture, i.e. Red Hibiscus, Red Rose and Potentilla Napalensis as the following.
Figure 5. The Images of Red Flower (a) Red Hibiscus (b) Red Rose and (c) Potentilla Napalensis
The first stage of CBIR process is to build an image database by extracting the characteristics of whole database. The extraction of characteristic is carried out to catch characteristic of color through the color moment method and the characteristic of texture through the wavelet transform feature. The color moment method yields characteristic vector of dimension 14×1, meanwhile the wavelet transform feature method yields characteristic vector of texture of 7×1. The images which are used are of format bitmap(.bmp)of maximum resolutionm×n
pixels. Having characteristic extraction stage, all resulted vectors are stored in the database.
The next stage of CBIR is to process the image retrieval, which is started from entering query image. The images then processed to find out the value of color characteristic extraction and the texture characteristic. The characteristic extrac-tion process on the query image yields two characteristic vectors, the dimension of these vectors will be the same with characteristic vectors in the images database. Similarity of the result of retrieval process is measured by using the robust MVV distance.
In the first experiment, the image of red hibiscus, red rose and potentilla napalensis will be ’searched’ from a database red flower image for 30 times. In the each retrieval process will be appeared 5 relevant images. The precision of retrieval process will be listed in Table 1.2.
Table 2. The Precision of The First Experiment
Mean of Precision:
The Species of Flower Mahalanobis MVV Robust Distance Distance
Red Rose 90% 92%
Red Hisbiscus 72% 96% Potentilla Napalensis 66% 94%
Grand Mean of Precision 76% 94%
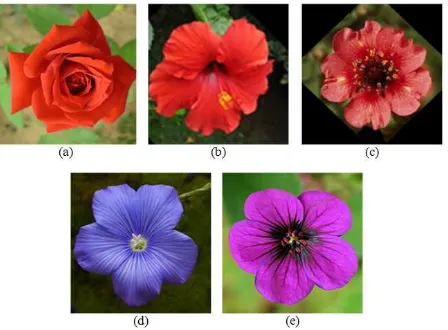
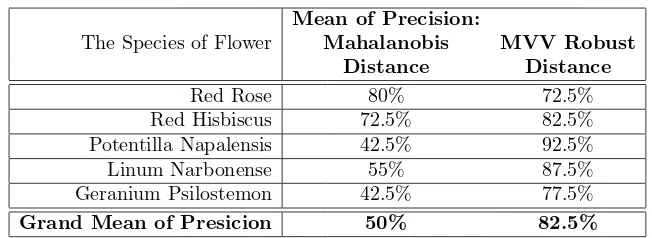
In the second experiment, it will be checked whether MVV is able to measure the similarity of flowers in a better way. By choosing 5 species of flowers of color ’tend to red’, and ’tend to purple’, three of the same species as previous experiment, other species are Linum Narbonense and Geranium Psilostemon as follow
Figure 6. The Images of Flower (a) Red Hibiscus (b) Red Rose and (c) Potentilla Napalensis, (d) Linum Narbonense (e) Geranium Psilostemon
Table 3. The Precision of the Second Experiment
Mean of Precision:
The Species of Flower Mahalanobis MVV Robust Distance Distance
Red Rose 80% 72.5%
Red Hisbiscus 72.5% 82.5% Potentilla Napalensis 42.5% 92.5% Linum Narbonense 55% 87.5% Geranium Psilostemon 42.5% 77.5%
Grand Mean of Presicion 50% 82.5%
7. Remark
From the experiment, it is unveiled that the robust MVV distance is a reliable measure to measure the propinquity of characteristics of an image query to the data base image.
References
[1] Alt, F. B. and Smith, N. D., ”Multivariate Process Control”,Handbook of Statistics7(1988), 333 - 351.
[2] Anderson, T.W.,An Introduction to Multivariate Statistical Analysisa, Second Edition, John Wiley, New-York, 1984.
[3] Angiuli, F. and Pizzuti, C., ”Outlier Mining and Large High Dimensional Data Sets”,IEEE Transaction on Knowledge and Data Engineering17(2)(2005), 203 - 215.
[4] Barnett, V. and Lewis, T.,Outliers in Statistical Data, Second Edition, John Wiley, New-York, 1984.
[5] Becker, C. dan Gather, U., ”The Masking Breakdown Point of Multivariate Outlier Identifi-cation Rules”,Journal of American Statistical Association94(1999), 947 - 955.
[6] Billor, N., Hadi, A.S. and Velleman, P.F., ”BACON: blocked adaptive computationally effi-cient outlier nominators”, J. Computational Statistics and Data Analysis 34(2000), 279 -298.
[7] Derquenne, C., ”Outlier Detection Before Running Statistical Methods”, J. Siam 34(2)
(1992), 323 - 326.
[8] Djauhari, M.A., ”Improved Monitoring of Multivariate Process Variability”,Journal of Qual-ity Technology 37(1)(2005), 32 - 39.
[9] Hadi A.S., ”Identifying multivariate outlier in multivariate data”,Journal of Royal Statistical Society B 53(3)(1992), 761 - 771.
[10] Hardin, J dan Rocke, D. M., ”The Distribution of Robust Distance”, (2002), http://www.cipic.ucdavis.edu/ dmrocke/preprints.html
[11] Hardin, J dan Rocke, D. M., ”The Distribution of Robust Distance”,J. of Computation and Graphical Statistics14(2005), 928 - 946.
[12] Hawkins, D.M., ”Feasible Solution Algorithm for the Minimum Covariance Determinant Es-timator in Multivariate Data”, J. Computational Statistics and Data Analysis 17(1994), 197 - 210.
[14] Huber, P. J., ”Robust Estimation of Location Parameter”,Annals of Mathematical Statistics
35(1964), 73 - 101.
[15] Kotz S dan Johnson N.L.,Encyclopedia of Statistical Sciences, John Wiley, New York, 1985. [16] Irwin, J.O., ”On a Criterion for the Rejection of Outlying Observations”, J. Biometrics
17(3/4)(1925), 238 - 250.
[17] Long, F., Zhang, H. and Feng, D.D., Multimedia Information Retrieval and Management, Spinger, Berlin, 2003.
[18] Mardia, K. V., Kent, J. T., and Bibby, J. M.,Multivariate Analysis, Academic Press, London, 1979.
[19] Rousseeuw, P.J., ”Multivariate Estimation with High Breakdown Point”, Paper appered in Grossman W., Pflug G., Vincze I. dan Wertz W., editors, Mathematical Statistics and ApplicationsB(1985), 283 - 297. D. Reidel Publishing Company.
[20] Rousseeuw, P.J and Leroy A. M., Robust Regression and Outlier Detection, John Wiley, New-York, 1987.
[21] Rousseeuw, P.J. dan Van Zomeren, B.C., ”Unmasking Multivariate Outliers and Leverage Points”,Journal of American Statistical Association85(441)(1990), 633 - 639.
[22] Rousseeuw, P.J. and van Driessen, K., ”A Fast Algorithm for The Minimum Covariance Determinant Estimator”,J. Technometrics41(1999), 212 - 223.
[23] Thompson, W. R., ”On a Criterion for the Rejection of Observation and the Distribution of the Ratio of Deviation to Sample Standard Deviation”, J. The Annals of Mathematical Statistics6(4)(1935), 214 - 219.
[24] Werner, M.,Identification of Multivariate Outliers in Large Data Sets, PhD. Thesis, Univer-sity of Colorado at Denver, 2003.
[25] Wilks, S. S.,Finite-Dimensional Vector Spaces, Springer-Verlag, New-York, 1974 [26] Wilks, S. S., ”Multivariate Statistical Outliers”,J. Sankya A25(1963), 407 - 426.
APPENDIX
By applying the Equation A.2.3m in Mardia et. al [18], we have:
Ri=
Proof 1.1. Recall that ~bi and A−i are independently distributed as Np
r. Since the probability density function (pdf ) of W is
then the pdf ofY is