KEDUNG BULUS SUB-WATERSHED (GOMBONG DISTRICT)
USING REMOTE SENSING AND FOREST INVENTORY DATA
Tyas Mutiara Basuki and Nining Wahyuningrum
Carbon stock in tree biomass can be quantified directly by cutting and weighing trees. It is assumed that 50% of the dry weight of biomass consists of carbon. This direct measurement is the most accurate method, however for large areas it is considered time consuming and costly. Remote sensing has been proven to be an important tool for mapping and monitoring carbon stock from landscape to global scale in order to support forest management and policy practices. The study aimed to (1) develop regression models for estimating carbon stock of pine forests using field measurement and remotely sensed data; and (2) quantify soil carbon stock under pine forests using field measurement. The study was conducted in Kedung Bulus sub-watershed, Gombong - Central Java. The derived data from
(SPOT) included spectral band 1, 2, 3, and 4, Normalized Differences Vegetation Index (NDVI), and Principle Component Analysis (PCA) images. These data were integrated with field measurement to develop models. Soil samples were collected by augering for every 20 cm until a depth of 100 cm. The potential of remote sensing to estimate carbon stock was shown by the strong correlation between multiple bands of SPOT (band 2 , 3; band 1, 2, 3; band 1, 3, 4; and band 1, 2, 3, 4) and carbon stock with r = 0.76, PCA (PC1, PC2, PC3) and carbon stock with r = 0.73. The role of pine forest to reduce CO in the atmosphere was demonstrated by the amount of carbon in the tree and the soil. Carbon stock in the tree biomass varied from 26 to 206 Mg C ha and in the soil under pine forest ranged from 85 to 194 Mg Cha .
Keywords: Remote sensing, carbon stock, field measurement
1* 1
Received : 22 September 2012, Accepted : 16 June 2013
ABSTRACT
Satellite Probatoire d'Observation de la Terre
2
-1 -1
I. INTRODUCTION
Carbon stock assessment in a forest ecosystem is necessary for many applications, from conservation of land productivity to emission mitigation of CO purposes. Carbon stock in tree biomass can be assessed using a destructive method or non-destructive methods, such as allometric equations or models based on remote sensing. Direct measurement through destructive sampling can be conducted by felling and weighing tree biomass and assuming that 50% of the dry biomass composed by carbon organic (Intergovernmental Panel on Climate Change/ IPCC, 2003).
2
Direct measurement of carbon stock in tree biomass is considered impractical for large areas (Gibbs ., 2004). In this regard, remote sensing can be used to estimate tree biomass for landscape or broader levels. Remotely sensed data provide continuos information, cover large area, and objective data (Foody ., 2003; Rosenqvist ., 2003). A common method to assess above-ground biomass (AGB) or carbon stock in tree biomass using remote sensing is by developing a regression model between extracted values from a remote sensing image and AGB or tree parameters from field measurement. The developed model, then used to predict AGB for other trees having similar characteristics to those of the trees used to develop the regression model. The extracted values are considered as independent variable and can be extracted from a
et al
et al et al
1
*Forestry Research Institute on Watershed Management
index (NDVI) is frequently applied to estimate forest stand parameters or AGB.
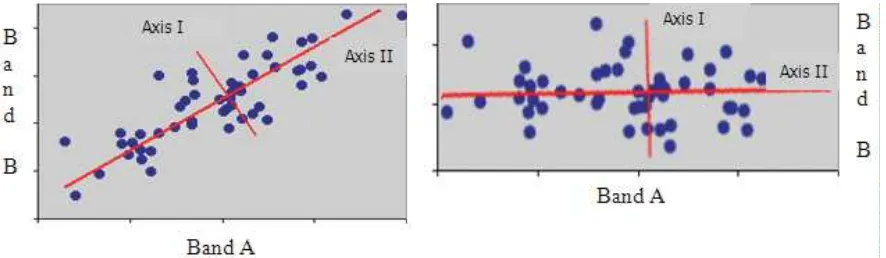
In addition to vegetation indices, a transformation technique such as Principal Component Analysis (PCA) is applied to estimate tree biomass. The purpose of this transformation is to compress all of the information contained in an original -band data set into fewer than “new bands” (Lillesand ., 2004). The new bands are then used instead of the original data. Principal component image data values are simply linear combinations of the original data values multiplied by the appropriate transformation coefficients. These coefficients are statistical
quantities known as or
which are derived from the variance/covariance matrix of the original image data (Lillesand , 2004). In other words, principal component image is a linear combination of the original data and the eigenvector on a pixel-by-pixel basis throughout the image. Image transformation using PCA was successfully applied by Lu . (2004) for biomass estimation in Brazilian forest. It was observed that PC1 had strong correlation with above-ground biomass (Lu ., 2004).
Although all the studies mentioned above reported that independent variables derived from remotely sensed data had strong correlation with above-ground biomass, however, the models were not validated. Transferability of the models to other study areas is uncertain. Therefore, in this study we developed regression models followed by validation using independent data set.
Besides quantifying carbon stock in tree biomass, assessment on soil organic carbon is necessary because soil can also be used as a carbon
n n
remotely sensed data; and (2) to quantify soil carbon stock under pine forests using field measurement. In this study, we applied a single band, NDVI, and PCA to estimate carbon stock in tree biomass. In addition, multi bands combination are also used in order to improve the accuracy of carbon stock estimation.
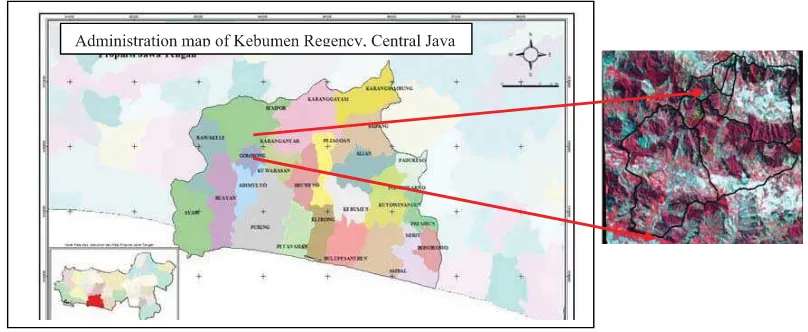
The study was conducted in Kedung Bulus sub-watershed in Gombong, Central Java. The location lies between 336000 mE - 345000 mE and 9162500 mS - 9170000 mS. The forest is dominated by pine ( ) with various ages, from 4 to 37 years. Soil in the study area are association of Distropets, Tropudults, and Troportents. Rainfall recorded in Somagede climate station from 2009 to 2012 showed that the mean annual rainfall was 3202 mm yr , and the mean monthly rainfall ranged from 7 to 628 mm month . Topographic is from undulating to rolling with gentle to very steep slopes Figure 1 shows location of the study area.
A field measurement was conducted to collect the necessary data. A purposive sampling regarding to stand age was applied to allocate 31 sample plots. The size of the plot was 20 by 20 m. The DBH of all of the trees within each plot were measured. Twenty one plots were used for developing regression models and the rest were for validation. The diameter range and the number of trees within each plot are presented in Table 1.
Pinus merkusii
II. MATERIAL AND METHOD
A. Study Area and Ground Data Collection
Figure 1. Location of the study area on SPOT 4 (black line is the boundary of Kedung Bulus sub-watershed)
Table 1. Characteristics of the trees within each plot for training and validation of the models
Training plot
No Age (Year) Diameter (cm) No of tree
per plot
Minimum Maximum Average
1 34 21.3 47.8 37.4 19
2 34 23.6 47.4 35.2 15
3 4 4.1 19.7 10.0 47
4 34 25.5 47.5 40.1 14
5 36 16.2 47.8 32.3 18
6 11 5.4 31.2 15.7 36
7 21 17.2 37.9 28.2 22
8 14 8.6 33.7 23.6 28
9 25 21.8 39.2 30.3 20
10 11 8.0 29.6 20.7 28
11 26 25.5 39.5 35.1 14
12 22 24.5 43.0 31.9 23
13 34 25.8 45.2 34.4 15
14 26 18.2 38.2 27.4 20
15 34 30.9 58.9 41.5 11
16 32 18.2 42.4 32.5 29
17 17 9.6 28.7 22.0 22
18 37 15.9 47.8 32.5 15
19 24 14.3 37.6 25.9 31
20 24 13.1 40.4 24.7 31
21 10 18.8 29.0 23.6 16
Validation plot 1 25 27.1 61.8 37.1 19
2 19 12.4 41.7 24.8 29
3 34 27.4 47.5 37.2 15
4 34 30.6 57.3 41.5 14
5 26 14.3 34.1 24.6 23
6 17 11.1 35.0 23.0 29
7 14 10.2 35.4 25.3 19
8 37 29.6 47.8 38.0 15
9 14 22.5 28.7 22.5 23
The above-ground biomass resulted from the allometric equation was converted to carbon stock by assuming that 50 % of the biomass consisted of carbon (IPCC, 2003).
Soil samples were collected by augering for every 20 cm depth until 100 cm or less than 100 cm when parent material was found. The samples were undertaken from 8 selected plots where the forest inventories were conducted. The soil organic matter was analyzed using Walkley and Black method in the laboratory.
A SPOT 4 image acquired in May 13 2008, path/row 291/365, was geo-rectified to the Universal Transverse Mercator (UTM) coordinate system with datum WGS 1984 and zone 49 South. This image was used to generate independent variables consisted of spectral band 1 (green), band 2 (red), band 3 (near infrared), band 4 (middle infrared), NDVI and PCA.
B. Image Processing and Data Analysis
plotted against either of the original axes (band A and B).The data along the second principal component direction have less variance. This is a characteristic for all the principal component images. In general, the first principal component (PC1) includes the largest percentage of the total scene succeeding components images (PC2, Pc3, ….PCn) in which each contains a decreasing percentage of scene variance.
To reduce error from GPS reading and geo-referencing, the independent variables were the mean of the extracted values from 3 x 3 pixels (Austin ., 2003; Lucas ., 2006).
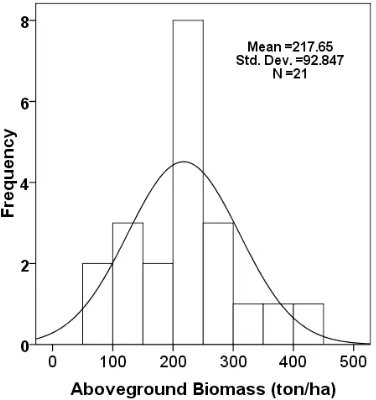
Prior developing the regression models, the AGB data were tested for the normality (Figure 3). Simple and multiple regression models were developed to examine the correlations between dependent variable (carbon stock) and independent variable (spectral band of SPOT 4 and PCA) using the training data. Every model was cross validated using an independent data set (n=10).
et al et al
III. RESULT AND DISCUSSION
A. Aboveground Carbon Stock Estimation Using Remotely Sensed Data and Field Measurements
Based on the computation using the IPCC (2003)'s allometric equation, the estimated aboveground carbon stocks in the plot vary from 26 to 206 Mg Cha (Table 2).
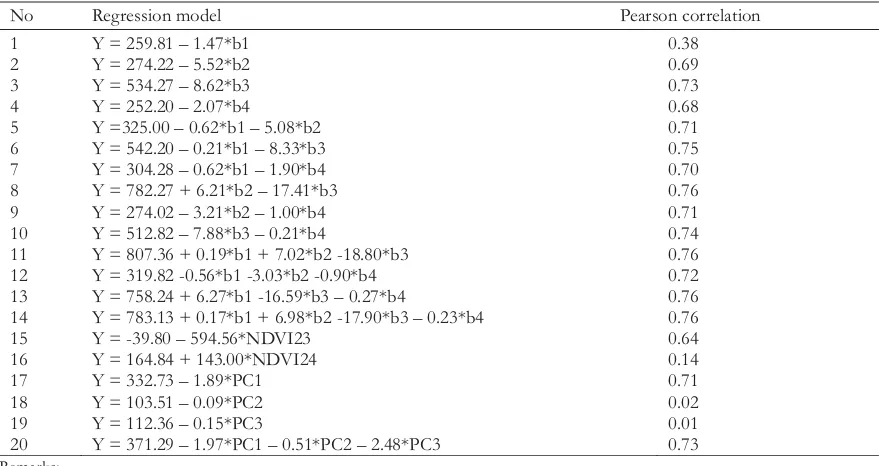
The estimated carbon stocks from plot measurements were assumed to be the measured values and then these were correlated with extracted values of the SPOT image. Table 3 presents regression models between independent (remotely sensed data) and dependent (carbon stock in tree biomass) variables. For a single band, near infrared band (b3) of SPOT 4 shows the highest correlation with carbon stock in tree biomass, while PC3 and PC2 do not correlate with
-1
carbon in tree biomass. In the near infrared spectrum region, vegetation provides the strongest reflectance that can be captured by the sensor. Chlorophyll content reflects most of the near infrared spectrum. Moreover, chlorophyll content of vegetation represents the canopy volume. This phenomenon is in agreement with research conducted by Tangki and Campell (2008) who found a strong relationship between above-ground biomass with near infrared band of Landsat-5 TM.
Multiple bands combination tends to slightly improve correlation between the remotely sensed data with the carbon stock in tree biomass. Multiple bands combinations involving the near infrared (e.g. b1,3; b2,3; b1,2,3; b2,3,4; and b1,2,3,4) provide higher correlation compared to the other combinations. Similar results are obtained by Basuki et al. (2012). Regression Figure 3. Normality test for the training data (n=21)
Table 2. The aboveground C-stock estimated using the IPCC (2003)'s allometric equation in the 21 points for modeling
Plot no.
Aboveground C-stock (Mg C ha )-1
Plot no.
Aboveground C-stock (Mg C ha-1)
Plot no.
Aboveground C-stock (Mg C ha-1)
1 164.7 8 93.1 15 118.1
2 114.2 9 116.6 16 189.6
3 27.6 10 70.5 17 63.5
4 140.0 11 104.0 18 206.4
5 120.5 12 140.5 19 127.5
6 25.9 13 109.0 20 114.3
models using multi bands combinations increased the coefficient correlation of the model because every band complements to each other.
The vegetation indices (NDVI) derived from red and near infrared bands provide higher correlation with carbon stock than NDVI derived from red and middle infrared bands (Table 3). A possible explanation for this result is that in the infrared region vegetation has higher reflectance than in the middle red region. As expected, PC1 provides the highest correlation with carbon stock in tree biomass compared to PC2 and PC3. This condition is because the data have been compressed and presented in PC1. A multiple combination of PC 1, 2, and 3 does not significantly improve the Pearson correlation (Table 3) because the PC 2 and 3 do not have correlation with the carbon stock in tree biomass.. The highest correlation between PC1 and AGB compared to PC2, PC3 and AGB is also found by Lu . (2004) in Amazonian forest in Brazil.
Regression models having Pearson correlation 0.75 and the model based on PC 1, 2, and 3 were applied to the independent data set for validation.
et al
B. Validation of The Regression Models
Figure 4 shows the measured and the predicted of carbon stock in the tree biomass. The 1 - 1 line is used to examine whether predicted values are higher or lower than the measured carbon stock. Although Pearson correlation of the regression model based on PC1, 2, and 3 is slightly lower than that of the multiple bands combinations using band 3 (Table 3). However, validation using an independent data set suggests that the model based on the PC1, 2, and 3 is more stable. This is shown by the Pearson correlation (r = 0.63) between the measured and the predicted carbon as presented in Figure 4, it means that this model more applicable than the others.
The correlation between the carbon stock and the independent variables (spectral band of SPOT imagery, NDVI, and PC) may be improved by additional sample plots and topographic correction. In a rugged terrain, a topographic correction is needed because a high variation in the reflectance response for similar vegetation condition (Riao ., 2003). However, Tokola
. (2001) observed that a simple non-Lambertian methood could not be applied to normalize topographic effects and significantly improve the accuracy of AGB estimation.
et al et
al
13 Y = 758.24 + 6.27*b1 -16.59*b3 – 0.27*b4 0.76
14 Y = 783.13 + 0.17*b1 + 6.98*b2 -17.90*b3 – 0.23*b4 0.76
15 Y = -39.80 – 594.56*NDVI23 0.64
16 Y = 164.84 + 143.00*NDVI24 0.14
17 Y = 332.73 – 1.89*PC1 0.71
18 Y = 103.51 – 0.09*PC2 0.02
19 Y = 112.36 – 0.15*PC3 0.01
20 Y = 371.29 – 1.97*PC1 – 0.51*PC2 – 2.48*PC3 0.73
Remarks:
Y = Predicted carbon stock in above-ground tree biomass
b1, b2, b3, b4 = retrieval values of b1, b2, b3, and b4 of SPOT imagery NDVI = Normalized Difference Vegetation Index
Figure 4. The measured vs the predicted carbon stock in tree biomass (Mg C/ha) using different independent variables applied to the independent data (10 plots). The independent variables are: b1,3; b2,3; b1,2,3; b2,3,4; b1,2,3,4; PC1,2,3
C. Soil Carbon Stocks
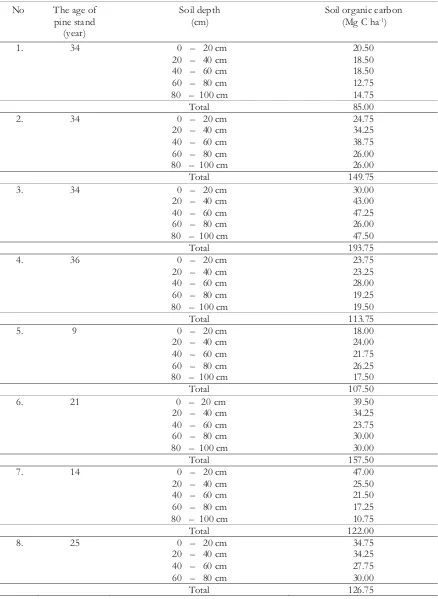
Carbon stocks in the soil under Pine forest vary from one plot to the othe (Table 4). The amount of carbon stocks range from 85 to 194 . This is somewhat lower than SOC found by
rs
Mg C ha-1
Loaiza . (2010) under pine plantation in Brazil. The mean SOC under pine forest at 25 cm depth was 92.6 (Loaiza ., 2010), while in the current study SOC ranges from 18 to
47 .
et al
et al Mg C ha
Mg C ha
-1
60 – 80 cm 26.00
80 – 100 cm 26.00
Total 149.75
3. 34 0 – 20 cm 30.00
20 – 40 cm 43.00
40 – 60 cm 47.25
60 – 80 cm 26.00
80 – 100 cm 47.50
Total 193.75
4. 36 0 – 20 cm 23.75
20 – 40 cm 23.25
40 – 60 cm 28.00
60 – 80 cm 19.25
80 – 100 cm 19.50
Total 113.75
5. 9 0 – 20 cm 18.00
20 – 40 cm 24.00
40 – 60 cm 21.75
60 – 80 cm 26.25
80 – 100 cm 17.50
Total 107.50
6. 21 0 – 20 cm 39.50
20 – 40 cm 34.25
40 – 60 cm 23.75
60 – 80 cm 30.00
80 – 100 cm 30.00
Total 157.50
7. 14 0 – 20 cm 47.00
20 – 40 cm 25.50
40 – 60 cm 21.50
60 – 80 cm 17.25
80 – 100 cm 10.75
Total 122.00
8. 25 0 – 20 cm 34.75
20 – 40 cm 34.25
40 – 60 cm 27.75
60 – 80 cm 30.00
Our study showed that soil organic carbon under old stand (34-36 years old) was not always higher than that of young one. Among the plots, the highest and the lowest soil carbon was found in 34 years pine forest (Table 4), this phenomenon could be caused by differences in biophysical conditions of the plots. Regarding to differences of soil organic carbon from one plot to the other could be caused by differences in soil texture, density of the trees, and topographic condition (Lal, 2005).
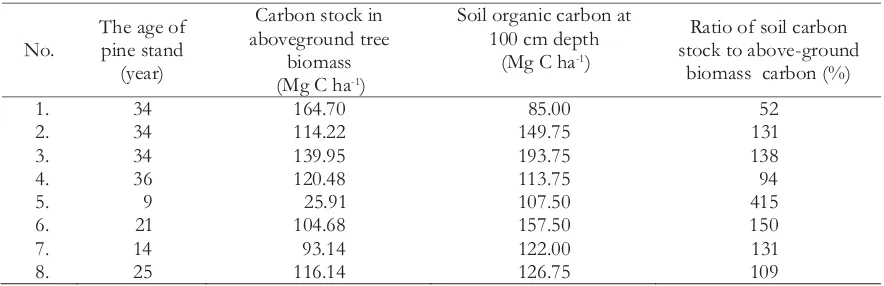
The potential of soil to reduce CO from the atmosphere can be seen by the ratio of carbon stock in tree biomass and in the soil which are more than 100%. This means the SOC higher than organic carbon in tree biomass(Table 5). As comparison, Loaiza . (2010) found that the ratio of SOC at 50 cm depth to carbon stock in tree biomass was 169% in tropical pine forest in Brazil. In addition, Allewell . (2009) stated that soil stores twice as much carbon as the atmosphere. Therefore maintaining soil productivity through conservation practices is essential to store organic carbon in soil since it is considered a slow renewable source (Harrison
., 2011) and stabilizing organic carbon in soil horizons is essential to mitigate human-induced climate change (Lorenz ., 2011).
The study demonstrates the potential of remote sensing method to assess carbon stock of tree biomass. To achieve a higher accuracy of the assessment, more sample plots which represent various ages of the plantation, various amounts of
2
biomass and biophysical conditions are needed. The study also highlights the potential role of forest soil for CO mitigation. At a depth 100 cm, forest soil can store more carbon than that of forest biomass.
The authors would like to thank to our colleague Sudarso, who helped in collecting field data.
Alewell, C., M. Schaub, and F. Conen. 2009. A method to detect soil carbon degradation during soil erosion. 6: 2541-2547.
Austin, J.M., B.G. ,Mackey, and K.P. van Nief. 2003. Estimating forest biomass using satellite radar: An exploratory study in a temperate Australia Eucalyptus forest. t 176: 5755-83. Basuki, T.M., A.K. Skidmore, P.E., van Laake, I.
van Duren, and Y.A. Hussin. 2011. The potential of spectral mixture analysis to improve the estimation accuracy of tropical
forest biomass. 27(4):
329-345.
Foody, G.M., D.S. Boyd, and M.E.J. Cutler. 2003 Predictive relations of tropical forest biomass from Landsat TM data and their transferability between region.
Forest Ecology and Managemen
Geocarto International
Remote Sensing of Environment
.
Table 5. Ratio carbon stock in soil and tree biomass
No. The age ofpine stand (year)
Carbon stock in aboveground tree
biomass (Mg C ha )-1
Soil organic carbon at 100 cm depth
(Mg C ha-1)
Ratio of soil carbon stock to above-ground
biomass carbon (%)
1. 34 164.70 85.00 52
2. 34 114.22 149.75 131
3. 34 139.95 193.75 138
4. 36 120.48 113.75 94
5. 9 25.91 107.50 415
6. 21 104.68 157.50 150
7. 14 93.14 122.00 131
land use, land-use change and forestry (GPG-LULUCF). Edited by Penman, J., M. Gystarsky, , T. Hiraishi, T. Krug, D. Kruger, R. Pipatti, L. Buendia, K. Miwa, T. Ngara, K. Tanabe, and F. Wagner. IPCC National Greenhouse Gas Inventories Program. Lal, R. 2005. Forest soils and carbon
sequestration. 220: 242 - 258.
Lillesand, T.M and R.W. Kiefer. 2004. Remote Sensing and Image Interpretation, John Wiley and Sons. Inc.
Loaiza, U.J.C., T.J.A. Rodriquez, A.M.V. Ramirez, and J.L.T. Alvaro. 2010. Estimation of biomass and carbon stocks in plants, soil, and forest floor in different tropical forests. 260(10): 1906 -1913.
Lorenz, K., R. Lal, and M.J. Shipitalo. 2011. Stabilized soil organic carbon pools in sub soils under forest are potential sinks for atmospheric CO . 57(1): 19 -25.
Forest Ecology and Management
Forest Ecology and Management
Forest Science 2
corrections in Landsat TM data for mapping vegetation types.
41(5): 1056 -1061.
Rosenqvist, Å., A. Milne, R. Lucas, M. Imhoff, and C. Dobson 2003. A review of remote sensing technology in support of the Kyoto
Protocol. 6:
441-455.
Steininger, M.K., 2000. Satellite estimation of tropical secondary forest above-ground biomass data from Brazil and Bolivia.
21(6&7): 1139-1157.
Tangki, H. andChappell 2008. Biomass variation across selectively logged forest within a 225-km region of Borneo and its prediction by Landsat TM.
256: 1960-1970.
Tokola, T., J. Sarkeala, and M. van der Linden, M., 2001. Use of topographic correction in Landsat TM based forest interpretation on Nepal 22 (4): 551 563.
.
.
-IEEE transactions on Geoscience and Remote Sensing
Environmental Science & Policy
Int.J. Remote Sensing
Forest Ecology and Management