Analysis of Factors Influencing the Successful
Abstract: This research purposed to examine the relationship between Information Quality, System Quality, Service Quality, and User Satisfaction based on Updated DeLone and
McLean’s Information System Success Model (2003
). This study also examines the relation-ship between the User Satisfaction and the Successful e-Procurement Implementation espcially in public sector organization. The population of this research is end user that used e-procurement to support their work. This research conducted on 97 respondents which are employees and vendors of government e-procurement system in Procurement Service Unit Daerah Istimewa Yogyakarta Province. Statistic tool that used to test the hypothesis is Struc-tural Equation Model (SEM) with the alternative method Partial Least Square (PLS) using Smart PLS 3.2.3 software. The findings show that system quality, information quality, and service quality are positively significant predictors of user satisfaction. In addition this study also reveals that user satisfaction is positively significant predictor of the successful e-procurement implementation.Keywords:
Information Quality, System Quality, Service Quality, User SatisfactionAbstrak: Penelitian ini bertujuan untuk menguji hubungan antara Kualitas Informasi, Kualitas Sistem, Kualitas Pelayanan, dan Kepuasan Pengguna berdasarkan DeLone dan McLean Sistem Informasi Sukses Model Terbaru (2003). Penelitian ini juga meneliti hubungan antara Kepuasan Pengguna dan Kesuksesan pelaksanaan pengadaan barang dan jasa secara elektronik (e-procurement) terutama di organisasi sektor publik. Populasi dari penelitian ini adalah pengguna akhir dari sistem e-procurement untuk mendukung pekerjaa n mereka. Penelitian ini dilakukan pada 97 responden yang merupakan karyawan dan vendor sistem e-procurement di Unit Layanan Pengadaan Daerah Istimewa Provinsi Yogyakarta. Alat uji statistik yang digunakan untuk menguji hipotesis adalah Structural Equation Model (SEM) dengan metode alternatif Partial Least Square (PLS) menggunakan Smart PLS 3.2.3 software. Penelitian ini menunjukkan bahwa kualitas sistem, kualitas informasi, dan kualitas pelayanan merupakan prediktor positif signifikan dari kepuasan pengguna. Selain itu penelitian ini juga mengungkapkan bahwa kepuasan pengguna adalah prediktor positif signifikan dari kesuksesan pelaksanaan pengadaan barang dan jasa secara elektronik.
1.
Introduction
Facing the global financial crisis becomes a challenge for every country in the world. Every
coun-try starts to improve their financial management strategies in order to be more transparent and
ac-countable. The development of technology provides an opportunity to use the true value of the
inter-net and the business running easier. Each year government tried to increase its quality by improving
financial in various ways, one of them is by using e-Procurement. E-Procurement is defined as the use
of electronic methods to conduct transactions between the authorities and suppliers. The other reasons
of using e-Procurement is transparency, because transparency can reduce corruption in the
govern-ment projects and misuse of public resources in order to reach the government’s goal to be a good
corporate governance and implementing e-governance. Although there are some obstacles in
imple-menting the public procurement system such as existing procurement process, political users
re-sistance to adopt the new system, and changing bidder’s relations. Hence, the proper e-Procurement
management processes can help to overcome these problems (Neupane et al., 2012).
The legal basis of forming the LPSE (Layanan Pengadaan Secara Elektronik) is article 111 no. 54
of 2010 about procurement of government’s goods and services in which the technical provisions of
its operations are managed by the Main Regulation LKPP (Lembaga Kebijakan Pengadaan
Ba-rang/Jasa Pemerintah) No. 2 year 2010 about the electronic procurement. Besides organizing its
ser-vices electronically, LPSE also obliges the fulfillment of the requirements as stated in Law No. 11
year 2008 about Information and Electronic Transactions. The current service available in the
e-procurement system is e-tendering which its technical operations are regulated by the main
regula-tions of LKPP No. 1 year 2011 on Procedures E-Tendering. Additionally, LKPP also provides an
Electronic Catalog (e-Catalog) which is an electronic information system that contains the list, type,
technical specification and the price of certain goods from various suppliers from the governments’
vendors, the online audit process (e-Audit), and purchasing procedures of goods and services through
an electronic catalog (e-Purchasing) (from https://lpse.jogjaprov.go.id/eproc).
Regarding the procurement of goods and services, the amount is increasing each period. As stated
by Head of public relation of Yogyakarta local government, since its open in 2008, the numbers of
in-creasing every year. The percentage of auctions using e-procurement is 73.88 percent greater than non
e-procurement. Currently, e-procurement is already served by 631 LPSE (Layanan Pengadaan Secara
Elektronik) spreading across ministries, agencies, local governments and institutions. Based on the
data from the governments institutions of procurement, electronic procurement service utilization
con-tinues to grow from 33 packages with a worth of Rp 52 billion in the beginning of year 2008 to
128.797 packages with a worth of Rp 284 trillion in 2015 (from
http://jogja.antaranews.com/berita/335758/lpse-yogyakarta-terima-penghargaan-national-procurement-award).
The research about the e-Procurement has become a trend in many countries including in
Indone-sia. One of the previous research about the implementation of e-Procurement in Indonesia was done
by Hidayat (2014), this research was conducted on the implementation process of e-procurement with
an emphasis on the accountability and efficiency issues. In other countries, the research regarding the
role of e-procurement that research about the efficiency, accountability, and transparency was
con-ducted by Chimwani et al. (2014), Ateto et al. (2013), Dza, Fisher, & Gapp 2013), Kangogo &
Gakure (2013), Kiprono (2013), Mahmood (2013), Mose et al. (2013), Uba et al. (2013), Neupane et
al. (2012), Rahim & Saber (2011).
The previous research showed that there is a significant relationship between e-Procurement and
performance of the organization Uba et al. (2013). Some other research argued that efficiency was one
of the factors influencing the e-procurement implementation (Chimwani et al., 2014; Neupane et al.,
2012; and Mahmood, 2013). The challenges also give a significant impact through the implementation
of e-procurement (Kiprono, 2013; Hidayat, 2014; Rahim & Saber, 2011) such as employee
competen-cy, inadequate legal framework, inadequate technological infrastructure and security of procurement
transaction data (Kiprono, 2013).
The other factors from the previous study as stated to give a significant impact on e-procurement
are strategic value of e-procurement factor (Ateto et al., 2013), e-procurement capability (Kiprono,
2013 and Ateto et al., 2013), e-procurement models, public trust (Ateto et al., 2013), implementation
and recommended measures (Ahmed, 2013), effectiveness (Neupane et al., 2012), User acceptance of
2013 and Kiprono, 2013), management support, organizational factors, technical factors, and
envi-ronmental factors (Kangogo & Gakure, 2013), staff qualification (Ateto et al., 2013 and Chimwani et
al., 2012), and performances (Uba et al., 2013). A study by Wanniarachchige (2014), analyzed that
system quality, user quality and service quality had an impact on the e-procurement implementation in
public sector in Sri Lanka. As the previous studies conducted by Mose et al. (2013) stated that users
and buyers did not give significant impact towards the e-Procurement. The study modified the
dimen-sions of the TAM and DeLone & McLean Information System Success Models in which users
in-volvement give a significant impact on the success of information system (Zaied, 2012). These
re-searches proved that there is an inconsistency between outside parties and e-procurement system
whether there is a significant or insignificant influence.
The research of Zaied (2012) conducted on the improvement of information system through
en-hancing information quality, perceived usefulness, service quality and perceived ease of use will
fos-ter the involvement of the users and users satisfaction. The result of the research was supported the
information from DeLone & McLean (2003) which stated the significant result of the relation
be-tween the use and User satisfaction. Mose et al. (2013) conducted a research about the successful of
information system having a positive significant impact on the successful e-procurement
implementa-tion. These research supported the information system success model of DeLone & McLean (2003) in
the relation between information quality and system quality towards users satisfaction.
The research of Khristianto et al. (2012) showed that the system quality had an insignificant effect
toward customer satisfaction. The system quality which is an important part in information system has
no effect to the customer satisfaction. The research of McGill, Hobbs, & Klobas, (2003) found that
system quality had a significant positive influence on users satisfaction. These two research indicated
difference result about the influence of system quality towards User satisfaction.
The previous research by Mahmud, Jusoff, & Hadijah (2013) concluded that there is a positive
re-lationship between service quality and User satisfaction but have no significant effect. This is because
users are judging what they expected from the quality of service which is not accordance of what they
ser-vice quality to the users satisfaction. The serser-vice quality also plays an important role in satisfying the
users.
2. Theoretical Framework and Hypothesis Development
2.1. Agency Theory
The agency theory tried to explain the contract relation between one or more parties (principal)
who work for another party (agent) who performs the work (Eisenhardt, 1989). There are some
prob-lems that may happen in that kind of relation, the wants and goals from the principal and agent can be
different. This situation become more difficult when the management can not verify what actually
happened. In this situation the agency theory is the most relevant theory when contracting problems
are difficult. If both parties’ relationship are utility maximizes, there is a good reason to believe that
the agent will not always act in the best interests of the principal. The principal can limit divergences
from his interest by establishing appropriate incentives for the agent and by incurring monitoring
costs designed to limit the aberrant activities of the agent (Jensen & Meckling, 1976). The overall
conclusion is that the agency theory is a useful addition to the organizational theory.
The agency theory ideas on risk, outcome uncertainty, incentives, and information systems are novel contributions to organizational thinking, and the empirical evidence is supportive of the theory, particularly when coupled with complementary theoretical perspectives (Moe, 2008).
Agency theory can be applied between employer to employee and buyer to supplier relationships.
Procurement involves several parties with different competing goals. Internal stakeholders, such as
department exist with conflicting goals can contribute to the complexity of the procurement
perfor-mance.
2.2. Electronic Procurement
The use of electronic methods to conduct transactions between the authorities and suppliers is
the definition of procurement. The process of e-Procurement covers every stage of purchasing, from
the initial identification of a requirement, through the tendering process, to the payment and
potential-ly the contract management. In e-procurement, the whole process is on electronic basis. As stated by
Neupane et al. (2012), the main reason of the e-Procurement system is to provide the government to
be more open, available and accessible on the procurement information to the public that increases the
Ateto et al. (2013) in Baily (2008) classified e-procurement into seven categories: (1) Web-based
ERP (Enterprise Resource Planning), (2) MRO (Maintenance, Repair and Operations), (3)
E-sourcing, (4) E-tendering, (5) E-reverse auctioning, (6) E-informing which involves gathering and
distributing purchasing information both from and to internal and external parties using Internet
tech-nology, and (7) E-market sites.
E-Procurement has many advantages in the implementation. Firstly, the e-procurement directly
can reduce the cost of paper, postage, and so on. Second, e-Procurement does not only reduce the cost
of materials, but also reduce the time wasted to paper invoicing in terms of writing, filling and time
taken to move from one country to another country.
Since the most of activities in e-procurement has been done electronically, it can reduce the cost of staff in procurement process. Suppliers can be monitored on timely delivery, quality delivery of products and services hence performing suppliers can be contacted in the future (Ateto et al., 2013).
The other benefit of e-Procurement is the improvement in terms of communication because by
electronic way, communication becomes so easy that the response of the suppliers to authorities can
be fast.
2.3. E-Procurement in Public Sector in Indonesia
Internet has influenced organizations’ intention not only in private sector organization but also
public sector organization like the implementation of e-Procurement. The e-Procurement was become
a trend in many countries in the recent decade in order to implement the concept of e-governance.
In-deed in Indonesia, the concept of procurement already stated in the Presidential Decree No. 80 year
2003. However, the implementation of e-Procurement only works in several public sector entities.
Although there is no specific law that forces the local government to apply e-procurement system as a
mechanism, the local governments already make local regulations to support their activity.
As stated in a research by Tertiana (2014), the local regulations refers to the tender process that is
available in the Presidential Decree no 80 year 2003 regarding the Guidelines of Government
Pro-curement. Electronic procurement recommendation was started in 2004 by a Presidential Decree no 5,
regarding the Acceleration of Corruption Eradication (mandated review & testing of e-procurement).
Further, Presidential Decree no 8, 2006, the 4th amendments of Presidential Decree no 80, 2003
the government published the Cyber Law no 11 in the year 2008 regarding Information and Electronic
Transactions, which treats electronic documents the same as paper documents from a legal
perspec-tive. Here the e-procurement takes an important part because public sector entities face some
chal-lenges in terms of serving the customers and also in internal areas such as its procedure. One of the
government efforts in order to be more transparent is by building an institution engaging in
procure-ment as can be seen in Institutions of Governprocure-ment Procureprocure-ment Policy (http://www.lkpp.go.id/).
2.4. Delone & McLean Model
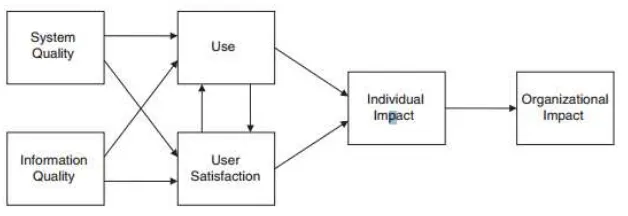
The previous research by DeLone & McLean (1992) defined that information success can be
de-fined with six dimensions which are system quality, information quality, use, user satisfaction,
indi-vidual impact, and organizational impact. This model is the most comprehensive and fit to be
imple-mented in this research.
Figure 1. DeLone & McLean Model (1992)
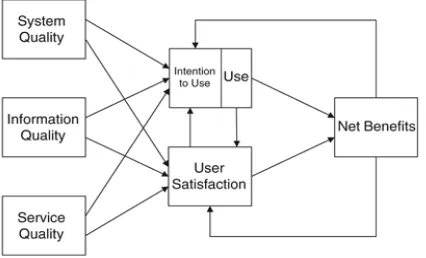
As the time goes by, DeLone & McLean (2003) revised their information system model by adding
some variables stated in their new research, which are information quality, system quality, service
quality, intention to use, user satisfaction, and net benefits. By identifying the dimensions as an
indi-cator of information system success, DeLone & McLean (2003) found that those variables are related
to success in information system. In the new DeLone & McLean model, information quality measures
the intention to use, systems quality measures technical success, and use &, User satisfaction,
Figure 2. New DeLone & McLean Model (2003)
To measure the success in information system DeLone & McLean found that it is influenced by
the information quality, the system quality itself, the intention to use of information quality, system
quality, service quality, and the user satisfaction. Many researchers implemented this model because
DeLone & McLean model is fit with many researchers conducted on information system.
2.5. Research Model
In addition some studies tried to validate models or measurements. However, most of these
stud-ies mentioned that information quality, system quality, and service quality have significant effect on
user satisfaction and user satisfaction on successful of e-procurement, but some researches mentioned
there is no significant effect. This research purposes a model:
Figure 3. Research Model
2.6. Information Quality and User Satisfaction
In the DeLone & McLean IS Success Model, information quality measures semantic success.
In-formation quality was measured in terms of accuracy, timeliness, completeness, relevance, and
con-sistency. Individual impact was measured in terms decision-making performance, job effectiveness,
and quality of work DeLone & McLean (2003). The research of Khristianto et al. (2012) based on
In-formation quality may reflect the User satisfaction because users will only get what they wanted by
the information, so that the information quality here takes important roles to measure the user
satisfac-tion. Based on the finding of the study conducted by Ajoye (2014), the influence of information
quali-ty on user satisfaction was strong, because the customers were positively affirming that most of their
needs of information were handled adequately. As mentioned by Abugabah, Sanzogni, & Poropat,
(2009), they indicated that information quality affects User performance in these organizations
posi-tively. In the other side, a research by Marble (2003) stated that there is no findings about significant
relationship between information quality and user satisfaction in his study.
In addition some studies tried to validate models or measurements. However, most of these
stud-ies mentioned that information quality have significant effect on user performance. Since it gives a
significant effect, information quality variable is one important variable that needs to be considered in
order to fulfill user satisfaction. Based on the explanation, this research purposes to test the
hypothe-sis:
H1. Information quality has a positive influence to the user satisfaction.
2.7. System Quality and User Satisfaction
A new concept of procurement will also give new challenges to the people who work behind it.
System quality becomes a crucial part in order to reach the success of e-procurement implementation.
DeLone & McLean (2003) give an example in their research that the higher system quality will lead
to the higher User satisfaction and use, leading to positive impacts on individual productivity,
result-ing in organizational productivity improvement. System quality is a part of internal control that can
determine the responses from external parties. Users will give a positive contribution if the system
have a good quality on serving data and manage its internal control. Different from the research
above, based on the finding by Khristianto et al. (2012), system quality is not an important variable
for creating customer satisfaction. Ajoye (2014) found that the influence of system quality on user
satisfaction is very strong. Thus the system needs a critical analysis and proper adjustment to further
enhance users experience and satisfaction. In the research conducted by Yang (2007), the results of
the tests of the overall online satisfaction model showed that system quality have significant effects on
that system quality is a significant factor influencing User satisfaction in using an e-learning system.
The research by Zaied (2012) proved that there is a positive influence between system quality and
user satisfaction which is proved by the increase of system quality will also improves user
satisfac-tion. The explanation leads to the research purpose the hypothesis:
H2. System quality has a positive influence to the user satisfaction
2.8. Service Quality and User Satisfaction
Having employees with good skills will automatically drive the organization to give a good
ser-vice which will affect the successful of e-procurement implementation. Several studies have examined
the relationship between service quality and User satisfaction. As DeLone & McLean (2003) stated in
their research that the service quality is important, it is more likely greater than previously because the
users are customers and poor users support will translate into lost customers and lost sales. In the
re-search conducted by Manchanda (2014), it is stated that there is a direct positive relationship between
service quality and user satisfaction. These findings are supported by Nwone (2014) who stated that
service quality is positively and significantly related to User satisfaction. Khristianto et al. (2012), in
his research, showed that service quality has positive and significant effects toward customer
satisfac-tion. The research by Yang (2007) also indicated that service quality have significant effects on
cus-tomers satisfaction, the difference is only on the service quality that does not have direct effects on
customers loyalty. The research by Agbor (2011) showed that there are two results in the relation
be-tween service quality and customer satisfaction, ICA Centrum and Forex Bank have a significant
rela-tionship between service quality and customer satisfaction, but Umeå University had no significant
relationship between service quality and customer satisfaction. Based on the explanation, this research
hypothesis is:
H3. Service quality has a positive influence to the user satisfaction.
2.9. Users Satisfaction and Successful e-Procurement Implementation
The success of e-procurement implementation can be measured by the User satisfaction. It can be
seen that if the users are satisfied they will repeat the purchases and also repeat to visit the website.
The finding by Vaidya, Sajeev, & Callender (2006) stated that some measures for the success of an
c-tion. The study conducted by Mose et al. (2013) stated that the acceptance of e-procurement systems
among the users will lead to the success of the system since those involved will have a positive
atti-tude in learning on how to use the system so that this will make it easier to incorporate most of the
operations into the system. Increasing User satisfaction theoretically will also increase the possibility
of the success of e-procurement. Based on the explanation, this research hypothesis is:
H4. User Satisfaction has a positive influence to the successful e-Procurement implementation
3. Research Method
The research conducted in a quantitative study which focuses on factors that may have influences
on the customers’ satisfaction and the success of e-procurement implementation. By using primary
data, this research focuses on collecting the data by questionnaires which contains indicators of each
variable. The research used the probability method to choose the sample which is proportionate
strati-fied random sampling.. The samples of this research were the employees in Yogyakarta Government
that use e-procurement system to support their business.
This research collected the data using a direct method by surveys consisting of questions and
re-sponses. The questionnaire contains a few statements that were already provided. Each item on the
questionnaire was reviewed for its content, scope, and purpose. To measure the responses of the
re-spondents, this research used an interval scale from 1 until 5 for each question from a very disagree
until very agree scales. From the scale, the researcher knew the perception from the respondents’
point of view. If the respondents chose the low scale (i.e. 1 or 2), it means that the responses of the
questions would be low and vice versa.
3.1. Information Quality
The information quality based on the perception of users applied in this research. In this research,
researcher takes the e-Procurement website as the object. The indicators as stated in Table 1.
Table 1. Indicators to Measure Information Quality
Statement Reference
Provides required information on time (timeliness) (Alkhalaf et al., 2013) Provides information that is suitably concise
Table 1. Indicators to Measure Information Quality (Continue)
Statement Reference
Provides information that appears readable, real, and well formatted (user interface)
(Alkhalaf et al., 2013)
Provides sufficient information for your purposes (Quantity of in-formation)
Provides information that you need at the right time
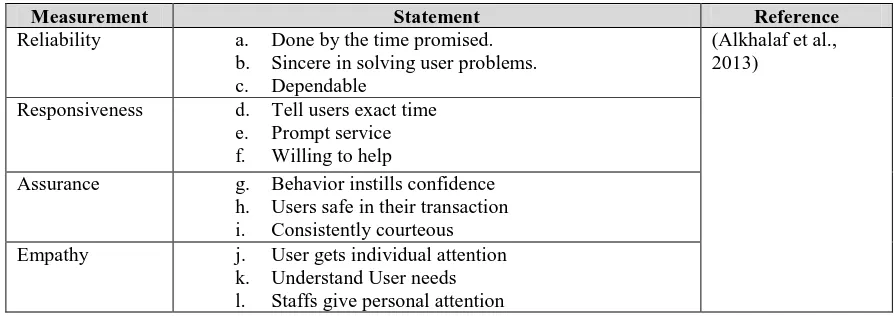
3.2. System Quality
System quality is used to measure the information processing system itself with its focus on
sys-tem integration, flexibility, reliability, and response time (DeLone & McLean, 2003). The indicators
of system quality here as adapted in research conduct by Alkhalaf et al. (2013). As the perception of
users on how the system satisfied what User needs.
Table 2. Indicators to Measure System Quality
Measurement Statement Reference
Reliability a. Done by the time promised.
b. Sincere in solving user problems. c. Dependable
(Alkhalaf et al., 2013)
Responsiveness d. Tell users exact time e. Prompt service f. Willing to help
Assurance g. Behavior instills confidence
h. Users safe in their transaction i. Consistently courteous
Empathy j. User gets individual attention
k. Understand User needs l. Staffs give personal attention
3.3. Service Quality
Service quality is a measure of how well the service level delivered match with customer
expecta-tions. By conduct on the research by DeLone & McLean (2003), the researcher adopt the
question-naire which contains tangible, reliability, responsiveness, assurance, and empathy from the parties that
provide the e-Procurement system. The indicators as follows:
Table 3. Indicators to Measure the Service Quality
Statement Reference
Information system has up-to-date hardware and software (tangible) (DeLone & McLean, 2003) Information system is dependable (reliability)
Information system employees give prompt service to users (responsiveness)
Information system employees have the knowledge to do their job well (assur-ance)
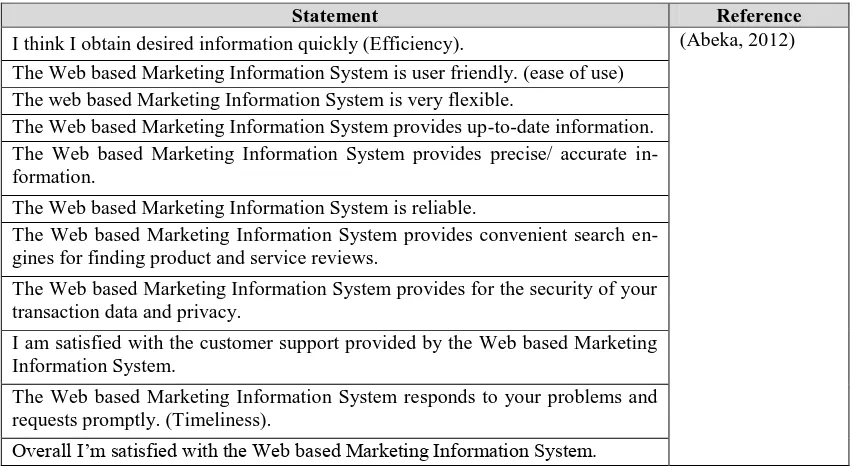
3.4. User Satisfaction
User satisfaction is generally regarded as one of the most important measures of Information
Sys-tems success (Abeka, 2012). By user satisfaction we can know how the impact of using
e-Procurement. The questionnaire to measure user satisfaction are conducted from research by Abeka
(2012). The indicators as follows:
Table 4. Indicators to Measure User Satisfaction
Statement Reference
I think I obtain desired information quickly (Efficiency). (Abeka, 2012)
The Web based Marketing Information System is user friendly. (ease of use) The web based Marketing Information System is very flexible.
The Web based Marketing Information System provides up-to-date information. The Web based Marketing Information System provides precise/ accurate in-formation.
The Web based Marketing Information System is reliable.
The Web based Marketing Information System provides convenient search en-gines for finding product and service reviews.
The Web based Marketing Information System provides for the security of your transaction data and privacy.
I am satisfied with the customer support provided by the Web based Marketing Information System.
The Web based Marketing Information System responds to your problems and requests promptly. (Timeliness).
Overall I’m satisfied with the Web based Marketing Information System.
3.5. Successful e-Procurement Implementation
The aim of successful e-procurement implementation in this research is to measure how far the
government applies the e-procurement system in order to reach its goals. Questionnaire to measure the
successful e-procurement implementation is adopted from the research by Gardenal, Andrea, &
Manzo (2013). The indicators as follows:
Table 5. Indicators to Measure Successful e-Procurement Implementation
Statements Reference
Reduction of the effort and time required
Gardenal, Andrea, & Manzo (2013) Reduction of prices and paid disputes
Reduce paper usage; reduce achieving cost
Quality and availability of information; non-discriminatory technical evaluation
3.6. Analysis Technique
This research conducted structural equation model (SEM) and using SMARTPLS because this
re-search included in SEM based variance. On the basis of calculations and modeling, it can be
per-ceived that PLS-SEM path modeling using SMARTPLS is appropriate to carry on the confirmatory
factor analysis which is more reliable and valid (Afthanorhan, 2013). Its application is aimed to
max-imize the explained variance of the dependent variables and minmax-imize the unexplained variances.
The formula that reflects the hypothesis testing to test the effect of independent variables which
are information quality, system quality, and service quality, and users satisfaction) towards dependent
variable (successful of e-Procurement implementation) is:
US = α1+ β1SysQ+ β2InfQ + β3ServQ + e1
SEI = α2+ β4US + e2
α = Alpha/Constanta
β1-4 = Regression Coefisien
US = User Satisfaction
SysQ = System Quality
InfQ = Information Quality
ServQ = Service Quality
SEI = successful e-Procurement implementation
e = Disturbance Error
The measurement of reliability can be conduct by Cronbach’s Alpha if the amount showed 0.60
indicates the measurement model is reliable. The Cronbach’s Alpha between 0.80 until 1.00
catego-rized as good reliability, Cronbach’s Alpha between 0.60 until 0.79 categocatego-rized as accepted reliability,
Cronbach’s Alpha less than 0.60 categorized as lack of reliability (Sekaran, 2006). The research
measurement models validity assessment focuses on convergent and discriminant validity. For
vergent validity, researcher needs to examine the average variance extracted (AVE). In order to
con-duct on convergent validity, researchers needs to examine the average variance extracted (AVE) with
4.
Results
The results of analysis factors influence the successful e-procurement implementation in
Yogya-karta’s governments. A total of 125 questionnaires were distributed for this research. The respondents
are employees that used e-procurement to support their activity in Procurement Service Unit (ULP)
Daerah Istimewa Yogyakarta Province, ULP Yogyakarta City, ULP District Sleman, ULP District
Gunungkidul, ULP District Kulon Progo, and ULP District Bantul and vendors from all ULPs. A total
of 97 questionnaires were returned for a response rate of 77% and the details are explained in Table 6.
Table 6. Returned Questionnaires
InfQ5, InfQ6, InfQ7. The results of Information Quality stated in table 7.
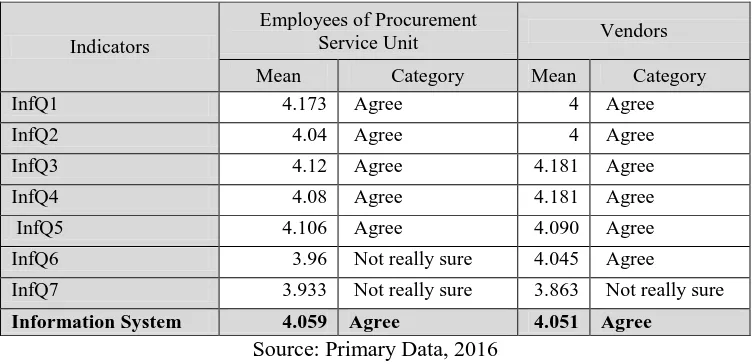
Table 7. Respondent’s Assessment on Information Quality
Indicators
Employees of Procurement
Service Unit Vendors
Mean Category Mean Category
InfQ1 4.173 Agree 4 Agree
Information System 4.059 Agree 4.051 Agree
Source: Primary Data, 2016
Based on the result on table 7, Based on the result on the table 4.6 from the vendors and
that e-procurement already serve the information on time, clear, easy to understand, up to date, and
actual. Indicators Inf6 and Inf7 have low assessment because employees did not get what they need in
the right time. But, vendors agree that e-procurement system served the information in the right time.
4.2. System Quality
System Quality has 5 indicators with construct variables are SysQ1, SysQ2, SysQ3, SysQ4,
SysQ5. Respondent’s assessment on System Quality is stated in table 8.
Table 8. Respondent’s Assessment on System Quality
Indicators
Employees of Procurement
Service Unit Vendors
Mean Category Mean Category
SysQ1 4.053 Agree 4.002 Agree
procurement finish the work as what they stated, fast service and really help the employees to support
their work, but not really sure that the employees are safe when conducted the transaction. Overall,
with the mean of 3.958, vendors are not really sure with the system quality of e-procurement system.
4.3. Service Quality
Service Quality has 5 indicators with construct variables are ServQ1, ServQ2, ServQ3, ServQ4,
ServQ5. The result for Service Quality is stated in table 9.
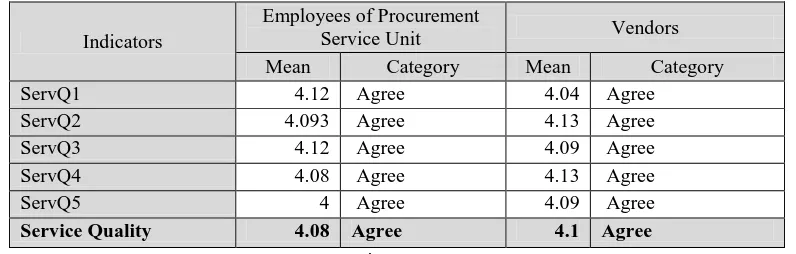
Table 9. Respondent’s Assessment on Service Quality
Indicators
Employees of Procurement
Service Unit Vendors
Mean Category Mean Category
Based on the table 9, from the vendors and employees perspective, both are agree with the
state-ment on the indicators of service quality variables that e-procurestate-ment already renew the contents in
the system, served the information fast and exactly to the vendors and employees, the system is
trust-ed, and the information in e-procurement system can attract both vendors and employees.
4.4. User Satisfaction
User Satisfaction has 3 indicators with construct variables are US1, US2, and US3. Respondents’
assessment on user satisfaction is stated in table 10.
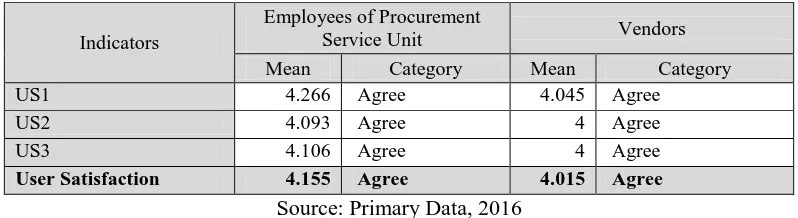
Table 10. Respondent’s Assessment on User Satisfaction
Indicators
Employees of Procurement
Service Unit Vendors
Mean Category Mean Category
US1 4.266 Agree 4.045 Agree
statement on the indicators of user satisfaction variables that they are comfort to use e-procurement
system to support their work, satisfied with the interaction, and overall both employees of
Procure-ment Service Unit and vendors are satisfied enough to use the e-procureProcure-ment system.
4.5. Successful e-Procurement Implementation
Successful e-Procurement Implementation has 5 indicators with construct variables are SEI1,
SEI2, SEI3, SEI4, and SEI5. Respondent’s assessment on Successful e-Procurement Implementation
is stated in table 11.
Table 11. Respondent’s Assessment on Successful e-Procurement Implementation
Indicators
Employees of Procurement
Service Unit Vendors
Mean Category Mean Category
SEI1 4.36 Agree 4 Agree
SEI2 4.08 Agree 3.409 Not really sure
SEI3 4.106 Agree 3.909 Not really sure
SEI4 4.293 Agree 4 Agree
SEI5 4.13 Agree 3.954 Not really sure
Successful e-Procurement Implementation 4.194 Agree 3.8545 Not really sure
Based on the result on table 11, from the employees and vendors perspective, the e-procurement
system can reduce the time used and the quality of available information in e-procurement system can
support their work. The employees also agree that e-procurement can reduce the cost and conflict
be-tween parties that involved in transactions, reduce the use of paper, and increase the suppliers’ parti
c-ipation, but in vendors’ perspective, they are not really sure about the indicators.
4.6. Reliability Test
In order to measure consistent reliability, this research used Cronbach’s alpha as measurement in
Partial Least Square – Structural Equation Model (PLS-SEM). As stated in the research by Hair et al.
(2012), the measurement is suggested to use composite reliability, so this research used two
meas-urements in reliability test which are using Cronbach’s Alpha and Composite Reliability. As the
indi-cator, an accepted level of reliability test should be higher than 0.70 for composite reliability and 0.70
or higher for Cronbach’s alpha.
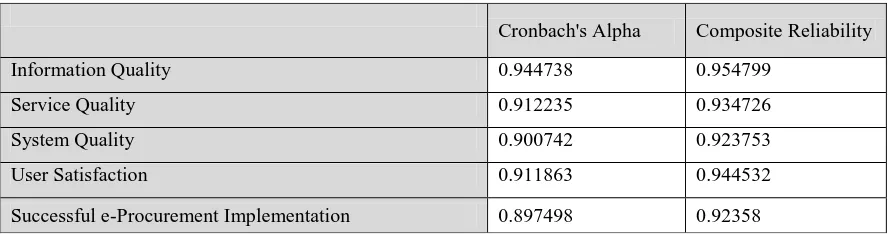
Table 12. Composite Reliability Result
Source: Analysis Data using SmartPLS 3.2.3, 2016
As stated in the table 12, this research showed that all components in Information Quality,
Ser-vice Quality, System Quality, User Satisfaction, and Successful e-Procurement Implementation are
having good reliability because based on Cronbach’s alpha result higher than 0.70 and composite
reli-ability result are higher than 0.71.
4.7. Validity Test
In order to find the validity of each question in the questionnaire, the researcher applied a validity
test. This research focuses on the research measurement models which are convergent validity and
discriminant validity. According to Hair et al. (2012), in order to find convergent validity, the average
variance extracted (AVE) should be examined first with the level of acceptance of 0.50 and higher
Cronbach's Alpha Composite Reliability
Information Quality 0.944738 0.954799
Service Quality 0.912235 0.934726
System Quality 0.900742 0.923753
User Satisfaction 0.911863 0.944532
than 0.71 considered as very good. Based on the table 4.7, the value of square root AVE in each
vari-able is more than 0.71. It is proven that the level of validity in each varivari-able is accepted.
Table 13. Average Variance Extracted (AVE) and Square Root AVE
AVE Square Root AVE
Information Quality 0.751236 0.866739
Service Quality 0.741771 0.861261
System Quality 0.66956 0.818266
User Satisfaction 0.850249 0.922089
Succesful of e-Procurement Implementation 0.707679 0.841237
Source: Analysis Data using SmartPLS 3.2.3, 2016
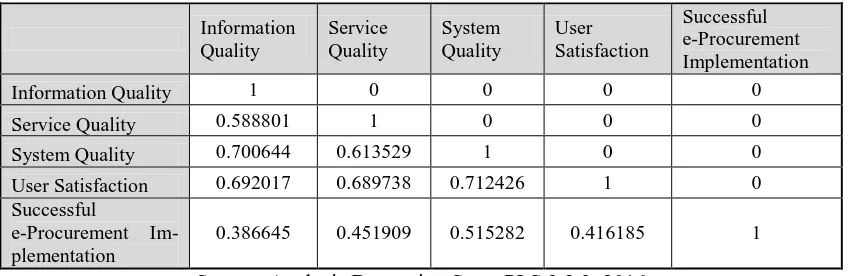
As stated in Fornell and Lacker (1981), the square root AVE in each latent variable can be used to
establish discriminant validity. This is accepted in a condition when the value of square root AVE is
larger than other correlation values among the latent variables as can be seen in table 14.
Table 14. Correlation Values of Latent Variable
Information
User Satisfaction 0.692017 0.689738 0.712426 1 0
Successful
e-Procurement Im-plementation
0.386645 0.451909 0.515282 0.416185 1
Source: Analysis Data using SmartPLS 3.2.3, 2016
As the result in table 13, the results on square root AVE of Information Quality which is 0.866739
is higher than the correlation value of Information Quality and User Satisfaction. For the result on
square root AVE of Service Quality is 0.861261 which is higher than the correlation between Service
Quality with User Satisfaction. The result on square root AVE of System Quality is 0.818266 which is
higher than the result of the correlation between System Quality and User Satisfaction (0.712426),
while the result on square root AVE of User Satisfaction is 0.922089 which is higher than the result of
correlation of User Satisfaction and the Successful e-Procurement Implementation. The conclusion is
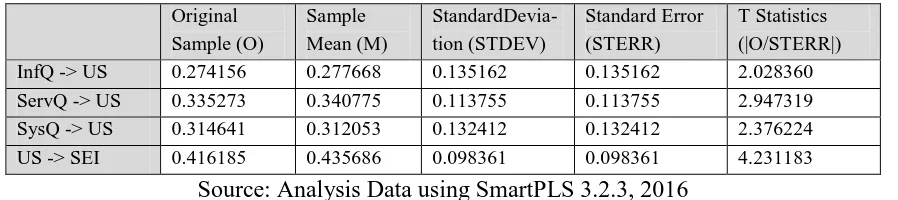
4.8. Hypotheses Testing
Hypothesis testing conduct using software smartPLS based on the result of inner weights. If the
result is positive meaning that there is a positive influence between the variables, and if the result is
negative meaning that there is a negative influence between those variables. In order to test the
signif-icant influence of the variables, the researcher compared the T statistics with T table. As stated in a
research by Nahar and Widiastuti (2011), the result on T table can be used by the equation below:
N= Total Respondent
K= Total Variable
As the calculation, the result of T table is 1.97, the total respondents of 97 is deducted by total
variable of 5. Then, for the research with an alpha is 5% in the column 92, the researcher found the
result of 1.664. If the result of T statistics is higher than the result of T table, it is proved that there is a
significant influence between variables.
InfQ -> US 0.274156 0.277668 0.135162 0.135162 2.028360
ServQ -> US 0.335273 0.340775 0.113755 0.113755 2.947319
SysQ -> US 0.314641 0.312053 0.132412 0.132412 2.376224
US -> SEI 0.416185 0.435686 0.098361 0.098361 4.231183
Source: Analysis Data using SmartPLS 3.2.3, 2016
Hypothesis 1 (H1): Information Quality has a positive influence to the User Satisfaction
Based on the result of hypothesis testing, information quality is proved has positive influence to
the user satisfaction. The result on original sample is positive in 0.274156 and the result on T statistic
showed 2.028360 for the relation of information quality with user satisfaction and this is proved that
those variables are significant because the result on T statistic is higher than the result on T table
(1.664). From the result of the analysis above, it can be conclude that H1 is accepted.
The result of this research supported the research conduct by Ajoye (2014), Abugabah, Sanzogni,
& Poropat, (2009) and Khristianto et al. (2012). Based on their study, it is concluded that information
quality provided has direct, positive and significant effects to the user satisfaction. The higher
e-Procurement Department should develop e-procurement to serve information with the criteria of
time-liness or provide required information on time, understandability, currency or provides up-to-date
in-formation, quantity of inin-formation, and user interface.
Hypothesis 2 (H2): System Quality has a positive influence to the User Satisfaction
Based on the result of hypothesis testing, system quality is proved to have a positive influence to
the user satisfaction. The result on the original sample is positive in 0.314641, and the result on T
sta-tistics showed 2.376224 for the relation between system quality and user satisfaction. Therefore, this
is proved that those variables are significant because the result of T statistics is higher than the result
on T table (1.664). From the result of the analysis above, it can be concluded that H2 is accepted.
The result of hypothesis 2 is in accordance with the research conducted by Zaied (2012) and Yang
(2007). Their research stated that there is a positive influence between system quality and user
satis-faction proved by the increase in system quality that will also improves the user satissatis-faction. Based on
the result of hypothesis 2, e-procurement department as a government organization should develop the
information system which is reliable, responsive, and accurate for example the safety in users’ tran
s-action, empathy, and each party involved in the e-procurement get personal attention.
Hypothesis 3 (H3): Service Quality has a positive influence to the User Satisfaction
Based on the result of hypothesis testing, service quality is proved has a positive influence to the
user satisfaction. The result on original sample is positive in 0.314641 and the result on T statistic
showed 2.947319 for the relation of service quality with user satisfaction and this is proved that those
variables are significant because the result on T statistic is higher than the result on T table (1.664).
From the result of the analysis above, it can be conclude that H3 is accepted.
The result in this research support the research conducted by Manchanda (2014) which stated that
there is direct positive relationship between service quality and user satisfaction. The finding in
hy-pothesis 3 is also supported by Nwone (2014) who stated that service quality is positively and
signifi-cantly related to user satisfaction. As a government organization, e-Procurement Department as a
con-troller of the e-procurement system in public sector organization in Indonesia have to give high
atten-tion to the service quality to the end users of e-procurement in order to increase the organizaatten-tion
Hypothesis 4 (H4): User Satisfaction has a positive influence to the Successful e-Procurement
Implementation
Based on the result of hypothesis testing, User satisfaction is proved has a positive influence to
the successful of e-procurement implementation. The result on original sample is positive in 0.416185
and the result on T statistic showed 4.231183 for the relation of service quality with user satisfaction
and this is proved that those variables are significant because the result on T statistic is higher than the
result on T table (1.664). From the result of the analysis above, it can be conclude that H4 is accepted.
The result in this research support the study conducted by Mose et al. (2013) which stated that the
acceptance of e-procurement systems among the users will lead to the success of the system. The
con-dition when the end users satisfied with the procurement and already feel the benefit of using
e-procurement such as e-e-procurement make their work easier and so on. This research showed the
fac-tors that organization should concern in the successful of e-procurement implementation. Researcher
concludes the result of hypothesis testing in table 15.
Table 15. Result of Hypothesis Testing
Hypothesis Status
Hypothesis 1 (H1): Information Quality has a positive influence to the User Satisfaction Accepted
Hypothesis 2 (H2): System Quality has a positive influence to the User Satisfaction Accepted
Hypothesis 3 (H3): Service Quality has a positive influence to the User Satisfaction Accepted
Hypothesis 4 (H4): User Satisfaction has a positive influence to the Successful
e-Procurement Implementation Accepted
Source: Analysis Data using Smart-PLS 3.2.3, 2016
5.
Conclusion, Implications and Limitations
This research has attempted to explore the relation between user satisfaction and successful
e-procurement implementation in Yogyakarta Governments. It is found that from the four hypotheses
formulation, all hypotheses are accepted because the result shows a positive significant influence.
Based on the data analysis, it is revealed that Information Quality has a positive influence and
signifi-cant effect towards User Satisfaction. The research proved that the improvement on Information
Qual-ity is significantly influence the user satisfaction of e-procurement system. The better information that
influence towards User Satisfaction. The result proves that if the system quality of the government
e-procurement is running well, it will increase the user satisfaction of e-e-procurement.
The result of this study also reveals that Service Quality has a positive influence with User
Satis-faction. Therefore, if the service quality of government e-procurement is implemented properly, it will
cause the User Satisfaction increase. Lastly, the result shows that user satisfaction of government
e-procurement has a positive influence towards the succesfull of e-e-procurement implementation. This
research proved that the higher the level of user satisfaction on governmnet e-procurement, the more
succesful of e-procurement implementation.Based on the result above, all of the hypotheses are
accepted and it is proved that government e-procurement website (LPSE) is already implemented as
its goals to make the transaction on government sector and public sector more transparent which then
leads to the improvement of government accountability compare to the old system of procurement.
This research is intended to develop a better understanding of the parties of public e-procurement
to improve its productivity and make an assessment of factors affecting the success of e-procurement
implementation. By the results of this research, the local governments are able to identify the factors
that relate to the user satisfaction that can contribute to the successful e-procurement in order to
achieve transparency, accountability, and decrease the number of corruption and nepotism. In the
other hand, this research can be useful to support the development of knowledge in accounting system
field also can support the decision making in an organization that conduct on e-procurement system.
This research can give chances to another researchers in the future research.
Based on the research, the total respondents are 97 respondents, 75 respondents are some of
procurement service unit employees in Yogyakarta Government, this number is not cover all
employees because a few employees were having a comparative study in outside Yogyakarta
province. This research is not separate the statistical data analysis between vendors and government
employees. Based on the limitations above, this research provides chances to future researches to
analyze the succesfull e-procurement implemenattion other than the variables used in this research.
For the recommendations, the future research can use more respondents from procurement service
units in governmental sector or other sector that used e-procurement service. The future research can
Reference
Abeka, S. O. (2012). User Satisfaction and Acceptance of Web Based Marketing Information System among Microfinance Institutions in Nairobi Region, Kenya. International Journal of Academic Research in Business and Social Science, 2(9), 368–383.
Abugabah, A., Sanzogni, L., & Poropat, A. (2009). The Impact of Information Systems on User Performance : A Critical Review and Theoretical Model. International Conference on Information Systems (ICIS), World Academy of Science, Engineering and Technology (57), 809–819.
Afthanorhan, W. (2013). Partial Least Square Structural Equation Modeling (PLS-SEM) and Covariance Based Structural Equation Modeling (CB-SEM) for Confirmatory Factor Analysis. International Journal Engineering and Science, 2(5), 198–205.
Agbor, J. (2011). The Relationship between Customer Satisfaction and Service Quality: a study of three Service sectors in Umeå., 92.
Ahmed, S. (2013). Public Procurement System and e-Government Implementation in Bangladesh: The Role of Public Administration. Journal of Public Administration and Policy Research, 5(5), 117–123.
Ajoye, M. B. (2014). Information Systems User Satisfaction : a Survey of the Postgraduate School Portal ,. Library Philosophy and Practice, 2(12), 287.
Alkhalaf, S., Nguyen, A. T. a, Drew, S., & Jones, V. (2013). Measuring the Information Quality of e-Learning Systems in KSA: Attitudes And Perceptions of Learners. Advances in Intelligent Systems and Computing, 208(1), 787–791.
Ateto, D., Ondieki, S., & Okibo, W. (2013). The Effect of e-Procurement Practices on Effective Procurement in Public Hospitals: A Case of KISII Level 5 Hospital. American International Journal of Contemporary Research, 3(8), 103–111.
Chimwani, B. I., Iravo, M. A., & Tirimba, O. I. (2012). Role of Public E-Procurement Technology To Reduce Corruption in Government Procurement. International Public Procurement Conference, 17-19(8), 304– 334.
Chimwani, B. I., Iravo, M. A., & Tirimba, O. I. (2014). Factors Influencing Procurement Performance in the Kenyan Public Sector : Case Study Of The State Law Office. International Journal of Innovation and Applied Studies, 9(4), 1626–1650.
DeLone, W. H., & McLean, E. R. (1992). Information Systems Success: The Quest for the Dependent Variable. Information Systems Research, 3(1), 60–95.
DeLone, W. H., & McLean, E. R. (2003). The DeLone and McLean Model of Information Systems Success : A Ten-Year Update. Journal of Management Information Systems, 19(4), 9–30.
Dza, M., Fisher, R., & Gapp, R. (2013). Procurement Reforms in Africa: The Strides, Challenges, and Improvement Opportunities. P ublic Administration Research, 2(2), 49–57.
Eisenhardt, M. (1989). Agency Theory : and Assessment Review. Academy of Management Review, 14(1), 57–
74.
Gardenal, F., Andrea, D., & Manzo, V. (2013). A Model to Measure e-Procurement Impacts on Organizational Performance. Journal of Public Procurement, 13(3), 215–242.
Jensen, M. C., & Meckling, W. H. (1976). Theory of the Firm : Managerial Behavior , Agency Costs and Ownership Structure Theory of the Firm : Managerial Behavior , Agency Costs and Ownership Structure. Journal of Financial Economics, 3(4), 305–360.
Khristianto, W., Suyadi, I., & Kertahadi. (2012). The Influence of Information, System Quality and Service Quality on Customer Sarisfactionand Loyalty in Online Shopping. 2nd International Journal of Academic Research, 4(2), 28–41.
Kiprono, R. (2013). Challenges of E-Procurement Adoption in the Kenyan Public Sector: A Survey of Parastatals in the Ministry of Finance. School of Human Resource Development, 1(1), 26–83.
Mahmud, A., Jusoff, K., & Hadijah, S. T. (2013). The Effect of Service Quality and Price on Satisfaction and Loyalty of Customer of Commercial Flight Service Industry. World Applied Sciences Journal, 23(3), 354– 359.
Manchanda, A. (2014). An Empirical Application of Delone and Mclean Model In Evaluating Decision Support System In The Banking Sector of Oman. International Information Management Association, 23(2), 47– 58.
McGill, T., Hobbs, V., & Klobas, J. (2003). User Developed Applications and Information Systems Success: A
Test of Delone And Mclean’s Model. Information Resources Management Journal, 16(1), 24–45.
Moe, C. E. (2008). Theoretical Foundations for Analyzing Procurement of IS in Public Sector. Journal of Public Procurement, 2(1), 87–94.
Mose, J. M., Njihia, J. M., & Magutu, P. O. (2013). E-Procurement Adoption Among Large Scale Manufacturing Firms in Nairobi , Kenya. European Scientific Journal, 9(13), 375–401.
Nahar, A., & Widiastuti, A. (2011). Analisis Penggunaan Informasi Akuntansi pada Industri Menengah di Ka-bupaten Jepara. Semantik, 4(2)39-81.
Neupane, A., Soar, J., Vaidya, K., & Yong, J. (2012). Role of Public E-Procurement Technology To Reduce Corruption in Government Procurement. Role of Public E-Procurement Technology To Reduce Corruption in Government Procurement, 17-19(8), 304–334.
Nwone, S. A. (2014). Exploratory Study of Information System User Satisfaction : A Study of University of Ibadan Post Graduate School Web Portal. International Journal of Computer and Information Technology, 03(06), 1372–1381.
Rahim, M. M., & Saber, S. N. A. (2011). E-Procurement Adoption Process: An Arduous Journey for an Australian City Council. International Journal of Electronic Finance, 5(2), 150.
Ramayah, T., & Lee, J. W. C. (2012). System Characteristics, Satisfaction and E-Learning Usage: a Structural Equation Model (Sem). Turkish Online Journal of Educational Technology, 11(2), 196–206.
Tertiana, I. (2014). E-Procurement Entry Strategy – Indonesia Case Invanos. E-Procurement Entry Strategy - Indonesia Case, 1(1), 28–36.
Uba, Z., Sharifai, M. G., Mubaraka, C. M., Agaba, L., & Principal, D. (2013). E-Procurement and Performance of Service Organizations in Uganda. European Journal of Business and Management, 5(12), 46–50.
Vaidya, K., Sajeev, A. S. M., & Callender, G. (2006). e-Procurement Initiatives in the Public Sector: A Literature Review of the Critical Success Factors. Journal of Public Procurement, 6(1), 70–99.
Yang, H. (2007). Assessing the Effects of e-Quality And e-Satisfaction on Website Loyalty. International Journal of Mathematics and Computers in Simulation, 1(3), 288–294.
Appendices
Appendix 1
Appendix 2
ULP Employees Classification Based on Gender, Age, and Education
DIY
Prov. Yogyakarta Sleman Bantul
Kulon
Vendors Classification Based on Gender, Age, and Education
DIY
Prov. Yogyakarta Sleman Bantul
Appendix 4
Classification based on Employee Level, Employee Status, Start Date of Work in ULP, and Cer-tification
DIY
Prov. Yogyakarta Sleman Bantul
Appendix 5
Classification Based on Type of Company, Title, Participation Duration in e-Procurement, and Frequencies Participation in e-Procurement
DIY
Prov. Yogyakarta Sleman Bantul
Kulon
Progo Gunungkidul Total
Company Type
Supplier 0 1 2 1 1 0 5 23%
Contractor 0 1 0 0 0 3 4 18%
Supplier and
Contractor 3 0 0 2 2 0 7 32%
Consultant 2 1 2 1 0 0 6 27%
Total Respondent 5 3 4 4 3 3 22 100%
Title
Director 0 0 0 1 0 1 2 9%
Supervisor 1 0 2 0 0 0 3 14%
Staff 4 3 2 4 3 1 17 77%
Total Respondent 5 3 4 5 3 2 22 100%
Participation
Duration in
e-Procurement
< 1 year 0 1 2 0 0 0 3 14%
> 1 year 5 2 2 5 3 2 19 86%
Total Respondent 5 3 4 5 3 2 22 100%
Frequencies
Participation in
e-Procurement
< 5 times 3 0 3 1 0 2 9 36%
> 5 times 2 3 1 4 3 0 13 41%
Total Respondent 5 3 4 5 3 2 22 100%