3D DATA ACQUISITION FOR INDOOR ASSETS
USING TERRESTRIAL LASER SCANNING
S. Y. Lee a, *, Z. Majid a, H. Setan a
a Photogrammetry and Laser Scanning Research Group, Faculty of Geoinformation and Real Estate, Universiti Teknologi Malaysia, Malaysia – [email protected], (zulkeplimajid, halim)@utm.my
KEY WORDS: Terrestrial Laser Scanning, Indoor assets, 3D visualization, 3D modelling, 3D GIS, Multipatch format
ABSTRACT:
The newly development of technology clearly shows an improvement of three-dimension (3D) data acquisition techniques. The requirements of 3D information and features have been obviously increased during past few years in many related fields. Generally, 3D visualization can provide more understanding and better analysis for making decision. The need of 3D GIS also pushed by the highly demand of 3D in geospatial related applications as well as the existing fast and accurate 3D data collection techniques. This paper focuses on the 3D data acquisition by using terrestrial laser scanning. In this study, Leica C10 terrestrial laser scanner was used to collect 3D data of the assets inside a computer laboratory. The laser scanner device is able to capture 3D point cloud data with high speed and high accuracy. A series of point clouds was produced from the laser scanner. However, more attention must be paid during the point clouds data processing, 3D modelling, and analysis of the laser scanned data. Hence, this paper will discuss about the data processing from 3D point clouds to 3D models. The processing of point cloud data divided into pre-processing (data registration and noise filter) and post-processing (3D modelling). During the process, Leica Cyclone 7.3 was used to process the point clouds and SketchUp was used to construct the 3D asset models. Afterward, the 3D asset models were exported to multipatch geometry format, which is a 3D GIS-ready format for displaying and storing 3D model in GIS environment. The final result of this study is a set of 3D asset models display in GIS-ready format since GIS can provides the best visual interpretation, planning and decision making process. This paper shows the 3D GIS data could be produced by laser scanning technology after further processing of point cloud data.
1. INTRODUCTION
Geographic Information System (GIS) is a multi-task tool, which is designed to store, manipulate, analyze and output map-based or spatial information (Steinberg & Steinberg, 2006). It is a system that allows users to handle spatial data in supports of planning, agriculture, infrastructure maintenance, and many other fields. In the past decades, GIS is growing rapidly and three-dimension (3D) is getting more familiar. Hence, there is an increasing desirability for enhanced visualization of the 3D description of spatial data for various applications.
Many GIS data can be provided in 3D visualization. Due to the rapid development of technology, there are several techniques available to acquire 3D data such as image-based approach, point cloud-based approach and integrated approach (Xiao et al., 2007). These approaches provide powerful tools for 3D modelling and visualizing 3D scenes. 3D visualization plays essential roles varying from the fields such as engineering, architecture, indoor emergency evacuation, urban planning, transportation planning, and facilities and utilities management. Thus, various 3D activities have been conducted.
In this paper, we aim to present the results of 3D data acquisition using terrestrial laser scanning approach. This paper is divided into 5 sections. Following by the brief introduction, a review on 3D data acquisition approaches for 3D modelling is discussed in section 2. The study area, instrument and data processing are covered in section 3. The results and discussions presented in section4.Lastly, conclusions and suggestions are discussed in the last section.
2. 3D DATA ACQUISITION APPROACHES
Upon the latest technology developments, there are several methods clearly showed an improvement on the 3D data resolution and accuracy, the data collection techniques such as aerial and close range photogrammetry, airborne or ground-based laser scanning, mobile mapping and GPS surveying (Tao, 2004). Recently, a lot of researches have been conducted for the reverse engineering and 3D object reconstruction using different approaches to acquire the 3D data, like image-based approach, point cloud-based approach and integrated approach.
2.1 Image-based Approach
Image-based approach is a conventional method to acquire 3D data using stereo image pairs (Tao, 2004). Photogrammetry is the technique of measuring objects (2D or 3D) from photo-grammes. Stereo photogrammetry is a conventional approach for 3D mapping and object reconstruction, which is based on a series of overlapped images.
The employment of close-range photogrammetry has matured to the level where digital cameras can be used to capture the close images of objects, such as buildings, and reconstruct the objects. Close-range photogrammetry uses the triangulation principle. Measurement of 3D point in close range photogrammetry is a set of images oriented to a coordinate system (Figure 1). The positions of (x,y,z) and the rotation angles (ω, φ, κ) of the images have to be determined prior to the evaluation (Koch & Kaehler, 2009).
close range photogrammetry process has improved in its time and cost effectiveness.
Figure 1. The principle of close-range photogrammetry (Koch & Kaehler, 2009)
2.2 Point Clouds-based Technique
3D point clouds data can be produced by laser scanning technology. The laser scanning technology offers fast and accurate way to collect 3D data, makes use of non-contact laser pulse for measuring the surface profile of objects (Dongzhen et al., 2009). In past few years, the most common methods for producing 3D data is currently through the use of laser scanners because laser scanners are fast and efficient in collecting surface data to provide high accuracy measurement of visible objects.
Such laser scanners come in a variety of models and subdivided into three main groups depending on the maximum distance range they cover: close range scanners (2 – 3m), medium range scanners (500-1000m) and long range scanners (up to several kilometres). These scanners usually specifically suited to a particular range and object size. The laser scanner can digitize all the 3D information concerned with a real world object such as buildings, trees and terrain down to millimetre detail. These scanners have been expensive in the past, but are becoming more affordable as use becomes more widespread.
Laser scanners can be used for both indoor and outdoor data capture. A series of point clouds produced by laser scanner can provide the basis for surface reconstruction or modelling. The point clouds also contained information such as object size, shape form, location and surface characteristics of objects in the real world. Subsequently, objects can be modelled based on the information extracted from point clouds. Figure 2 shows the 3D point cloud data produced by laser scanner.
Figure 2. 3D point cloud data produced by laser scanner (Source: http://www.3deling.com/category/3d-laser-scanning/)
2.3 Integrated Approach
The acquisition of 3D data is ubiquitous in this era. The integrated approach is the integration of the point cloud and image approaches. This approach acquires point cloud and images simultaneously by the laser scanner with the digital camera attached on it (Xiao et al., 2007). As a result from this approach, point cloud can be used to reconstruct geometry objects and images can be used for the objects colour texture.
The combination of both point cloud and image can produce real world visualization and real objects representation.
3D models that reconstructed from the high accuracy point cloud and image texture is useful and available for interactive exploration and analysis. Since the automated acquisition mechanism of laser scanning system, everything associated with the environment will be included. The collection of a dense point cloud may support the interactive visualization. The 3D models also measurable which are considered as a useful tool for documentation and management of buildings and facilities. In addition, the post-editing work of the point cloud can be done through modelling software such as AutoCAD, 3Ds Max, Revit Architecture, and SketchUp. This integration environment of 3D data will take full advantages of 3D data.
3. DATA ACQUISITION AND PROCESSING
3.1 Site Description
In this study, a computer laboratory was selected to be scanned. This computer laboratory called GIS Lab 1,is located at block B08 of Faculty of Geoinformation and Real Estate (FGRE), in Universiti Teknologi Malaysia (UTM), Johor Bahru. The GIS Lab 1 is use for conducting lectures and doing lab works. The lab is equipped with facilities including 40 computer sets, projector, air-conditioners, chairs and tables. The measurement area of this laboratory is about 15m x 10m x 2.5m, where it can accommodate 40-45 students. Figure 3 shows the location of block B08 in UTM campus and environment in GIS Lab 1.
Figure 3. Location of block B08 in UTM campus and environment in GIS Lab 1
3.2 Terrestrial Laser Scanner: Leica ScanStation C10
In this study, laser scanner was applied for interior building scanning which is used to capture indoor objects (assets). The laser scanner used in this study is Leica ScanStation C10 (Table 1) and the scanned data were managed with it associated software Leica Cyclone. ScanStation C10 is a high accuracy and medium range scanning laser scanning system. It associated with high-resolution camera, laser-fast targeting and textured-scans.
and a horizontal range of 360°. This scanner has accuracy to2mm at 1 sigma (1 – 50m range). Table 1 is shows the specification of Leica ScanStation C10.
Leica ScanStation C10
Range measurement
Principle Pulsed (Time-of-flight) Scanner Control Full colour touch-screen
Range Up to 300 m (minimum range 0.1 m)
Field-of-view 360 ̊ horizontal, 270 ̊ vertical
Scan Rate Up to 50,000 measurement points/sec
Single Image 1.8MB, 4Mpixels (1920 x 1920 pixel)
Ranging Error ±4 mm
Weight 13.0 kg
Battery life Up to 3.5 hours
Data transfer Ethernet, WLAN or USB 2.0 device
Table 1. Specification Leica ScanStation C10
A substantial component of laser scanning system is the software. The software allows the point clouds management such as data registration and noise filtering. This scanner is possible to register various scans with or without using targets, because it can be registered using natural targets, which is known as point-to-point registration. The scanner produce series of point clouds and the point clouds can provide the basis for surface reconstruction or modelling. The point clouds also contained information such as object size, shape form, location and surface characteristics of objects in the real world. Subsequently, objects can be modelled based on the information extracted from point clouds. The workflow of 3D model construction based on point cloud data can be seen in Figure 4.
Figure 4. Workflow of 3D modelling based on point cloud
3.3 Data Acquisition
Data acquisition is a very important step in a study because data is one of the main components to support the whole study. In this study, TLS system was used to capture indoor assets data in 3D form. Laser scanner – Leica ScanStation C10 was used in this study.
Data acquisition consists of several steps. The study area to be scanned is full with assets and objects. Objects in the lab may obstruct the laser light to reach in some hidden corners. Appropriate location for station setup can help to reach the maximum of scanning coverage. Therefore, a working plan was drafted. It is mainly consists of the scanner’s location as well as location of the targets and type of target used. An optimal location for the scanner was chosen to guarantee a maximum coverage and accuracy while minimizing the number of setups. In order to combine the different scanning scenes into a single coordinate system (registration), it is necessary to determine certain common points (targets) between two adjacent scanner stations. Targets are essential because they are needed as control points for registration and merging point cloud data during the data processing later.
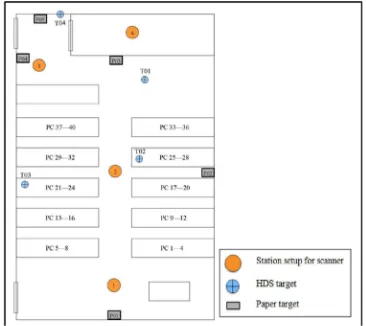
After surveying the environment of GIS Lab 1, 4 scan stations were planned to be set up to cover the whole laboratory and 9 targets (4 HDS targets and 5 paper targets) were populated around the laboratory. Figure 5 shows distribution of scan stations and targets.
Figure 5. The distribution of scan stations and targets
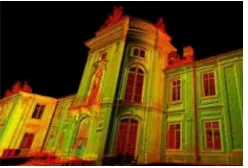
Figure 6. Point clouds produced by laser scanner
3.4 Data Processing
Software play an important role in data processing. There are many software available for viewing and processing point cloud data. In this study, Leica Cyclone 7.3 was used to process point cloud data produced by the laser scanner. Leica Cyclone software is specifically designed for the Leica laser scanner. It helps to manage data efficiently in databases.
The immediate result produced by laser scanner is a series of point cloud. Each point is represented by 3D coordinates (x,y,z). The data processing of point clouds is performed through several steps. The data processing is necessary to obtain accurate and correct model of the objects. The data processing steps is divided into two stages: (1) pre-processing and (2) post-processing (modelling).
3.4.1 Data Pre-Processing
Pre-processing is also known as a preliminary treatment. In pre-processing stage, the operations were directly carried out on the point clouds. This process includes two main actions which are noise filtering and registration point. The result of these procedures was a combined point cloud from all scans (registered) and “noise-free” point cloud.
In this study, Leica Cyclone was used to process the point cloud data produced from the laser scanner. Each set of point cloud has its own coordinate system. In this stage, registration process was performed to align all the point clouds to one common coordinate system. This action registers and merges the several scans into one complete model. The result of point cloud registration was shown in Figure 7.
Figure 7. Result of point cloud registration
After the registration process, noise filtering should be performed to reduce the amount of points and remove unnecessary points. This is because the point cloud produced from laser scanner may compose erroneous points that derived from object surface quality and laser dispersion. Figure 8 shows before and after noise filtering process.
Figure 8. Noise filtering process
The point cloud preliminary treatment was completed with the process of registration and noise filtering. Lastly, unify all scans into a single of large datasets of point cloud. This process enables fast-working and efficiently with the unified data format.
3.4.2 Data Post-Processing (3D Modelling)
The second stage of point cloud data management is post-processing which is an operation to form a surface model of objects based on point cloud. 3D modelling is a time-consuming and technical process. The 3D modelling can be carried out with modelling software. In this study, modelling process was done by using SketchUp software. SketchUp was used in this study because it is an easy-to-use 3D modelling software and it can export the models to a various common 3D data formats like COLLADA (*.dae), where COLLADA format will be used in the later process.
Due to software limitations, the huge amount of point cloud dataset was not able to import to SketchUp. Therefore, the computer lab and assets inside the lab were constructed manually in SketchUp by obtained the dimensions and size of each object from point cloud. Although it is using manual modelling approach, point cloud still important in this process because it is able to provide information such as object measurement, shape and position. Such information can be obtained from point cloud easily without spending lot of time on field.
SketchUp is possible to draw any objects or models with its existing drawing tools and functions such as move, rotate, scale and extrude. However, modelling process required skill to produce a surface that has sufficiently high and precision.
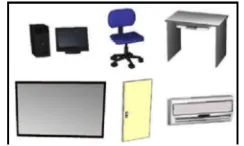
Usually, 3D object comprises of geometric and textural models. Basic geometric elements such as lines, surfaces, volumes are used to construct a complete 3D model. There were several basic objects have been modelled in this study, namely wall models, floor and ceiling models, desk models, table models, computer set models, and air-condition models. Figure 9 shows the asset models constructed using SketchUp.
Figure 9. The object models in GIS Lab 1
Figure 10. 3D Model with colour and texture
After that, the 3D model of GIS Lab 1 was exported to COLLADA (*.dae) format. Every object model is grouped and exported one by one so that it was a single feature when import to ArcScene (ESRI ArcGIS).
3.4.3 GIS-Ready Format
3D GIS data not only provide 3D visualization, information and analysis, but also capable to work with attributes linked to GIS database. There are several steps to produce GIS-ready model. The processes are illustrated in Figure 11.
Figure 11. Process from point cloud data to GIS-ready models
In this study, multipatch geometry was used to represent 3D GIS models in ESRI ArcGIS software. ArcScene is a 3D visualization application in ArcGIS Desktop, can support 3D features in multipatch format. In ArcScene, all 3D models must be stored in a geodatabase as stand-alone feature classes. The Import 3D Files tool in ArcToolbox is used to import the COLLADA file (*.dae) and create geodatabase of 3D models in ArcScene.
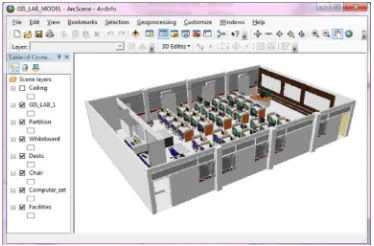
Every 3D model file was stored as a single feature class in a specified personal geodatabase and every 3D model filename was existed as feature record in attribute table (Figure 12).Other additional information can be added and stored in the attribute table. Figure 13 shows the complete model of GIS Lab 1 displayed in ArcScene.
Figure 12. The attribute table was created and every 3D model filename exist as feature record in attribute table
Figure 13. The complete model of GIS Lab 1 displayed in ArcScene
4. RESULTS AND DISCUSSIONS
In this study, a set of point cloud of GIS Lab 1 was collected using Leica ScanStation C10. The point cloud dataset was being processed and registered. The complete model of the computer lab was successfully constructed using SketchUp. When having 3D models in SketchUp, they were imported and displayed in ArcScene. Lastly, a comparison between point cloud data with conventional methods (distometer and measurement tape) was carried out.
4.1 3D Model in ArcScene
The result of this study was 3D models constructed using SketchUp based on point cloud data. The final result of this study was the 3D indoor assets displayed and stored in GIS environment. The 3D asset models were represented as multipatch geometry in a single personal geodatabase in ArcScene.
The 3D models in ArcScene were existed as feature record in attribute table (Figure 14). With the 3D models linked with attribute table, it is able to perform some simple query in ArcScene. The asset information recorded in the table is editable, such as edit, add or delete the records. Hence, the 3D models in multipatch format can be considered as 3D GIS-ready data.
Figure 14. The 3D model filename existed in the attribute table
4.2 Accuracy Assessment
= ∑ ( ̅) RMSE is common used in research field to describe accuracy of features and it is acceptable to measure the error and estimate the quality of features. The lower the RMSE value, the better the accuracy.
Meanwhile, the analysis for this study included the comparison of measurement between point cloud data and conventional method. The actual measurement of objects was measured using Leica distometer and measurement tape. The comparison was done and recorded in Table 2. The RMSE value of the point cloud data and conventional method was 0.02 m or 2 cm.
Features DimensionDistometer (m)Tape/ Cloud Point (m)
Table 2. Comparison of measurement between conventional method and point cloud data
Based on the result shown in Table 2, the highest measurement differences were whiteboard and window. The average differences were 0.047m (length) and 0.021m (width). This is because of the objects have high reflectivity surface. The lowest measurement differences were air-condition and tables, which are in average less than 0.01m. It is because these objects have low reflectivity surface.
According to the comparison, it is proved that laser scanning method was accurate and sufficient to produced reliable virtual and detailed 3D models even for small and complex objects.
5. CONCLUSION
3D data acquisition has become ubiquitous over the past decade. However, the automation of 3D modelling still remains a big challenge and improvement. Many researches and approaches have been conducted to look for the improvement in this area.
Terrestrial laser scanning technology has been applied for collecting 3D data in an indoor environment. The terrestrial laser scanning system worked satisfactory during the data acquisition. The data acquisition is quite simple and easy to learn to operate the laser scanner, but the point cloud processing is time-consuming especially during the 3D modelling process.
In this study, point cloud data were produced and performed 3D modelling using a manually approach since there are limitations of the modelling software. Although the modelling process is not fully automated, the results of 3D modelling were satisfied and accurate. Generally, terrestrial laser scanning is a promising technique to produce 3D data.
In the future, it is suggested that the automation of 3D modelling from point cloud data can be improved as it is necessary for more effective and efficiency works.
REFERENCES
Dongzhen, J., Yam Khoon, T., Zheng, Z., & Qi, Z. (2009). Indoor 3D Modelling and Visualization with 3D Terrestrial Laser Scanner. In J. Lee, & S. Zlatanova, 3D Geo-information Sciences (pp. 247-255). Springer Berlin Heidelberg.
Koch, M., & Kaehler, M. (2009). Combining 3D Laser-Scanning and Close-Range Photogrammetry: An Approach to Exploit the Strength of Both Methods. Computer Applications to Archaeology. Williamsburg.
Mao, H., & Shi, W. (2008). New Methodology of Representing the Positionla Error of Non-Point Features in GIS. The International Archives of the Photogrammetry, Remote Sensing and Spatial Information Sciences , XXXVII, pp. 1503-1508. Beijing.
Steinberg, S. J., & Steinberg, S. L. (2006). Introduction to Geographic Information Systems. In Geographic Information Systems for the Social Sciences: Investigating Space and Place (pp. 7-16).
Tao, V. (2004, July 21). 3D Data Acquisition and Object Reconstruction for AEC/CAD. Retrieved December 12, 2012,
from Direction Magazine:
http://www.directionsmag.com/articles/3d-data-acquisition-and-object-reconstruction-for-aeccad/123668