www.elsevier.nlrlocaterjappgeo
Railway track inspection using GPR
J. Hugenschmidt
)EMPA, Swiss Federal Laboratories for Materials Testing and Research, Ueberlandstrasse 129, CH-8600 Duebendorf Switzerland
Received 15 September 1998; received in revised form 23 February 1999; accepted 15 March 1999
Abstract
Ž .
Swiss Federal Railways SBB inspect their railway tracks at regular intervals. The first step of track renewal planning is a geotechnical study. Inspection is focused on the thickness of the ballast, on subsoil material penetrating upwards into the ballast and on geotechnical properties of subgrade and subsoil materials. Up to now, the inspection has been done mainly by digging trenches at evenly spaced intervals and in locations of special interest. In order to evaluate the benefits and limits of GPR railway track inspections, three GPR surveys were carried out on three different railway lines. Data were acquired using a mobile system travelling at 10 kmrh. Subsequent to radar data acquisition, trenches were dug. The positioning of some of the trench locations was based on preliminary GPR results in order to support the interpretation of GPR data. Only those trenches were available during interpretation of radar data. In addition, SBB performed their usual investigation programme. This provided an opportunity for checking the radar results in great detail.q2000 Elsevier Science B.V. All
rights reserved.
Keywords: GPR; Railway track inspection; Ballast inspection; Non-destructive testing
1. Introduction
Up to now, in Switzerland, the inspection of railway ballast beds, subgrade and subsoil has been done mainly by digging trenches at evenly spaced intervals and in locations of special in-terest. By doing so, detailed information was obtained at the trench locations but only little information was available in between. Also, digging trenches is expensive, destructive and obstructive to railway traffic.
)Tel.:q41-1-823-43-18; fax:q41-1-821-62-44; e-mail:
When searching for a method allowing for a reduction of trenches required and providing information in between, GPR seems to be an obvious choice. GPR has been successfully ap-plied for the investigation of other traffic-related structures such as road pavements and bridge decks. If mobile acquisition systems are used, data can be recorded economically causing
min-Ž
imal obstruction to traffic flow Davis et al., .
1994; Hugenschmidt et al., 1998 . However, railway lines do not offer very favourable radar conditions. The problems caused by the pres-ence of sleepers, tracks and numerous near- and subsurface installations have to be addressed by
0926-9851r00r$ - see front matterq2000 Elsevier Science B.V. All rights reserved. Ž .
( )
J. HugenschmidtrJournal of Applied Geophysics 43 2000 147–155
148
an appropriate approach to data acquisition and processing.
With the aim of evaluating the benefits and limits of GPR inspections, Swiss Federal
Rail-Ž .
ways SBB placed an order with EMPA for the investigation of three railway lines. The focus of the radar inspections was on ballast thickness and on the detection of zones where subsoil material had penetrated into the ballast. The total length of the inspected sections was 15.1 km. In addition to the 41 trenches based on preliminary GPR results that were available dur-ing interpretation of radar data, SBB performed their usual investigation programme digging 77 trenches. This provided the opportunity for a quantitative evaluation of radar results.
2. Data acquisition
Data were acquired in summer 97 using a GSSI SIR-10A system and a 900-MHz antenna ŽGSSI Model 3101D . Hanninnen et al. 1992.
¨
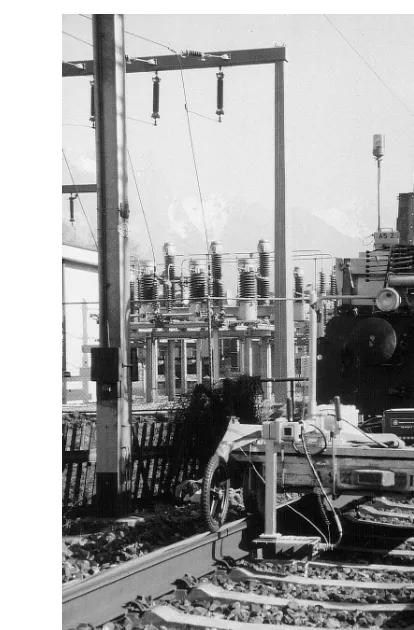
Ž . Žpp. 22 provide more information on the 900-. MHz antenna. Fig. 1 shows the survey wheel and the antenna mounted to a trailer which was pulled by a small diesel locomotive at 10 kmrh. The acquisition parameters can be summa-rized as follows:Ø acquisition speed: 10 kmrh,
Ø horizontal sample rate: 15 scansrm, Ø data word length: 16 bit,
Ø samples per scan: 512,
Ø antenna height: 8 cm, top of sleeper to bot-tom of antenna casing,
Ø antenna orientation: at right angles to travel-ling direction,
Ø scan length: 25 ns.
In the weeks prior to the radar surveys and during data acquisition there was heavy rainfall. Data were recorded and stored on tape with-out any processing. Also, no effort was made to avoid data collection when passing over sleep-ers as this would not only require a more so-phisticated acquisition system but would also
Fig. 1. Set-up for mobile data acquisition on railway tracks.
reduce the potential for future high speed data acquisition.
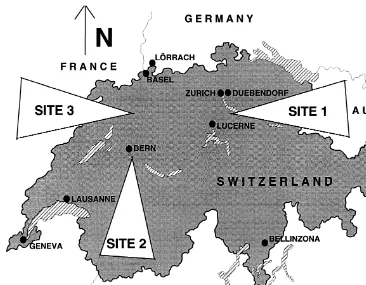
The site locations are shown in Fig. 2. The different sections are presented in Table 1.
3. Data processing
Raw data were copied to a PC for processing. The aims of this processing can be summarized as follows.
Ø establishment of the ballast surface as a com-mon reference level,
Ø enhancement of signalrnoise ratio,
Ø introduction of coordinate system used by SBB,
Fig. 2. Location of GPR sites.
The following processing steps were applied: 1. bandpass filtering,
2. correction of surface reflection to time zero, 3. migration,
4. horizontal scaling, 5. stack, eight-fold, 6. background removal,
7. horizontal smoothing, 8. vertical gain correction, 9. editing
10. transformation into SBB coordinates. A comparison between raw and processed data is presented in Fig. 3. For ease of compari-son, only every fifth trace has been plotted in
Table 1 GPR sections
Ž .
Site Name Length km Trenches available Total number Remarks
for interpretation of trenches
1 Au–Waedenswil 2.4 4 19
1 Waedenswil–Au 2.4 5 20
2 Rubigen–Guemligen 4.0 12 31
3 Deitingen–Wangen 2.3 8 15
3 Wangen–Deitingen 2.3 6 15
3 Wangen Track 3 0.7 3 8 railway station
3 Wangen Track 4 0.95 3 10 railway station
( )
J. HugenschmidtrJournal of Applied Geophysics 43 2000 147–155
150
Ž . Ž .
Fig. 3. Comparison between dataset before top and after processing bottom , site 2, profile length 40 m.
the raw dataset and the processed dataset is displayed before transformation into SBB coor-dinates. Profile length is 40 m. Besides an obvious improvement of the signalrnoise ratio, the surface reflection, around 3 ns in the raw dataset, was shifted to time zero and eliminated by applying background removal. The influence of the sleepers, which caused a very irregular reflection pattern in the raw data, was reduced considerably.
Whereas processing aims such enhancement of the signalrnoise ratio, correction of surface reflection or coordinate transformation are com-mon to many GPR investigations, the reduction
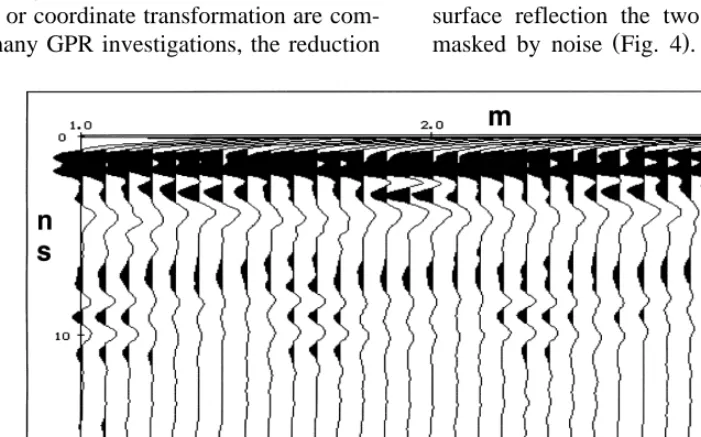
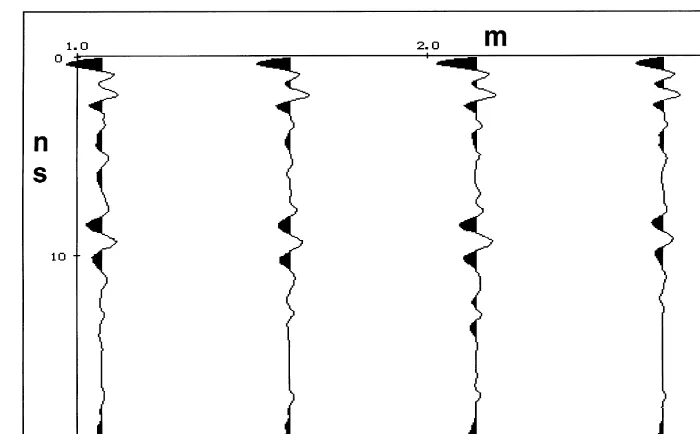
of the effects caused by sleepers is specific to railway track inspections and is therefore de-scribed in more detail. This reduction is achieved mainly through processing steps 3–6. In order to demonstrate the effects of these steps a subset of the dataset presented in Fig. 3 has been processed for demonstration purposes and is shown in Figs. 4–8. This subset was taken from the left part of the section presented in Fig. 3 where there are two reflections of interest around 10 ns.
After bandpass filtering and correction of the surface reflection the two reflections are still
Ž .
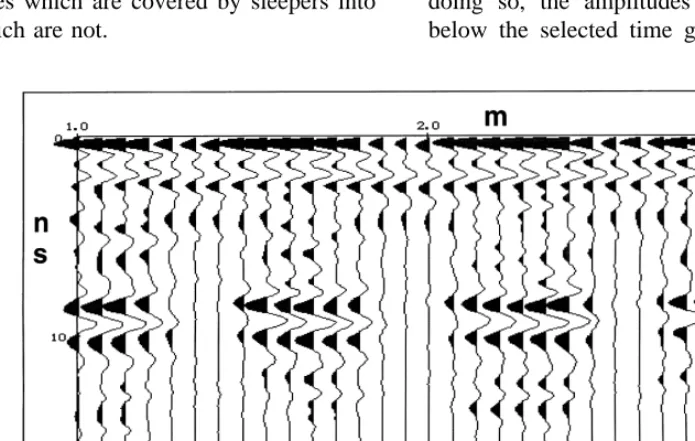
masked by noise Fig. 4 . Data were migrated
Fig. 5. Dataset after migration.
using a signal velocity of 1.4=108 mrs. This velocity was chosen after a comparison of radar data with trench information. As a result the horizontal alignment of the two reflections is
Ž .
improved Fig. 5 and energy has been moved from traces which are covered by sleepers into traces which are not.
The dataset after migration shows increased near surface signal amplitudes for traces recorded on sleepers. A time gate was defined Ž1.06–5.09 ns and the mean amplitudes within. this gate were scaled to the same level. By doing so, the amplitudes for the time range below the selected time gate are scaled down
( )
J. HugenschmidtrJournal of Applied Geophysics 43 2000 147–155
152
Ž .
Fig. 7. Dataset after stack eight-fold .
Ž .
for sleeper traces Fig. 6 . Please note that this scaling was not applied to all datasets because not all datasets showed a clear difference in near surface signal amplitudes between sleeper and non-sleeper traces.
Ž .
After stacking eight-fold Fig. 7 , the two reflections of interest show only minimal reduc-tion in resolureduc-tion when compared to the dataset in Fig. 4. As near-surface reflections caused by sleepers show little variation horizontally,
Fig. 9. Example of poor data quality within railway station, site 3, profile length 200 m.
ground removal is an efficient tool for reducing
Ž .
their amplitude see Fig. 8 .
4. Signal velocity
Ž .
Gobel et al. 1994 investigated the influence
¨
of various parameters on the signal velocity within the ballast and found velocities varying between 0.8=108and 1.2=108mrs for soiled ballast and 1.2=108 and 2.1
=108 mrs for clean ballast.
For economic reasons, the use of a constant signal velocity for the ballast is most desirable. Based on a comparison between radar data and trench information available during interpreta-tion, it was found that a constant signal velocity for the ballast of 1.4=108 mrs gave good results almost everywhere. The mean difference for the thickness of the ballast bed between the radar results and trench information in all 34
locations, where this thickness could be defined by the radar survey, was 3 cm. As this proved to be sufficient, a constant signal velocity of 1.4= 108 mrs was used for the ballast.
5. Results
5.1. Data quality
Data quality after processing was good al-most everywhere. An example showing poor data quality is presented in Fig. 9. This section was acquired within a railway station where numerous subsurface installations and material littered on the top of the ballast affected the quality of radar data.
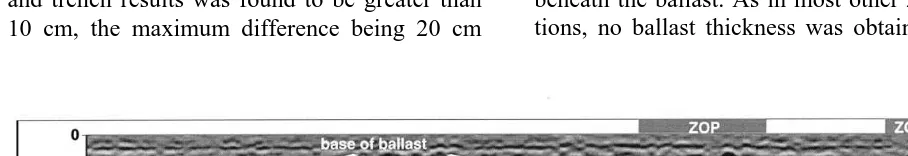
5.2. Thickness of ballast
A comparison between radar results and trench information not available during
interpre-Ž . Ž .
( )
J. HugenschmidtrJournal of Applied Geophysics 43 2000 147–155
154
Fig. 11. Subsoil material that has penetrated only into
Ž .
small parts of the ballast left and subsoil material halfway
Ž .
in between rails right .
Ž .
tation 49 comparisons results in a mean differ-ence of 4 cm. This is only slightly worse than that obtained during calibration and is sufficient for all practical purposes.
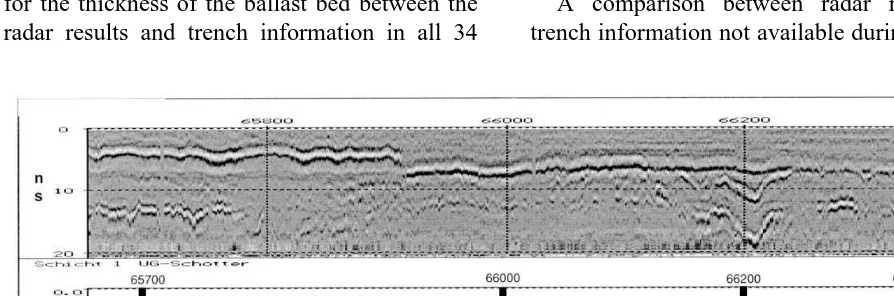
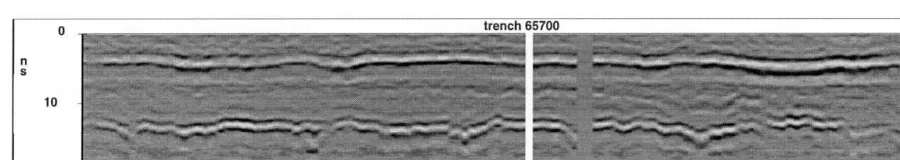
In Fig. 10, a 750-m long section from site 3 is presented together with the results for the base of the ballast. The four trenches available in this section are presented by vertical lines together with the depth obtained by the radar
Ž .
survey number left of line and the trenches Žright of line , respectively. Almost everywhere. in the section presented, the identification of the base of the ballast is straightforward. A differ-ent situation is encountered at trench location 66200 where the first reflection from the top does not result from the bottom of the ballast but from a reflector within the ballast caused by a partial cleaning of formerly soiled ballast. Trench location 66200 was defined after view-ing the data and was available durview-ing interpreta-tion. Without this information this situation would probably have been misinterpreted.
In three locations the difference between radar and trench results was found to be greater than 10 cm, the maximum difference being 20 cm
due to a misinterpretation of a reflector within the ballast caused by partial cleaning.
5.3. Subsoil material penetrating into the bal-last
Subsoil material penetrating into the ballast was found in 19 trench locations. In addition to this, material penetrated only into small parts of
Ž .
the ballast Fig. 11, left . As the radar survey was not expected to locate such zones they were not included in the following description which is restricted to locations with subsoil material halfway in between rails.
Ž .
Twelve of the 19 zones of penetration ZOPs were identified by the radar survey, two more were defined as possible ZOPs. Five ZOPs re-mained undetected by the radar survey for two reasons.
Ø In two locations the penetration of subsoil material was only 2 cm resp. 4 cm.
Ø Three ZOPs were located in or near a rail-way station where data quality was poor due to numerous installations in the subsurface and material littered on the top of the ballast. Twenty-three ZOPs that were not found by trenches due to the large distance between trench locations, were located by the radar survey. Also, the horizontal extent of most ZOPs could be defined.
In Fig. 12, a section of radar data is presented revealing not only several zones where clay had penetrated but also showing the top of the clay beneath the ballast. As in most other ZOP loca-tions, no ballast thickness was obtained within
Fig. 13. Dataset showing reflections caused by structures beneath ballast, site 3, profile length 200 m.
the two ZOPs due to the strong attenuation of the radar signal within the clay.
5.4. Subgrade and subsoil
Structures beneath the ballast such as sub-grade and subsoil interfaces are also of interest to the railway engineer. The radar surveys pre-sented in this paper revealed such structures in some sections only. An example is presented in Fig. 13 where a reflection can be distinguished arriving later than that caused by the bottom of the ballast. A trench marked in Fig. 13 revealed 42 cm of ballast followed by 42 cm of sandy gravel on top of silt containing clay and sand. Please note that this information was obtained just outside the rails whereas radar data were acquired in the middle between the rails.
6. Conclusions
The radar survey proved very useful to com-plement traditional inspection methods. The val-idation of radar results by numerous trenches that were not available until after interpretation of radar data, suggests that a considerable re-duction of the number of trenches required for the inspection of the ballast is possible.
Using a constant signal velocity of 1.4=108 mrs resulted in a satisfactory accuracy for the thickness of the ballast almost everywhere.
Subsoil material penetrating into the ballast was identified very reliably. Such zones only
remained undetected in a railway station where data quality was rather poor and in two cases where penetration was as little as 2 cm resp. 4 cm.
Acknowledgements
The author wishes to express his gratitude to
Ž .
Swiss Federal Railways SBB for permission to publish the results described in this paper. Spe-cial thanks to Gerhard Schmutz from SBB for his comments on this paper and the fruitful discussion of radar results.
References
Davis, J.L., Rossiter, J.R., Mesher, D.E., Dawley, C.B., 1994. Quantitative measurement of pavement structures using radar. Proc. 5th International Conference on Ground Penetrating Radar, Kitchener, Canada. Water-loo Centre for Groundwater Research, pp. 319–334. Gobel, C., Hellmann, R., Petzold, H., 1994. Georadar-¨
model and in-situ investigations for inspection of rail-way tracks. Proc. 5th International Conference on Ground Penetrating Radar, Kitchener, Canada. Water-loo Centre for Groundwater Research, pp. 1121–1133. Hanninnen, P., Hanninen, P., Koponen, L., Koshkiahde,¨ ¨
A., Maijala, P., Pollari, R., Saarenketo, T., Sutinen, R., 1992. Ground Penetrating Radar. The Finnish Geotech-nical Society, Finland.