4 Biennial Meeting of iEMSs, http://www.iemss.org/iemss2008/index.php?n=Main.Proceedings M. Sànchez-Marrè, J. Béjar, J. Comas, A. Rizzoli and G. Guariso (Eds.) International Environmental Modelling and Software Society (iEMSs), 2008
Global sensitivity analysis of biochemical,
design and operational parameters of the
Benchmark Simulation Model no. 2
Lorenzo Benedettia,c, Damien J. Batstoneb, Bernard De Baetsc, Ingmar Nopensa and
Peter A. Vanrolleghemd
a
BIOMATH, Ghent University, Coupure links 653, B-9000 Ghent, Belgium, [email protected], [email protected]
b
AWMC, The University of Queensland, 4067 Australia, [email protected]
c
KERMIT, Ghent University, Coupure links 653, B-9000 Ghent, Belgium, [email protected]
d
modelEAU, Université Laval, Pavillon Pouliot, 1065 av. de la Médecine, Québec QC, G1V 0A6, Canada, [email protected]
Abstract: Wastewater treatment plant control and monitoring can help to achieve good
effluent quality, in a complex, highly non-linear process. The Benchmark Simulation Model no. 2 (BSM2) is a useful tool to competitively evaluate plant-wide control on a long-term basis. A key component to characterise the system for control is output-parameter sensitivity. This paper brings the results of a global sensitivity analysis performed on the BSM2 model in its open loop version, by means of Monte Carlo (MC) experiments and linear regression. This study presents methods that were applied to make computationally demanding MC experiments on such a complex model feasible, by reducing the computation time for a single simulation and by setting low but sufficient number of runs for the MC experiments; it was found that 50 times the number of uncertain parameters was necessary. The most sensitive parameters turned out to be the design and operation parameters, followed by the wastewater treatment model parameters, while the adopted BSM2 evaluation criteria are rather insensitive to variations in sludge treatment models parameters. The results are verified on a closed loop version of BSM2, and allow future uncertainty analysis studies on BSM2 to be conducted on a smaller set of parameters and to focus the attention on the most critical parameters.
Keywords: activated sludge; anaerobic digestion; BSM2; mathematical modelling; numerical methods.
1. INTRODUCTION
The biological, physical and chemical phenomena taking place in activated sludge systems are complex, interrelated and highly non-linear. Moreover, the operation of these systems should continuously meet effluent requirements, preferably at the lowest possible operational cost. In order to achieve this, monitoring and control of such plants can be very helpful but, given the complexity, this is not an easy task. Operators are often reluctant to test new control strategies on the real plant because of their possibly unexpected behaviour.
Recently, the BSM2 [Jeppsson et al., 2007] was developed for plant-wide WWTP control strategy evaluation on a long-term basis, with a much more complex plant model. It consists of a pre-treatment process, an activated sludge process and sludge treatment processes.
This paper shows the results of a global sensitivity analysis (SA) performed on the BSM2 model in its open loop (without control) version, by means of Monte Carlo (MC) experiments and linear regression of the MC results [Saltelli et al., 2000]. The parameters for which the sensitivity is computed belong to the biochemical and physical models and to the design and operation of the plant. The study discusses the methods applied to reduce the computational efforts required by such a complex model, by testing possibilities to reduce the computation time of a single simulation, and by looking for a number of simulation runs for the MC experiments sufficient to accept the results of the sensitivity analysis.
2. METHODS
2. 1 The Model
The Benchmark Simulation Model no. 2 protocol [Jeppsson et al., 2007] consists of a plant wide (including wastewater and sludge treatment) model representing a general WWTP, a benchmarking procedure and a set of evaluation criteria. The three evaluation criteria used in this work are: (1) the Effluent Quality Index (EQI), a weighted sum of effluent pollutant loads with weight values set to 2 for BOD, 1 for COD, 2 for TSS, 30 for NH4 and 10 for
NO3; (2) the Operating Cost Index (OCI) which takes into account energy consumption
(aeration, pumping, mixing), external carbon addition, waste sludge production, heating of the digester and energy recovery from methane production; (3) the fraction of time in which the effluent exceeds the limit of 4mgNH4/l, expressed as percentage of the whole
evaluation period (one year, the last 365 of the 609 simulated days).
2. 2 Solver Optimisation
The BSM2 contains 265 differential equations and requires a simulation time of 609 days in very dynamic conditions (the evaluation is based on the last 365 days). In order to perform a global sensitivity analysis of such a complex model, potentially involving a very large number of MC simulations, careful selection of numerical settings is needed to minimise the time required to run a single simulation.
The modelling and simulation software used in this work was WEST (MOSTforWATER, Kortrijk, Belgium) with its new numerical engine Tornado [Claeys et al., 2006a]. The starting point was the Runge-Kutta 4th order adaptive step-size (RK4ASC) solver [Forsythe et al., 1977] with accuracy, initial and minimum step size set to 10-6 – which are the solver settings normally used with this type of models to provide very accurate results at reasonable computation cost.
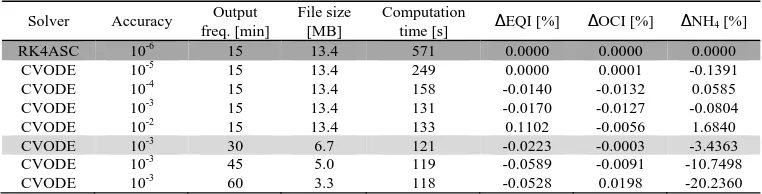
Advanced solvers such as CVODE [Hindmarsh et al., 2005] often show a better performance, and an approach based on scenario analysis was applied to find the best solver settings (see also Claeys et al. [2006b]), which provided as optimum: IterationMethod: Newton; LinearMultistepMethod: Adams; LinearSolver: SPGMR. Using those settings, results are shown in Table 1 with regard to computation time and difference from the reference (RK4ASC) for EQI, OCI and ammonium exceedance periods. The best compromise between solution difference and calculation time was found for a solver accuracy of 10-3.
half the output file size, which is an important factor for storage and post-processing of files. In other types of studies lower frequencies can be accepted [Ráduly et al., 2007]. The selected settings allow therefore, compared to the reference settings, a reduction to almost 1/5 of the computation time and to 1/2 of the output file size.
Table 1. Simulation performance for different solver settings and output frequencies; in
dark grey the reference simulation settings, in light grey the best settings.
Solver Accuracy Output
2. 3 Method for Sensitivity Analysis
The sensitivity of the three BSM2 evaluation criteria towards model parameters was assessed by means of MC experiments – which consist of performing multiple simulations with parameter values sampled from Probability Density Functions (PDFs) – and linear regression to calculate the Standardised Regression Coefficients (SRCs) and the Partial Correlation Coefficients (PCCs) of the parameters considered uncertain [Saltelli et al., 2000]. The SRCs represent the change in an output variable that results from a change of one standard deviation in a parameter, while the PCCs are the measure of linear dependence between an output variable and a parameter in the case where the influence of the other parameters is eliminated. A number N of simulations was run for each MC experiment, sampling from the PDFs of the parameters with Latin Hypercube Sampling (LHS) [Benedetti et al., 2008]. To evaluate the quality of the linear regression, the coefficient of determination R2, i.e. the fraction of the input variance reproduced by the regression model, was calculated; the regression is considered of good quality when
R2>0.7. The calculation of the t-statistic on the SRCs and PCCs [Morrison, 1984] allowed classifying the parameters as significant at the 5% level with a t-statistic larger than 1.96.
The number N is equal to n times the number of uncertain parameters, and n was determined as follows. Running the MC experiments with uncertain design and operational parameters (19 parameters), n was set to 4/3, 3, 12 and 20, i.e. N was 26, 57, 228 and 380. Since the ranking of the parameter sensitivities made on the basis of the SRCs and PCCs was different in all MC experiments (including three different MC experiments with n=20), it was assumed that n=20 was not sufficient, in disagreement with Manache and Melching [2008], where n=3 was sufficient for a model with similar structure, but probably with lower complexity. Three more MC experiments were performed with n set to 50 (N=950), and in this case the differences were less pronounced, allowing to select n=50 for the rest of the MC experiments as a compromise between accuracy of results and feasibility of computation.
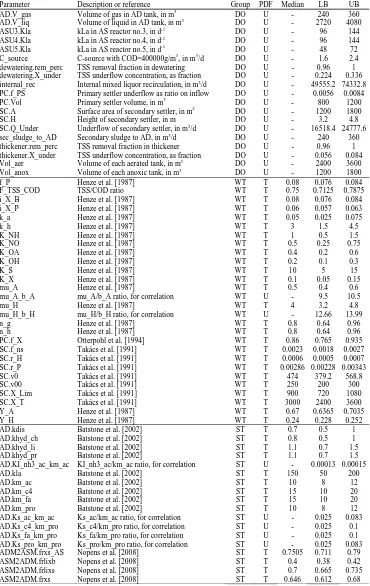
The parameters were divided into three groups (see Table 2 for details): (1) design and operational (DO) parameters, including volumes, recirculation rates, etc.; (2) wastewater treatment (WT) parameters, including some parameters of the ASM1 and of the primary and secondary settler models; (3) sludge treatment (ST) parameters, including some parameters of the ADM1 and interface parameters. Model parameters selected for testing were based on operational knowledge, previous studies, and our own sensitivity screening. Of course, a different choice for the PDFs might lead to different results [Benedetti et al., 2008].
equal to the BSM2 default and boundaries at +/-20% of the median. The PDFs of the ADM1 parameters were mainly taken from Appendix A in Batstone et al. [2002], with additional information from Batstone et al. [2003; 2004] and Siegrist et al. [2002], while for the AD/AS model interfaces parameters they were assumed to be triangular with median equal to the BSM2 default and boundaries +/-20% of the median.
Table 2. PDFs of parameters; LB=lower bound, UB=upper bound, DO=design and
operation, WT=wastewater treatment, ST=sludge treatment, T=triangular, U=uniform.
Parameter Description or reference Group PDF Median LB UB
AD.V_gas Volume of gas in AD tank, in m3 DO U - 240 360
dewatering.rem_perc TSS removal fraction in dewatering DO U - 0.96 1
dewatering.X_under TSS underflow concentration, as fraction DO U - 0.224 0.336
internal_rec Internal mixed liquor recirculation, in m3/d DO U - 49555.2 74332.8
PC.f_PS Primary settler underflow as ratio on inflow DO U - 0.0056 0.0084
thickener.X_under TSS underflow concentration, as fraction DO U - 0.056 0.084
Vol_aer Volume of each aerated tank, in m3 DO U - 2400 3600
AD.KI_nh3_ac_km_ac KI_nh3_ac/km_ac ratio, for correlation ST U - 0.00013 0.00015
AD.kla Batstone et al. [2002] ST T 150 50 200
AD.km_ac Batstone et al. [2002] ST T 10 8 12
AD.km_c4 Batstone et al. [2002] ST T 15 10 20
AD.km_fa Batstone et al. [2002] ST T 15 10 20
AD.km_pro Batstone et al. [2002] ST T 10 8 12
AD.Ks_ac_km_ac Ks_ac/km_ac ratio, for correlation ST U - 0.025 0.083
AD.Ks_c4_km_pro Ks_c4/km_pro ratio, for correlation ST U - 0.025 0.1
AD.Ks_fa_km_pro Ks_fa/km_pro ratio, for correlation ST U - 0.025 0.1
AD.Ks_pro_km_pro Ks_pro/km_pro ratio, for correlation ST U - 0.025 0.083
ADM2ASM.frxs_AS Nopens et al. [2008] ST T 0.7505 0.711 0.79
ASM2ADM.frlixb Nopens et al. [2008] ST T 0.4 0.38 0.42
ASM2ADM.frlixs Nopens et al. [2008] ST T 0.7 0.665 0.735
3. RESULTS
Four different MC experiments were performed to conduct the SA on: (1) design and operational parameters, (2) wastewater treatment parameters, (3) sludge treatment parameters and (4) all parameters together.
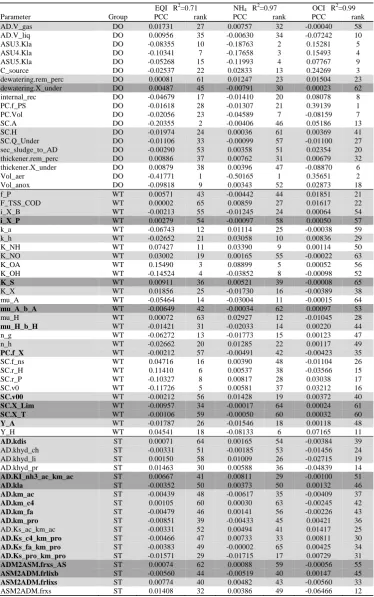
Performing the SA on the design and operational parameters, no less than 17 out of 19 parameters are significant for all three criteria based on the SRCs and 12 based on the PCCs. PCCs are indeed known to produce a smaller number of significant parameters [Manache and Melching, 2008]. As expected, the aerated volume (Vol_aer) is in general the most important parameter, followed by the air supply (Kla) in the three aerated tanks and by the external carbon dosage (C_source). Also relevant is the highest importance of the primary clarifier underflow (PC.f_PS) for the OCI, given the fact that primary sludge is very well suited for methane production. The surface of the secondary clarifier and the anoxic volume are very important for the EQI.
From the analysis on the wastewater treatment parameters, only 4 out of the 28 parameters were judged as not significant for the SRCs and 9 for the PCCs, in this case because of the very different importance of the parameters towards environmental and economic performance. The only ones that strongly influence both EQI (but not NH4) and OCI are
Y_H of ASM1 and r_P and v0 of the secondary clarifier model. Very important for EQI and NH4 are both K_OA and K_OH.
For the sludge treatment parameters, only one parameter out of 18 can be considered as not significant for all three criteria based on the SRCs, and 7 based on the PCCs. Clearly the most significant are khyd_pr of ADM1 and frxs of the AS/AD interface.
From Table 3, which shows the results for the SA on all parameters together, the three BSM2 evaluation criteria are mostly sensitive to design and operational parameters, and largely not to sludge treatment parameters. Ten out of 65 parameters were identified as not sensitive based on their t-statistic for SRC. With the significance tested on the t-statistic for the PCCs, only 25 of the original 65 parameters are classified as significant, with most of the AD parameters being not significant. An R2>0.7 indicates a good quality of the linear regression.
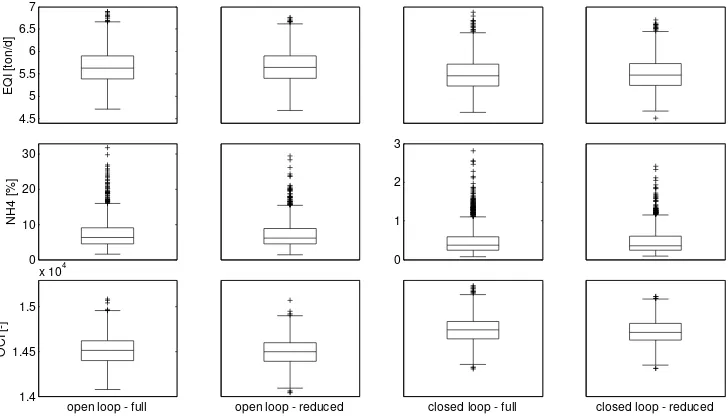
Figure 1 shows the variability of the three evaluation criteria for the three parameter categories separately and altogether. It is clear that most of the output variability is due to the design and operational parameters, as suggested by the figures in Table 3.
The sludge treatment parameters only contribute to the OCI variability, because of the importance of methane production for cost recovery. The AD is largely dimensioned and is very stable in open loop. The complexity of ADM1 might be required in closed loop configurations which alter the AD influent and/or operation, pushing it towards instability.
Performing the uncertainty analysis on the BSM2 with the 25 most significant parameters only, the overall uncertainty in model output is practically unchanged, as can be seen in Figure 1. This means that sensitivity and uncertainty analyses on BSM2 can be performed by only assuming that reduced parameter set to be uncertain. Such reduced analysis will not lead to a loss of significant information and will be significantly faster to conduct.
To verify the transferability of these results to different configurations of the BSM2 (e.g. a control strategy), a SA was conducted for the open loop configuration on the 38 wastewater and sludge treatment parameters, which are the parameters to be considered for SA in case a specific design and operation configuration has to be evaluated. Based on the significance for the PCCs (see Table 3), a reduced set of 24 parameters can be accepted. Figure 2 shows the variability of the three evaluation criteria with the full and the reduced parameter sets for the open loop and a basic closed loop, consisting of a simple dissolved oxygen controller on the three aerated tanks, which strongly reduces the NH4 exceedance period. It
Table 3. PCCs and ranking of all the parameters; in dark grey the parameters not
significant for all three criteria based on SRC and PCC; in light grey significant for SRC but not for PCC; without shading significant for both SRC and PCC; in bold face not
significant for SRC and PCC from the SA on WT and ST parameters (fixed DO parameters).
EQI R2=0.71 NH
4 R2=0.97 OCI R2=0.99
Parameter Group PCC rank PCC rank PCC rank
AD.V_gas DO 0.01731 27 0.00757 32 -0.00040 58
thickener.X_under DO 0.00879 38 0.00396 47 -0.08870 6
Vol_aer DO -0.41771 1 -0.50165 1 0.35651 2
AD.khyd_pr ST 0.01463 30 0.00588 36 -0.04839 14
AD.KI_nh3_ac_km_ac ST 0.00667 41 0.00811 29 -0.00100 51
0
water line models sludge line models full reduced
5
Figure 1. Variability box plots of the three BSM2 evaluation criteria for the three
parameter categories separately, altogether (“full”) and with the reduced set of uncertain parameters (“reduced”).
closed loop - full closed loop - reduced
Figure 2. Variability box plots of the three BSM2 evaluation criteria for open loop and
closed loop, with all wastewater and sludge treatment parameters (“full”) and with the reduced set of uncertain parameters (“reduced”).
4. CONCLUSIONS
Given the complexity of the BSM2 and the MC computational load, it is found useful to perform some preliminary numerical solver optimisation by means of solver setting exploration and downsampling of the output file. Proper solver selection could reduce the time required for computation by a factor of 5. This involved the use of the CVODE solver with specific settings for IterationMethod (Newton), LinearMultistepMethod (Adams), LinearSolver (SPGMR) and Accuracy (10-3).
The required number of MC simulations was found to be 50 times the number of parameters to be tested.
treatment parameters are of high importance. The sludge treatment parameters have hardly any significance for the three evaluation criteria. In particular, primary settling parameters are important with respect to the economic performance of the plant.
Based on our results, the output-parameter sensitivity Jacobian can be reduced from 65 to 25 key parameters in case all parameters are considered. When a specific design and operation parameter set has to be evaluated (e.g. to assess the output variability of a control strategy), the number of wastewater and sludge treatment uncertain parameters can be reduced from 38 to 24.
These results make the execution of future sensitivity and uncertainty analysis studies more feasible.
ACKNOWLEDGEMENTS
Lorenzo Benedetti and Ingmar Nopens are post-doctoral researchers of the Special Research Fund (BOF) of Ghent University. Peter A. Vanrolleghem holds the Canadian Research Chair in Water Quality Modelling.
REFERENCES
Batstone, D.J., J. Keller, I. Angelidaki, S.V. Kalyuzhnyi, S.G. Pavlostathis, A. Rozzi, W.T.M. Sanders, H. Siegrist and V.A. Vavilin, Anaerobic digestion model no.1., IWA STR no.13, IWA Publishing, London, UK, 2002.
Batstone, D.J., P.F. Pind and I. Angelidaki, Kinetics of thermophilic, anaerobic oxidation of straight and branched chain butyrate and valerate, Biotechnology and Bioengineering, 84(2), 195-204, 2003.
Batstone, D.J., M. Torrijos, C. Ruiz and J.E. Schmidt, Use of an anaerobic sequencing batch reactor for parameter estimation in modelling of anaerobic digestion, Water
Science and Technology, 50(10), 295-303, 2004.
Benedetti, L., D. Bixio, F. Claeys and P.A Vanrolleghem, Tools to support a model-based methodology for emission/immission and benefit/cost/risk analysis of wastewater treatment systems which considers uncertainties. Environmental Modelling & Software, 23(8), 1082-1091, 2008.
Claeys, F., D. De Pauw, L. Benedetti, I. Nopens, and P.A. Vanrolleghem, Tornado: a versatile efficient modelling & virtual experimentation kernel for water quality systems, iEMSs 2006 Conference, Burlington, VT, 2006a.
Claeys, F., P.A. Vanrolleghem and P. Fritzson, Boosting the efficiency of compound virtual experiments through a priori exploration of the solver setting space, 2006 European Modelling and Simulation Symposium (EMSS), October 4-6, Barcelona, Spain, 2006b.
Copp J.B. (ed.) The COST simulation benchmark: description and simulator manual. Office for Official Publications of the European Community, Luxembourg. 154 pages, 2002.
Hindmarsh, A.C., P.N. Brown, K.E. Grant, S.L. Lee, R. Serban, D.E. Shumaker, and C.S. Woodward. SUNDIALS: suite of nonlinear and differential/algebraic equation solvers,
ACM Transactions on Mathematical Software, 31(3), 363-396, 2005.
Jeppsson, U., M.-N. Pons, I. Nopens, J. Alex, J.B. Copp, K.V. Gernaey, C. Rosen, J.-P. Steyer and P.A. Vanrolleghem, Benchmark simulation model no 2: general protocol and exploratory case studies, Water Science and Technology, 56(8), 67-78, 2007.
Forsythe, G.E., M.A. Malcolm and C.B. Moler, Computer methods for mathematical computations, Englewood Cliffs, NJ Prentice-Hall, 1977.
Henze, H., C.P.L. Jr Grady, W. Gujer, G.v.R. Marais and T. Matsuo, Activated sludge model no.1. IWA STR no.1, IWA Publishing, London, UK, 1987.
Manache, G. and C.S. Melching, Identification of reliable regression- and correlation-based sensitivity measures for importance ranking of water-quality model parameters,
Environmental Modelling & Software, 23(5), 549-562, 2008.
Nopens, I., D. Batstone, J.B. Copp, U. Jeppsson, E. Volcke, J. Alex and P.A. Vanrolleghem, A new interface for ASM-ADM for use in the Benchmark simulation model no.2., Water Research (submitted), 2008.
Otterpohl, R., M. Raak and T. Rolfs, A mathematical model for the efficiency of the primary clarification, IAWQ 17th Biennial International Conference, 24–29 July, Budapest, Hungary, 1994.
Ráduly, B., K.V. Gernaey, A.G. Capodaglio, P.S. Mikkelsen and M. Henze, Artificial neural networks for rapid WWTP performance evaluation: methodology and case study.
Environmental Modelling & Software 22(8), 1208-1216, 2007.
Rousseau, D., F. Verdonck, O. Moerman, R. Carrette, C. Thoeye, J. Meirlaen and P.A. Vanrolleghem, Development of a risk assessment based technique for design/retrofitting of WWTPs. Water Science and Technology 43(7), 287-294, 2001.
Saltelli A., K. Chan and E.M. Scott (eds.), Sensitivity analysis, Wileys series in probability and Statistics, 2000.
Siegrist H., D. Vogt, J. Garcia-Heras and W. Gujer, Mathematical model for meso and thermophilic anaerobic sewage sludge digestion, Environmental Science and
Technology 36, 1113-1123, 2002.