Safety Management in an Oil Company through Failure Mode
Effects and Critical Analysis
Benedictus Rahardjo1*
Abstract: This study attempts to apply Failure Mode Effects and Criticality Analysis (FMECA) to improve the safety of a production system, specifically the production process of an oil company. Since food processing is a worldwide issue and self-management of a food company is more important than relying on government regulations, therefore this study focused on that matter. The initial step of this study is to identify and analyze the criticality of the potential failure modes of the production process. Furthermore, take corrective action to minimize the probability of repeating the same failure mode, followed by a re-analysis of its criticality. The results of corrective actions were compared with those before improvement conditions by testing the significance of the difference using two sample t-test. The final measured result is the Criticality Priority Number (CPN), which refers to the severity category of the failure mode and the probability of occurrence of the same failure mode. The recommended actions proposed by the FMECA significantly reduce the CPN compared with the value before improvement, with increases of 38.46% for the palm olein case study.
Keywords: Failure mode effects and criticality analysis; criticality priority number; severity and occurrence classification; palm olein; potential failure mode and effect.
Introduction
Food processing is a very important worldwide issue. The processing may have either beneficial or detrimental effects on the various properties of food, so each of these factors must be taken into account in the design and preparation of complementary foods. Food quality is frequently associated with food safety. Food safety encompasses a whole series of processes and activities both within and outside the food processing plant that will ensure that the food is free of potential chemical, physical, and biological hazards. Quality within a food processing plant may also be related to the notion of quality control. In this regard, quality control has many objectives within a food processing plant, mainly to maintain the nutritional value of the processed product, to protect customers from the dangers of contaminated food and associated food borne diseases, and to ensure that all food laws and regulations are met.
Recently, the quality assessment of processed food has become an emerging issue. The quality factor has broadened and covers all of the aspects intended
to satisfy consumer expectations. The terms “food quality” and “food safety” mean different things to
different people.
1 Faculty of Engineering, Industrial Engineering Department,
Petra Christian University, Jl. Siwalankerto 121-131 Surabaya 60238, Indonesia. Email: [email protected]
* Corresponding author
Quality has a vast number of meanings and can encompass subjects as diverse as organoleptic characteristic, physical and functional properties, nutrient content, and consumer protection from fraud (Malik, et al. [1]). Safety is more straight-forward, relating to the content of various chemical and microbiological elements in food (Burlingame and Pineiro [2]). Clearly, food quality and safety issues need to be addressed throughout the entire food chain.
Food safety is the responsibility of everyone involved with the food chain from regulators to producers to consumers. A modern food safety system, with the new risk analysis approach has the ability to more finely diagnose the problems and to suggest focused interventions to properly address them.
A number of developing countries are already taking steps to improve and strengthen their systems for food safety management. Several are moving away from the traditional approach focused on end-product control toward a process and science-based approach. Malik, et al. [1] provided one example of science-based activities using risk assessment to support food safety regulations. A science-based approach enhances the ability of food safety regulators to estimate the likelihood and magnitude of the resulting risks and impact on human health.
dangers of contaminated food. One recent case that occurred in Taiwan within the last three years is a food scandal involving edible oils reported by Yage [3]. Regarding to Taiwan‟s olive oil case, South China Morning Post on November, 05th 2013 by Chung [4]
reported that more than 3,000 consumers have applied to join a class-action lawsuit over the adulterated products. This issue is definitely a worldwide problem because it is related to damaging the trust in an entire industry trying to rebuild its reputation. Besides that, the objective of quality control within a food processing plant, to protect customers from the dangers of contaminated food has lost. Further, the effects of the case are not only local, but also spread around the world because of trade and import and export matters.
The objectives of this study are described as follows. (1) Identify and analyze the criticality of the potential failure mode of a system, especially of the production process of palm olein. (2) Take corrective actions to minimize the probability of repeating the same failure mode and to re-analyze its criticality. (3) Compare and test the significance of the difference between the conditions before and after improvement.
The final result is a criticality priority number, which contains a severity category and the probability of occurrence of the failure mode. All of the objectives of this study are met through an application of the industrial engineering tool called Failure Mode Effects and Criticality Analysis
Methods
Failure Mode Effects and Criticality Analysis (FMECA)
The safety analysis tool called Failure Mode Effects and Criticality Analysis (FMECA) is a visibility tool that can easily be understood and used to detect the possible critical points (failures) of the analyzed system. It is useful in design comparison. FMECA follows a bottom-up approach. It breaks down any system (product and/or production process) into its fundamental components to detect all potential failure modes and their effects. Muralidharan [5] explained some major benefits derived from a properly implemented FMEA effort are as follows: (1) It provides a documented method for selecting a design with a high probability of successful operation and safety. (2) A documented uniform method of assessing potential failure mechanisms, failure modes and their impact on system operation, resulting in a list of failure modes ranked according to the seriousness of their system impact and likelihood of occurrence. (3) Early identification of
Single Failure Points (SFPS) and system interface problems, which may be critical to mission success and/or safety. It also provides a method of verifying that switching between redundant elements is not jeopardized by postulated single failures. (4) An effective method for evaluating the effect of proposed changes in the design and/or operational procedures
on the mission‟s success and safety. (5) A basis for in -flight troubleshooting procedures and for locating performance monitoring and fault-detection devices. (6) Criteria for early planning of tests.
FMECA involves two sub-analyses: Failure Mode and Effects Analysis (FMEA) and Criticality Analysis (CA). FMEA is used to identify the main causes of loss of effectiveness or efficiency. Some types of information provided by the FMEA are the critical process and sub-processes as well as their functional identification and the potential failure mode and potential effect of failure for each sub-process. CA is a tool to improve reliability and manage failures based on risk instead of perception. The criticality number technique is used mostly in the chemical industries and some other industries, Braglia [6]. The criticality number calculation is described in US MIL-STD-1629A [7]: Procedures for performing a failure mode, effects and criticality analysis. The procedure consists of determining the failure-effect probability ( ), the failure mode ratio
( ), the part failure rate (λp) and its operating time (t)
and then using these values to compute a failure mode Criticality Number (CN) for each failure mode. The failure mode ratio may be taken from a database source such as Failure Mode/Mechanism Distributions (FMD-91) authored by Chandler, et al. [8]. By identifying the characteristics that make each failure critical, the analysis will also provide valuable information for deciding what actions will reduce the risk for all failures. Bertolini, et al. [9] stated that there is much information can be obtained from an FMECA: (1) The subsystems and final items of the system in a hierarchical arrangement. (2) Any failure or generic malfunctioning, with a list and description of all potential failure modes for the process/product being analyzed. (3) The probability,
severity, and detection ability of each failure mode‟s
occurrence. (4) The criticality analysis, which ranks all failure modes in order of importance.
and Pirelli [12], respectively. There are two approaches to using the RPN method: the quantitative (number) approach and the qualitative (code) approach. In the quantitative approach, the RPN method is based on only three factors: occurrence, severity, and detection. The other approach to using the RPN method, the qualitative approach, utilizes codes instead of the numbers used in the quantitative approach.
There are some drawbacks to using the RPN method. It is based on a simple multiplication of the
factors‟ scores, which is a debatable method. For
example, it is not certain that all designers in every situation want to assign the same importance (weight) to each criterion. This situation may need a subjective assessment. Bowles [13] explained the detection ranking in the RPN approach - a measure of whether subsequent testing will show the failure mode exists rather than whether the failure will be detected when it occurs - should be dropped.
There are some findings related to FMECA. Bertolini, et al. [9] reported an application of the method in a pasta production plant. The results obtained through the application of the proposed method to the specific case study of a durum wheat pasta production process demonstrate that the application of FMECA to the analysis of the internal traceability systems of food processing companies can yield valuable results. A valuable safety analysis tool should be efficiently used to analyze, improve and, if necessary, re-engineer a food product‟s internal traceability system. Braglia [6] noted that if reliable quantitative judgments are available for some criteria, they can easily be included in an Analytic Hierarchy Process (AHP) analysis. This possibility means that Multi-attribute Failure Mode Analysis (MAFMA) can eventually easily be integrated with or replace previously executed FMECA studies.
The extension of FMECA using fuzzy logic was performed by Bowles and Pelaez [14]. Fuzzy logic provides a tool that can be used throughout the design process for performing a criticality analysis on a system design and prioritizing the failures identified in a FMECA for corrective actions. The result allows the prioritization of appropriate actions for correcting or mitigating the effects of a failure. Bowles [13] also included some comments regarding use of the RPN methodology. The fundamental problem is that ordinal scales are used to rank the failure modes in terms of severity, occurrence, and detection, but the scales are treated as if numerical operations on them, most notably multiplication, are meaningful. Bowles [13] stated that if a cost could be associated with each failure effect, the failures could
be placed on a dollar scale (a ratio scale). An
“expected cost” of the failure could be produced by
multiplying the cost of the failure effect by the probability of occurrence of the underlying failure mode. Finally, proposed design changes could then that are determined in criticality analysis portion of the FMECA, are obtained from direct observation on the production floor, measured as accurately as
possible, followed by consulting with company‟s
process engineer regarding the observations. First, the production process of palm olein is described.
Production Process of Palm Olein
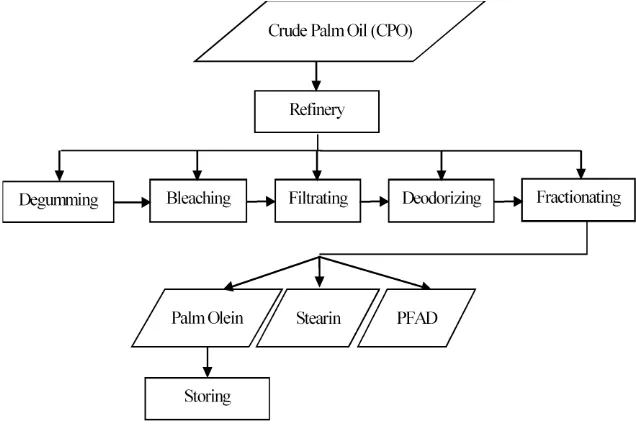
Figure 1 depicts the production process flow of palm olein, starting with Crude Palm Oil (CPO) as the raw material, which goes directly into the refinery process. The additional sub-process in the refinery process, which is fractionating, is performed after the deodorizing process is finished. To be specific, the refinery process consists of the degumming, bleaching, filtrating, deodorizing, and fractionating sub-processes.
palm olein and stearin is that palm olein is the liquid fraction, whereas stearin is the solid fraction. PFAD is made by refining crude palm olein. It is used in many industries such as the soap and animal food industries, and is also used as - a raw material in the bio-diesel and chemical industries. The palm olein continues to the storing process, in which it is placed into bottles and stored away from light and airflow.
FMEA Description
From Fig. 1, which depicts the production process of palm olein, there are many sub-processes, from degumming the Crude Palm Oil (CPO) raw material to fractionating in refinery process. The following discusses the critical processes detected, of which the company should take note. The description of each critical process includes its function, potential failure mode, and the potential effect of the failure.
Among the five sub-processes on refinery process, the following three sub-processes are indicated as having potential failures: bleaching, filtrating, and deodorizing. In the bleaching process, the addition of the chemical has a potential failure mode that leads to an inappropriate amount being used (1.10). If too much chemical is added, it will affect the oil taste, whereas if too little to added, the oil remains red-orange, like CPO, and it should be reprocessed to obtain the appropriate palm olein colour. In the filtrating process, a failure such as the mesh being full of residue (1.20) can occur if there is no schedule to change it. If that happens, it may cause a large amount of oil to be stopped at the mesh, and, of course, it would decrease the CPO yield. The deodorizing material used in the deodorizing process must be of the appropriate amount as was required for the chemical in the bleaching process. Similar to the amount of chemical in the bleaching process, an inappropriate amount of deodorizing material (1.30) may lead to a failure mode of the deodorizing process.
In the storing process, the potential failure mode is that the bottle may be placed carelessly (2.10), not in the right place, so that early oxidation can occurred. If oxidation occurs, it may decrease the shelf life.
CA Description
After determining the critical process in the manufacture of palm olein, the criticality of each potential failure is analyzed. There are two appro-aches for analyzing the criticality of potential failures: the quantitative and qualitative approaches. In the quantitative approach, there are four inde-pendent factors. Those are failure effect probability
( ), failure mode ratio ( ), failure rate (λp), and
operating time (t), are assigned for each potential
failure. The final failure mode (Cm) is obtained by
multiplying those four factors. The failure effect probability will be assigned a total value of 1 for each potential failure mode. In the case of a potential failure having two potential effects, each potential effect will be weighted according to the impact of
failure. Each weight value comes from the analyst‟s
judgment based on the number of complaints from customer to marketing within one year, and is also based on observational data obtained from the process engineer. For example, deodorizing material is not of the appropriate quantity may cause two effects. The first effect is a deterioration of the oil (change of the taste and a decrease of the shelf life), while the second effect is related to the taste of the deodorizing material. Based on historical data recorded by the company, there are a total of 7 records of defects, with 4 complaints from customers can smell the oil odour and 3 from customers having to do with deodorized substance flavour. According to that data for the two effects, the failure effect probability assigned for the first effect is 0.571, and for second effect, it is 0.429, as the sum of the potential failure effects must be 1.
The failure mode ratio has scoring similar to that of the failure effect probability and must also be assigned a total value of 1, but summed over the modes in each process rather than over the effects. The ratio is taken from a standard called Failure Mode/Mechanism Distributions (FMD-91) authored by Chandler, et al. [8]. For example, the refinery process consists of three sub-processes: bleaching, filtrating, and deodorizing. Bleaching itself has potential failure mode chemical substance is not of the appropriate quantity, with failure mode ratio 0.39. Filtrating has potential failure mode mesh is already full of residue, with failure mode ratio 0.22, which value comes from no output of a device in FMD-91 standard. Deodorizing process has similar potential failure mode with bleaching process, that is deodorizing material is not of the appropriate quantity, and its failure mode ratio is 0.39. In total, the sum of the failure mode ratios of all three potential failure modes in the refinery process is equal to 1.
The failure rate should be the most noticeable factor because it is determined by how often a potential failure mode might happen during the process. Failure can be described as waste or defective product. For instance, the potential failure mode of inappropriate deodorizing material quantity has failure rate of 2*10-2 failures per million hours. This
The last factor that determines the final failure mode is the operating time, which represents the time taken for doing the observation to obtain the failure rate. In this case study, the total observation time is 8 hours. Normally, this factor is expressed in seconds, and in this case, it is 28800 seconds. After determining the failure effect probability, failure mode ratio, failure rate, and operating time, these four factors are multiplied together to generate a new value called the final failure mode. In calculating the final failure mode for a failure effect probability that is divided between two effects, first the failure effect probabilities are added up to 1, and then multiplied with the other factors, so the failure mode only has one value for its potential failure mode. For example, the potential failure mode
„deodorizing material is not of the appropriate quantity‟ has a first effect of deterioration of the oil with a failure effect probability of 0.571 and a second
effect on the deodorizing material‟s taste with a
failure effect probability of 0.429; these are first added to give 1, which is then multiplied by the failure mode ratio of 0.39, failure rate of 2*10-2
failures per million hours, and an operating time of 28800 seconds to yield a final failure mode equal to 2.25*10-4. Details of the failure effect probability,
failure mode ratio, failure rate, operating time, and final failure mode of each potential failure mode of the palm olein case study is described in Table 3.
In the qualitative approach, only two factors are assigned to each potential failure mode: the severity and occurrence. These two factors are indicated by the Criticality Priority Number (CPN). The severity description is related to the potential effect of the failure resulting from the potential failure mode of each process, whereas the occurrence description is related to the failure rate, which represents the number of failures expected to occur during the process. The assignment of the severity and
Figure 1. Production process flow of palm olein
Table 1. Severity classification and description
Category Description Definition Conversion
I Catastrophic A failure which may cause total loss of product (threaten the human life) 4
II Critical A failure which may cause severe inefficiency and/or ineffectiveness in the
reconstruction of product (change the taste, decrease the shelf life)
3
III Marginal A failure which may cause minor inefficiency and/or ineffectiveness in the
reconstruction of product (reprocess)
2
IV Minor A failure which may be overcome with an unscheduled measure 1
Table 2 .Occurrence classification and description
Category Description Definition Conversion
A Frequent A high probability of occurrence (equal to or greater than 0.03 of the overall
probability of failure)
5
B Reasonably
common
A moderate probability of occurrence (more than 0.005, but less than 0.03). 4
C Occasional An infrequent probability of occurrence (more than 0.0005, but less than 0.005) 3
D Rare An unlikely probability of occurrence (more than 0.00005, but less than 0.0005) 2
occurrence categories is based on Tables 1 and 2, which have already been adjusted for the oil company case study. After assigning the severity and occurrence categories for each potential failure mode, they are converted to the corresponding CPN minor inefficiency and/or ineffectiveness in the reconstruction of product, and may require time for reprocessing. For the same potential failure mode
„mesh is already full of residue‟ the occurrence
category is C, which indicates an occasional failure with an infrequent probability of occurrence and a failure rate more than 0.0005 but less than 0.005 per million hours. Then, severity category III converts to a CPN of 2, while occurrence category C converts to a CPN of 3, and the average of the two yields a CPN of 2.5.
After obtaining the CPN values for every potential failure mode, they are ranked from smallest to largest CPN to determine which potential failure modes should be prioritized for taking action. The smallest CPN value means the potential failure mode has the least importance, while largest number means the potential failure mode has the most importance. Table 3 shows the priority of each potential failure mode from the most to the least important for the palm olein case study. It provides information regarding which potential failure modes should be prioritized for taking action, with the most
important being „chemical not in appropriate amount‟ and the least important being „mesh is already full of residue.‟
Recommended Actions
This section will discuss some recommended actions for reducing the probability of occurrence of the failure modes explained on FMEA description. The recommended actions have been proposed and
discussed with the company‟s process engineer
because the actions should be applicable to the production process of making palm olein. As example, the potential failure modes „mesh is
already full of residue‟ might be anticipated by
scheduling the appropriate times to replace the mesh and add intermediary process. The Mean Time between Failures (MTBF) and Mean Time to Repair (MTTR) are helpful time calculations as the inputs to find the appropriate interval for replacing the mesh. In the palm olein case study, the MTBF can be calculated as the average time between failures (mesh is full of residue) of a system, while the MTTR represents the average time required by a technician
to repair a failed component or device, that is, to replace the mesh. Besides that, add pressing as intermediary process may decrease the number of oil stopped by the mesh. Therefore, yield of palm olein can also increase. Regarding to those actions effort,
the MTBF and MTTR calculation don‟t need a big
effort, because it could be done by the maintenance department, then apply it on the filtrating process. Meanwhile about the additional pressing process, it should make an investment on new machine and of course, the worker to operate that machine and its maintenance system.
It is proposed that the recommended actions be taken based on the prioritization already made because the highest CPN indicates the potential failure mode that is most likely to have a large effect and that should thus be addressed as soon as possible to prevent it becoming more severe and frequent. The recommended actions that have already been proposed will also be evaluated by assigning the CPN of their corresponding potential failure modes. The CPN is based on the severity and occurrence factors as explained on CA description, which includes the procedure for assigning the severity and occurrence categories and their conversion into CPN values based on Table 1 and 2. There are some reasons for assigning the severity and occurrence categories for the recommended actions. For instance, the potential failure mode
„chemical substance is not of the appropriate
quantity‟ might be anticipated by finding the
appropriate quantity of chemical substance. Design of Experiment (DoE) is one way to deal with that action. This recommended action is assigned a severity category of III and occurrence category of C because chemical substance is very sensitive. It means that a little change of it, then the result will be different in total. Table 3 shows the failure IDs of the potential failure modes and the associated recommended actions followed by the severity and occurrence categories and the CPNs assigned to them.
Comparison of the Process Before and After Improvement
improve-ment. The result of the two-sample t-test is the rejecting the null hypothesis with a P-value of 0.000,
less than -risk (0.05). This result indicates that the mean of the CPN before improvement is significantly greater than mean of the CPN after improvement, or, in the other words, the recommended actions of the proposed improvement result in a significantly lower CPN compared to the value before improve-ment. The result shows there is a lower severity category and probability of repeating the same failure modes.
FMECA and Criticality Matrix
Information regarding the process, sub-processes, descriptions or functions of its processes or sub-processes, potential failure modes, potential effects of
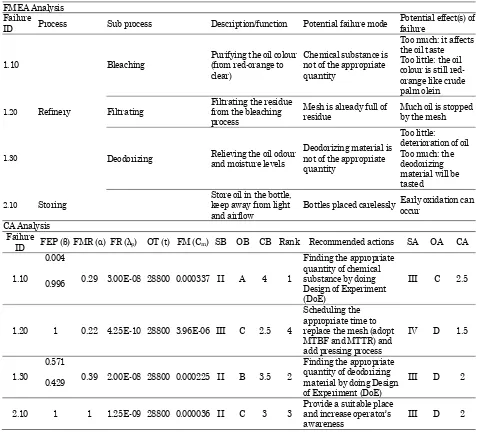
failures, failure IDs, criticality analysis (both the quantitative and qualitative approaches), CPN values and ranks, as well as the recommended actions, the qualitative approach of the criticality analysis and CPN values of the recommended actions are the inputs to the Failure Mode Effects and Criticality Analysis (FMECA). Table 3 is the FMECA of palm olein case study.
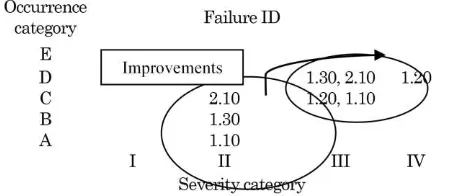
After the FMECA is built, the next step is building the criticality matrix. In this matrix, the criticality analysis with the qualitative approach is the input, which consists of the severity and occurrence categories. The x-axis depicts the severity classifica-tion with four categories (I to IV), and the y-axis depicts the occurrence classification with five cate-gories (A to E). The criticality matrix includes the
Table 3. FMECA on palm olein case study
FMEA Analysis Failure
ID Process Sub process Description/function Potential failure mode
Potential effect(s) of
Mesh is already full of residue
Much oil is stopped by the mesh
1.30 Deodorizing Relieving the oil odour and moisture levels
Deodorizing material is
Store oil in the bottle, keep away from light and airflow
Bottles placed carelessly Early oxidation can occur
failure ID both before improvement (bottom-left) and after improvement (top-right), so it can show the change between the two conditions. Each failure ID, which represents a potential failure mode, will be depicted based on its severity and occurrence categories already determined as in Table 3. The criticality matrix is depicted on Fig. 3.
Conclusion
This study has used a concise and clear methodology for applying the Failure Mode Effects and Criticality Analysis (FMECA) approach to processes of an oil company. This approach begins with direct obser-vation of the production process for palm olein, then maps their process flows. Next, a FMECA is per-formed that describes the details of the critical processes and includes a criticality analysis for each. Recommended actions are proposed to reduce the criticality risk. The recommended actions are eva-luated by performing a criticality analysis after the improvements and comparing the results with those of the analysis performed before the improvements. The recommended actions give significantly better results compare with conditions before the impro-vement. The result is related to a safety improve-ment, which refers to a decreased severity category and probability of occurrence of the same failure mode. The criticality priority number improved by 38.46% (average CPN from 3.25 to 2) for the palm olein case study.
As explained above, this study has succeeded in applying FMECA to an oil company case study. However, FMECA is a tool that can be applied not only to an oil company but also to other another fields, and it could be used before the design stage commences to influence the design and uncover design risks. FMECA can be applied in electricity component design, the food industry, the automotive industry, and even for the daily needs industry related to customer satisfaction.
References
1. Malik, A., Masood, F., and Ahmad, S., Food Processing: Strategies for Quality Assessment, A
Broad Perspective, New York: Springer, 2014.
2. Burlingame, B., and Pineiro, M., The Essential Balance: Risks and Benefits in Food Safety and Quality, Journal of Food Composition and Analysis, 20, 2007, pp. 139-146.
3. Yage, X. New Food Scandals Lead Consumers to
Wonder about “What They Can Eat”. Retrieved
from Asia News website: http://www.asia-news.it/news-en/ on 26th October 2013
4. Chung, L. Concerns Over Food Safety Build in
Taiwan after Scandals. Retrieved from South
China Morning Post website: http://www.scmp. com/news/china/article/1348274/on 05th
Novem-ber 2013.
5. Muralidharan, K. Six Sigma for Organizational Excellence: A Statistical Approach. New Delhi, India: Springer, 2015, pp. 241
6. Braglia, M. MAFMA: Multi-attribute Failure Mode Analysis, International Journal of Quality & Reliability Management, 17(9), 2000, pp. 1017-1033.
7. US Military Standard, MIL-STD-1629A. Proce-dures for Performing a Failure Mode, Effect and
Criticality Analysis, USA: Department of
Defense, 1983
8. Chandler, G., Denson, W., Rossi M., and Wan-ner, R. Failure Mode/Mechanism Distributions. Rome, NY: Reliability Analysis Center, 1991. 9. Bertolini, M., Bevilacqua, M., and Massini, R.
FMECA Approach to Product Traceability in the Food Industry, Food Control, 17(2), 2006, pp. 137-145.
10. Ford. Potential Failure Mode and Effects
Ana-lysis in Design (Design FMECA) and for
Manu-facturing and Assembly Process (Process FMECA)
Instruction Manual. Detroit, MI: Internal Report, 1988.
11. Zanussi. FMEA: Guida All’analisi del Guasto. Italy: Internal Report, 1989.
12. Pirelli. FMEA-FMECA: Analisi Delle Modalita Degli Effetti e Delle Criticita dei Guasti. Milan: Internal Report, 1988
Figure 2. CPN before and after the improvement for the
palm olein case study
13. Bowles, J. B., An Assessment of RPN Priorit-ization in a Failure Modes Effects and Criticality Analysis, Journal of Institute of Environmental Sciences & Technology, 47(1), 2004, pp. 51-56. 14. Bowles, J. B., and Pelaez, C. E. Fuzzy Logic
Prioritization of Failures in a System Failure
Mode, Effects and Criticality Analysis.
Reliabi-lity Engineering and System Safety, 50(2), 1995,
pp. 203-213.
15. Lim, T. K., Palm+ Stearin Medicinal and
Non-medicinal Edible Plants, Dordrecht: Springer,