INDONESIA TOURISM OUTLOOK
2018:
OPPORTUNITIES AND CHALLENGES
Faisal Basri
1 November 2017 http s: // le ad rs hi pf re ak .fi le s. w or dp re ss .c om /2 01 2/ 08 /tu rb ul en t-se as -2 .jp g Theguardian.com pinterest.com planetware.com planetware.com puretravel.com thejakartapost.com indomiliter.comPart I
IMF raises global growth forecasts, gaining
momentum—for now
* Projection.
Sources: IMF, World Economic Outlook April 2014 and October 2017.
2013 2014 2015 2016 2017* 2018*
World GDP growth 3.4 3.4 3.4 3.2 3.6 3.7 Advanced economies 1.4 1.8 2.1 1.7 2.2 2.0 - United States 2.2 2.4 2.6 1.5 2.2 2.3 - Euro area -0.4 0.9 2.0 1.8 2.1 1.9 - Japan 1.6 0.0 1.2 1.0 1.5 0.7 Developing economies 5.0 4.6 4.2 4.3 4.6 4.9 - China 7.7 7.3 6.9 6.7 6.8 6.5 - India 6.9 7.3 7.9 7.1 6.7 7.4 - Asean-5 5.1 4.6 4.8 4.9 5.2 5.2 Indonesia 5.6 5.0 4.8 5.0 5.2 5.3 World trade volume growth 3.3 3.4 2.7 2.4 4.2 4.0 IMF: “…“ the global economic landscape started to shift in the second half of 2016. Developments since last summer indicate somewhat greater growth momentum coming into the new year in a number of important economies.”Turning point?
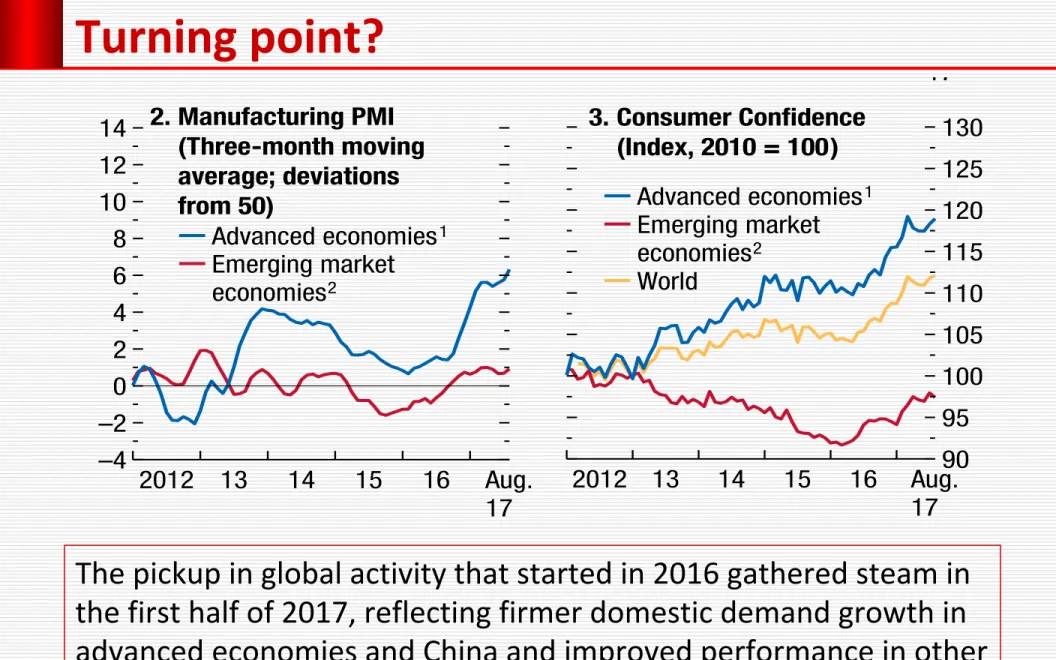
Source: IMF, World Economic Outlook, October 2017.The pickup in global activity that started in 2016 gathered steam in
the first half of 2017, reflecting firmer domestic demand growth in
advanced economies and China and improved performance in other
large emerging market economies.
2WORLD ECONOMIC OUTLOOK: SEEKING SUSTAINABLE GROWTH—SHORT-TERM RECOVERY, LONG-TERM CHALLENGES
International Monetary Fund | October 2017
reforms would help low-income countries—many of which need to undertake durable fiscal adjustment efforts and reduce financial vulnerabilities—make the best use of the coming demographic dividend by spurring job creation.
Recent Developments and Prospects
World Economy Keeping Its Momentum
The pickup in global activity that started in 2016 gathered steam in the first half of 2017, reflecting firmer domestic demand growth in advanced econo-mies and China and improved performance in other large emerging market economies. The continued recovery in global investment spurred stronger man-ufacturing activity (Figures 1.1 and 1.2). World trade growth moderated in the second quarter after expand-ing very briskly in the first. Global purchasexpand-ing manager indices and other high-frequency indicators for July
and August suggest that global growth momentum continued into the third quarter of 2017.
Among advanced economies, domestic demand and output grew faster in the first half of 2017 than in the second half of 2016. In the United States, weakness in consumption in the first quarter turned out to be temporary, while business investment continued to strengthen, partly reflecting a recovery in the energy sector. In the euro area and Japan, stronger private consumption, investment, and external demand
bolstered overall growth momentum in the first half of the year. Growth in most of the other advanced economies, with the notable exception of the United Kingdom, picked up in the first half of 2017 from its pace in the second half of 2016, with both domestic and external demand contributing.
Among emerging market and developing economies, higher domestic demand in China and continued
recovery in key emerging market economies supported growth in the first half of 2017. In India, growth
momentum slowed, reflecting the lingering impact of the authorities’ currency exchange initiative as well as uncertainty related to the midyear introduction of the country-wide Goods and Services Tax. Higher external demand boosted growth in other emerging market
economies in East Asia. In Brazil, strong export perfor-mance and a diminished pace of contraction in domes-tic demand allowed the economy to return to positive growth in the first quarter of 2017, after eight quarters of decline. Mexico maintained growth momentum, despite uncertainty related to the renegotiation of the North American Free Trade Agreement and significant
0 1 2 3 4 2011: H1 13: H1 15: H1 17: H1 18: H2 4. Advanced Economies GDP Growth
(Annualized semiannual percent change)
–4 –2 0 2 4 6 8 10 12 14 2012 13 14 15 16 Aug. 17 –10 –5 0 5 10 15 20 –4 –2 0 2 4 6 8 2011 12 13 14 15 16 Aug. 17
Figure 1.1. Global Activity Indicators
1. World Trade, Industrial Production, and Manufacturing PMI (Three-month moving average; annualized percent change , unless noted otherwise)
Sources: CPB Netherlands Bureau for Economic Policy Analysis; Haver Analytics; Markit Economics; and IMF staff estimates.
Note: CC = consumer confidence; PMI = purchasing managers’ index; WEO =
World Economic Outlook.
1Australia, Canada (PMI only), Czech Republic, Denmark, euro area, Hong Kong SAR
(CC only), Israel, Japan, Korea, New Zealand (PMI only), Norway (CC only),
Singapore (PMI only), Sweden (CC only), Switzerland, Taiwan Province of China, United Kingdom, United States.
2Argentina (CC only), Brazil, China, Colombia (CC only), Hungary, India (PMI only),
Indonesia, Latvia (CC only), Malaysia (PMI only), Mexico (PMI only), Philippines (CC only), Poland, Russia, South Africa, Thailand (CC only), Turkey, Ukraine (CC only).
April 2017 WEO October 2017 WEO
3 4 5 6 7 8 9 2011: H1 13: H1 15: H1 17: H1 18: H2 5. Emerging Market and
Developing Economies 2. Manufacturing PMI (Three-month moving average; deviations from 50) 90 95 100 105 110 115 120 125 130 2012 13 14 15 16 Aug. 17 Advanced economies1 Emerging market economies2
Manufacturing PMI (deviations from 50; right scale) Industrial production 3. Consumer Confidence (Index, 2010 = 100) Advanced economies1 Emerging market economies2 World World trade volumes
Global activity strengthened in the first half of 2017, reflecting firmer domestic demand growth in advanced economies and China and improved performance in other large emerging market economies. Global manufacturing purchasing
Container throughput index reaches new heights
Source: RWI Economic Research Institute 81.4 128.8 70.0 80.0 90.0 100.0 110.0 120.0 130.0 140.0 Seasonally and working day adjusted 2010 = 100Baltic dry index recoved in 2017
Source: tradingeconomics.com The Baltic Dry Index is a composite of three subindices that measure different sizes of dry bulk carriers, or merchant ships: Capesize, Panamax and Supramax. Baltic Exchange Dry Index reached an all time high of 2,330 in December of 2013 and a record low of 290 in February of 2016.Part II
The rise and decline of Indonesian economy:
GDP growth 1961-2017 (%)
6.1 -2.3 1.1 12.0 9.8 6.2 6.0 9.2 1.1 8.5 3.5 9.1 8.4 -13.1 5.7 6.3 4.6 6.4 5.0 4.9 5.0 5.0 1961 1962 1963 1964 1965 1966 1967 1968 1969 1970 1971 1972 1973 1974 1975 1976 1977 1978 1979 1980 1981 1982 1983 1984 1985 1986 1987 1988 1989 1990 1991 1992 1993 1994 1995 1996 1997 1998 1999 2000 2001 2002 2003 2004 2005 2006 2007 2008 2009 2010 2011 2012 2013 2014 2015 2016 2017 * The fall of Old Order Pertamina crisis Oil price collapse
Economic crisis and the end of New
Order/Soeharto era Global financial crisis Trendline-polynomial * First semester. Source: BPS-Statistics Indonesia.
The declining trend of economic growth in
the long-term, 1976-2017*
* First semester. Source: BPS-Statistics Indonesia. -15 -14 -13 -12 -11 -10 -9 -8 -7 -6 -5 -4 -3 -2 -1 0 1 2 3 4 5 6 7 8 9 10 11 12 76 77 78 79 80 81 82 83 84 85 86 87 88 89 90 91 92 93 94 95 96 97 98 99 2000 1 2 3 4 5 6 7 8 9 10 11 12 13 14 15 16 2017* GDP growth, year-on-year, percent 8 8% 7% 6% 5%Toward a lower level of equilibrium, from 6%
to 5%
* First semester. Source: BPS-Statistics Indonesia. 3 4 5 6 7 2010 2011 2012 2013 2014 2015 2016 2017* 6.22 6.17 6.03 5.56 5.01 4.88 5.02 5.01 GDP growth, year-on-yer, percent 6% 5%Setting off from a point where neighboring
countries started their journey too (1)
Source: World Bank, World Development Indicators online, downloaded on August 31, 2017.
8,260 8,840 3,400 27,600 9,850 5,640 0 5,000 10,000 15,000 20,000 25,000 30,000 1969 1970 1971 1972 1973 1974 1975 1976 1977 1978 1979 1980 1981 1982 1983 1984 1985 1986 1987 1988 1989 1990 1991 1992 1993 1994 1995 1996 1997 1998 1999 2000 2001 2002 2003 2004 2005 2006 2007 2008 2009 2010 2011 2012 2013 2014 2015 2016 Gross national income (GNI) per capita, Atlas method, current US$)
Economic growth by island: Kalimantan and
Sumetera suffered the most
2015 : 3.5% 2016 : 4.3% 2017*: 4.1% Share : 21.7% 2015 : 1.3% 2016 : 2.% 2017*: 4.4% Share: 8.2% 2015 : 8.2% 2016 : 7.4% 2017*: 6.5% Share : 6.1% 2015 : 5.5% 2016 : 5.6% 2017*: 5.4% Share : 58.7% 2015 : 10.3% 2016 : 5.9% 2017*: 3.1% Share : 3.1% 2015 : 6.6% 2016 : 7.5% 2017*: 4.5% Share: 2.3% * First semester. Source: BPS-Statistics Indonesia.
GDP growth by sector
* First semester; excluding taxes minus subsidies. Source: BPS-Statistics Indonesia. Sectors 2012 2013 2014 2015 2016 Q1-17 Q2-17 2017* Share Agriculture, forestry & fishery 4.59 4.20 4.24 3.77 3.25 7.12 3.33 13.76 Mining and Quarrying 3.02 2.53 0.43 -3.42 1.06 -0.64 2.24 7.65 Manufacturing industry 5.62 4.37 4.64 4.33 4.29 4.24 3.54 20.37 Electricity and gas 10.06 5.23 5.90 0.90 5.39 1.60 -2.53 1.19 Water, waste management, cesspit and recycling 3.34 3.32 5.24 7.07 3.60 4.39 3.67 0.07 Construction 6.56 6.11 6.97 6.36 5.22 5.95 6.96 10.17 Wholesale & retail trade, cars & motorcycles reparations 5.40 4.81 5.18 2.59 3.93 4.96 3.78 13.13 Transportation and warehousing 7.11 6.97 7.36 6.68 7.74 8.03 8.37 5.24 Accommodation, food and beverages 6.64 6.80 5.77 4.31 4.94 4.68 5.07 2.87 Information and communication 12.28 10.39 10.12 9.69 8.87 9.13 10.88 3.81 Finance and insurance 9.54 8.76 4.68 8.59 8.90 5.99 5.94 4.25 Real estate 7.41 6.54 5.00 4.11 4.30 3.67 3.86 2.82 Business services 7.44 7.91 9.81 7.69 7.36 6.80 8.14 1.75 Public adm., defense, and compulsory social security 2.13 2.56 2.38 4.63 3.19 0.22 -0.03 3.59 Education 8.22 7.44 5.47 7.33 3.84 4.09 0.90 3.18 Health and social activities 7.97 7.96 7.96 6.68 5.00 7.10 6.40 1.07 Other services 5.76 6.40 8.93 8.08 7.80 8.01 8.63 1.76 Gross domestic product 6.03 5.56 5.01 4.88 5.02 5.01 5.01 100.00
Pertumbuhan nilai tambah sektor transportasi
dan hospitality pun meningkat relatif tinggi
Q1-2017 Q2-2017 Transportation and warehousing 8.03 8.37 Railways transpot 12.30 18.03 Land transport 7.70 8.04 Sea transport 0.85 3.07 River, lake, and ferry transport 7.51 6.57 Air transport 13.23 11.92 Warehousing and support services for transportation, postal & courier 7.29 7.96 Accomodation, food and beverages 4.68 5.07 Accomodation 4.70 4.84 Food and beverages 4.68 5.13 year on year, percent Source: BPS-Statistics Indonesia.
Transportasi penumpang pun naik cukup tinggi
Source: BPS-Statistics Indonesia.Penumpang angkutan udara domestik
10.22
Penumpang angkutan udara internasional
13.54
Penumpang angkutan laut domestik
3.62
Barang angkutan domestik
1.69
Penumpang angkutan kereta api
8.53
Barang angkutan kereta api
18.32
Pertumbuhan angkutan penumpang dan barang Semester I 2017, persenGrowth of tourism components
Source: BPS-Statistics Indonesia.
Percent
Air transport Accommodation Railway transport Restaurant Hospitality
2011 14.65 11.24 -3.23 5.91 6.86 2012 7.09 9.51 -4.19 5.99 6.64 2013 4.75 9.48 6.14 6.16 6.80 2014 6.07 7.81 20.81 5.27 5.77 2015 9.44 5.67 4.45 3.97 4.31 2016 13.28 5.32 3.46 4.84 4.94 2017-Q1 13.23 4.70 12.3 4.68 4.68 2017-Q2 11.92 4.84 18.03 5.13 5.07
Share of tourism components to GDP
Source: BPS-Statistics Indonesia.
Percent
Air transport Accommodation Railway transport Restaurant Hospitality
2010 0.56 0.52 0.03 2.40 2.92 2011 0.60 0.52 0.03 2.34 2.86 2012 0.72 0.59 0.03 2.34 2.93 2013 0.81 0.67 0.03 2.37 3.03 2014 1.03 0.70 0.04 2.34 3.04 2015 1.24 0.70 0.06 2.26 2.96 2016 1.42 0.69 0.06 2.23 2.92 2017-Q1 1.46 0.69 0.06 2.22 2.90 2017-Q2 1.53 0.67 0.06 2.16 2.83
New primadona: tourism?
* January-September Source: BPS-Statistics Indonesia International visitors arrivals to Indonesia by port of entry Growth January-September 2017 (yoy) = 25.05% Port of Entry 2014 2015 2016 2017* Ngurah Rai 3,731,735 3,936,066 4,885,062 4,529,352 Soekarno-Hatta 2,246,437 2,368,628 2,603,195 1,937,764 Batam 1,454,110 1,585,719 1,510,203 1,080,437 Tanjung Uban 320,861 305,471 308,964 261,359 Juanda 217,193 204,200 231,455 173,647 Kualanamu 234,724 201,447 211,942 169,332 Husein Sastranegara 180,392 159,811 183,542 118,747 Adi Sucipto 89,156 82,126 114,639 105,487 Lombok 69,881 70,248 91,102 94,677 Tanjung Pinang 97,672 91,341 93,924 81,929 Tanjung Balai Karimun 100,782 97.32.00 91,811 61,238 Top-11 8,742,943 9,102,377 10,325,839 8,613,969 Others 692,468 1,128,398 1,193,436 1,844,330 Total 9,435,411 10,230,775 11,519,275 10,458,299Mostly from Asia-Pacific
* January-June Source: BPS-Statistics Indonesia International visitors arrivals to Indonesia by nationality Nationality 2014 2015 2016 China 1,052,705 1,249,091 1,556,771 Malaysia 1,418,256 1,431,728 1,541,197 Singapore 1,559,044 1,594,102 1,515,701 Australia 1,145,576 1,090,025 1,302,292 Japan 505,175 528,606 545,392 India 267,082 306,960 422,045 Korea 352,004 375,586 386,789 United States 246,397 269,062 316,782 Philippines 248,182 267,700 298,910 France 208,357 208,679 256,229 Taiwan 220,328 223,478 252,849 Top-11 7,223,106 7,545,017 8,394,957 Others 2,122,305 2,685,758 3,124,318 Total 9,345,411 10,230,775 11,519,275Travel: inbound and outbound
* First semester Source: Bank Indonesia.§
Angka versi Bank Indonesia yang
tercantum dalam neraca
pembayaran (balance of
payments) lebih rendah
ketimbang versi BPS (perbedaan
metode pencatatan?)
§
Pertumbuhan inbound lebih cepat
ketimbang outbound. Pada
2018-2019 boleh jadi
pertumbuhan outbound lebih
tinggi
§
Diversifikasi tujuan wisata dan peningkatan daya tariknya sangat
penting untuk meredam peningkatan outbound
§
Kemacetan yang kian parah di kota-kota besar mendorong
wisatawan domestik mengunjungi wisata “senyap”
Inbound Outbound Net
2010 7,118 6,454 664 2011 7,743 6,971 772 2012 8,107 7,636 471 2013 8,861 8,253 608 2014 9,488 8,242 1,246 2015 9,794 8,345 1,449 2016 10,860 8,509 2,351 2017* 5,898 4,499 1,399 Thousands travelers
Travel: exports and imports
Exports Imports Net
2010 6,958 -6,395 563 2011 7,997 -6,255 1,741 2012 8,324 -6,771 1,553 2013 9,119 -7,675 1,444 2014 10,261 -7,682 2,579 2015 10,761 -7,292 3,469 2016 11,238 -7,549 3,688 2017* 5,961 -3,727 2,233 Millions of USD