M – 24
under the law of maturity has been reached earlier. Based on data from the ILO, there were four million child labors in Indonesia in 2002. Jakarta as the capital city of Indonesia has a high economic growth in 2010 by reaching 6.51 percent (LKPJ 2010). Behind that growth, Jakarta has a problem of high number of child workers as well, which is about 93 571 children in 2010.Some researchers often use regression analysis to determine the description of the factors that contribute to a response variable. Regression analysis has several assumptions that must be met, while research in the social subjects often violates those assumptions. To overcome this limitation required nonparametric method that is not tied to the assumption. One method is non-parametric regression Multivariate Adaptive Regression Spline (MARS). MARS method is an approach for nonparametric regression model that can accommodate multicollinearity in the model.
This study uses secondary data drawn from SUSENAS in 2013 in DKI Jakarta. Response variable used is the status of work in children aged 10-17 years, while the predictor variables are fifteen variables that represent the characteristics of children and household. Based on the results of processing with MARS, obtained models are affected by Status of Child’s Education, Child’s Education, Child Live with Parent, Education of Head of Household, and etc. Key words: child labor, MARS, SUSENAS, Jakarta
INTRODUCTION
Children are very precious wealth, either as themselves or as a human resources will determine the future of the nation. The parents and the government has an obligation to ensure that every child gets right is to grow healthy, getting access to proper education, and protection of all hazardous situations for them. Countries in the world including Indonesia seeks to protect children by releasing some legislation to ensure the rights of the child are met.
Enforcement of the legislation was not fully running properly because there are quite a lot of
factors, factors household, and community factors. One of the conclusions of these studies are poverty is closely linked to child labor. Syahruddin (2004) also investigated on child labor in the eastern part of Indonesia. Characteristics of the household head such as age, occupation, education and health status into several variables that affect households with child labor.
Some regression and classification methods have been used by researchers to identify the factors that cause children to become child laborers. Response variables in the study are Categoricalal or binary as working or not working. The method of analysis in accordance with the response variable is binary logistic regression, Multivariate Adaptive Regression Spline (MARS) and classification methods such as CART, Decision Trees, Support Vector Machine (SVM), Random Forest (RF), and others.
MARS is a nonparametric method developed by Friedman (1991) to solve the problem of parametric regression with the main objective to predict the value of the variable response of one or several explanatory variables. Besides being able to accommodate multicollinearity in the model, MARS is also good to use when the predictor variables used are numerous and the data used is not linear (Munoz and Felicimo, 2004). MARS sorting the data into sections with each regression equation. This makes MARS frequently used high-dimensional data. MARS can be used as a classification method that is used when the response variable is Categoricalal. Gunawan Chess Prasetyo (2009), Jalaluddin Mohammad (2009), and Munoz and Felicisimo (2004) gives the same conclusion that MARS is better than some models such as logistic regression analysis and CART. For it, in this study will be carried out classification characteristics of child labor using MARS method.
RESEARCH METHOD
Method and Material
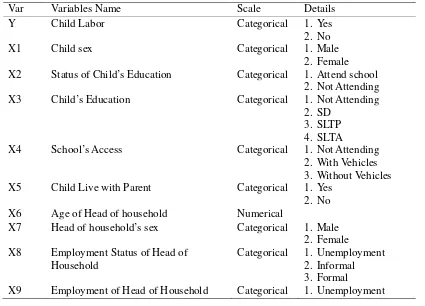
The data will be used in this research is the National Socioeconomic Survey Data (SUSENAS) In DKI Jakarta 2013. Details of the variables used in this study are as follows:
Tabel 1. Research Variables
Var Variables Name Scale Details
Y Child Labor Categorical 1. Yes
2. No
X1 Child sex Categorical 1. Male
2. Female X2 Status of Child’s Education Categorical 1. Attend school
2. Not Attending X3 Child’s Education Categorical 1. Not Attending
2. SD 3. SLTP 4. SLTA
X4 School’s Access Categorical 1. Not Attending 2. With Vehicles 3. Without Vehicles X5 Child Live with Parent Categorical 1. Yes
2. No X6 Age of Head of household Numerical
2. Primary 3. Secondary 4. Tertiary X10 Education of Head of Household Categorical 1. Not attending
2. SLTA 3. College
X11 Health Status of Head of Household Categorical 1. Health complaints 2. No Complaints X12 Marital Status of head of household Categorical 1. Not Married
2. Married X13 Number of Household Member Numerical
X14 Member of Household that Works Categorical 1. Yes 2. No X15 Rank of Expenditure Categorical Rank 1 - 3
Stages of the analysis conducted in this study are: 1. Prepare the data
2. Split the data into 80% data training and 20 % data testing 3. Analyze MARS using data training
4. Determine the maximum number of basis functions, the level of interaction variables, and the minimum number of observations per knot
5. Establish a model based on a combination of the above three points and get the value of GCV
6. Compare each model that the value of the smallest GCV is the best model 7. Use the best model for prediction and compare with data testing
8. Build confusion matrix and get the value of Sensitivity and Specificity
Some of the tools used in this study, namely R with package Earth and Caret, MS Excel, and IBM SPSS 22
Methodology Child Labor
BPS defines a child is child labor when it meets the following criteria:
1. All children aged 5-12 years who work, regardless of their working hours. This definition is consistent with the regulations set a minimum age for employment is 13 years.
2. Children aged 13-14 years who work more than 15 hours per week. Regulations allow children in this age group engaged in light work.
3. Children who work aged 15-17 years who work more than 40 hours per week.
Multivariate Adaptive Regression Spline especially when the function is continuous. The other drawback is difficult to estimate the RPR simple linear function or additives.
Friedman made modifications to the model PR and MARS model is obtained which can be written as follows
And MARS basis functions can be expressed as follows
( ) = ( . ( ( , ) − ) ) (2)
Where: = constant, = base parent function, M = sum of basis function, Km= degree of
interaction, = value ± 1, ( , )= independent variable, = knots value of variabel
( , )
Another form of equation (2) is
= + ∗ + ∗ + ⋯+ ∗ (3)
Where = response variable, B0 = constanta, B1, B2,.,Bk = spline basis function coefficients
1,2,...,k , dan BF1, BF2,.,BFk = basis function 1,2,...k
Selection of the best models in the MARS using stepwise method. There are two methods, namely forward stepwise stepwise and backward stepwise. Forward stepwise done to get the maximum number of basis functions to minimize the average sum of square residuals (ASR). While backward stepwise conducted to determine the proper function of the base by removing the base functionality that small contribution to the prediction of the response. This method is done by minimizing the value of Generalized Cross Validation (GCV). The smaller the value of a variable GCV, the more important the variable. GCV is the following equation where the numerator is the average number of errors, and the denominator is the function of a complex value
( ) =
1
∑ − ( )
1− ( ) (4)
Where N = sum of observation, M= sum of basis function of MARS, C(M)= Trace [B(B’B) -1
B’]+1 is the number of parameters to be estimated, B =basis function, ( ) = C(M) + d.M,
best value of d are in interval 2-4
Classification by MARS based approach to logistic regression analysis. The classification is to look at the level of accuracy in grouping the data according to the group. Binary response variable Y (0 and 1), it can use the following probability model
( = 1| = ) = ( ) =
( )
1 + ( ) (5)
The function of the probability model above can be searched by using nonparametric methods such as MARS (Friedman, 1991). Selection of basis functions performed by using the squared residual based loss criterion, and the coefficients of the basis functions for the best model estimated by logistic regression approach to the collection of the base (Friedman, 1991). Transformation of the above models can be written as follows
ln ( )
RESULT
MARS model is formed by performing simulations with the following parameter settings 1. 30, 45 and 60 the number of basis functions
2. Zero until three levels of interaction between variables. 3. Zero to 10 observations per knot
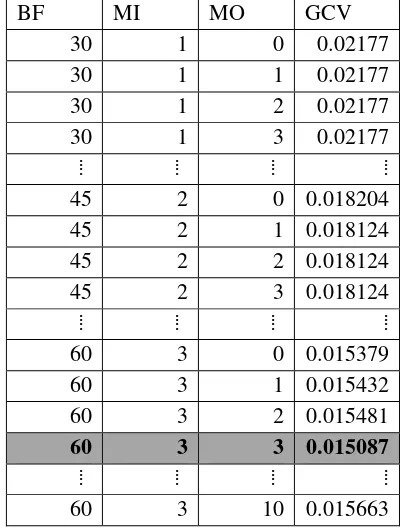
Selection of the best MARS models based on the value of the minimum GCV most models. From the above simulation, parameter MARS model is best achieved by 60 the number of basis functions, three levels of interaction and a minimum of three observations each knots.
Table 2. Simulation results of MARS Model Best Selection
BF MI MO GCV
30 1 0 0.02177
30 1 1 0.02177
30 1 2 0.02177
30 1 3 0.02177
⁞ ⁞ ⁞ ⁞ 45 2 0 0.018204 45 2 1 0.018124 45 2 2 0.018124 45 2 3 0.018124 ⁞ ⁞ ⁞ ⁞
60 3 0 0.015379 60 3 1 0.015432 60 3 2 0.015481 60 3 3 0.015087 ⁞ ⁞ ⁞ ⁞
60 3 10 0.015663
The resulting minimum GCV value is 0.015. Of the 16 variables used in the model, only eight variables that affect the model. Variables that influence based on the value of the minimum GCV is as follows
Tabel 3. Importance Variables that enters model Variables Nsubset GCV (%) RSS (%)
X2 = 2 30 100 100
X5 = 2 29 56 58.5
X10 = 3 29 56 58.5
X15 = 3 29 56 58.5
X10 = 2 28 49 52
X3 = 3 26 35 39.4
X9 = 3 26 35 39.4
X8 = 2 25 30.9 35.8
X13 24 27.9 33.2
X1 = 2 12 15.1 19.8
X4 = 2 9 11.4 16
X4 = 3 4 4.9 9
MARS models obtained are as follows
Y = 0.251 - 0.247 * BF1 - 0.286 * BF2 + 0.0381 * BF3 + 0.292 * BF4 + ... + 0.104 * BF27 - 0.686 * BF28 + 2.02 * BF29 - 1.01 * BF30
BF is the base function where each BF contains its own function. The model above is not written entirely due to the number of functions that pretty much. Interpretation of the MARS models using logit function is using odds ratios. Some interpretations of the above models are below:
1. Coefficient BF6 = - 0.792 * X52 * X93. A child who lives with his parents and KRT have a tendency not to work twice as large as not working children than a child who does not live with his parents and KRT not work
2. Coefficient BF16 = 0.842 * X33 * X52 * X93. A junior high school and do not live with their parents and KRT work in the secondary sector are more likely to two times more likely than children in child labor schools are not living with parents where KRT not work 3. Coefficient BF19 = -1.12 * X52 * X82 * X103. A child who lives with parents where KRT
does not work and never went to school or primary school has three times greater tendency not working children than a child who does not live with their parents where KRT work in the informal sector and education above high school
4. Coefficient BF22 = - 2.09 * X22 * X52 * max(0,X13-9). A child who is in school and live with their parents and the number of ART under 9 have a tendency to eight times more likely not working children than children who do not attend school and did not live with his parents where the number of ART more than nine
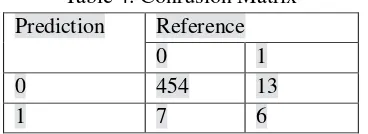
5. Coefficient BF29 = 2.02 * X52 * h(X13-9). A child who does not live with their parents and the number of ART is more than nine tend to be seven times more likely to become child laborers than children who live with their parents and the number of ART under nine The best model above will be calculated values are compared with the predictions and testing the data to produce a confusion matrix as shown in the table below
Table 4. Confusion Matrix Prediction Reference
0 1
0 454 13
1 7 6
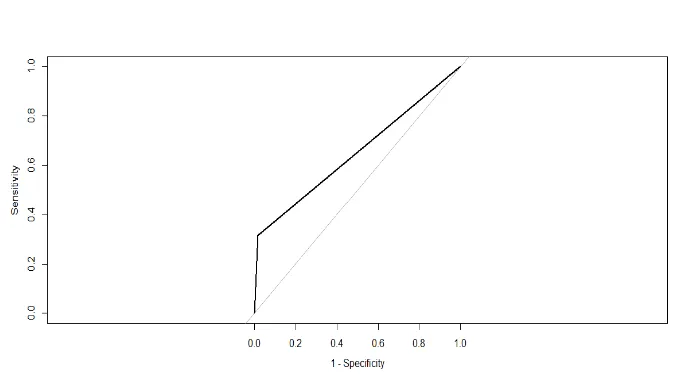
Figure 1. Plot ROC of Mars Model DISCUSSION
The proportion between child labor and child labor is not far enough at 96% is not child labor and 4% is child labors. Inequality is enough to affect the results of this analysis proved the prediction accuracy of a child is a child labor (sensitivity) is 31.5%. This disparity in data mining called imbalanced data.
Future studies are expected to focus addressing issues of imbalanced data before analysis. One of handling imbalanced data is to SMOTE (Synthetic Minority Oversampling Technique) which is a sampling technique to create synthetic data is the data minority groups. Synthetic data generation aims to balance class analysis of data.
CONCLUSION AND SUGGESTION
From this research of modelling child labor using MARS, it can be concluded and recommended some point as follows:
1. Simulation of the best MARS model search has produced the best model with a minimum GCV. The best model parameter is the number of basis functions 60, three levels of interaction and a minimum of three observations each knots.
2. The accuracy of the best models produced very high at around 95% but the accuracy of the data class is very small child labor yatu 31.5%
3. Inequality proportion in class affect the response variable data analysis 4. Further research is expected to make the handling of the data imbalanced
5. Further enumeration of child labor data collection should be more comprehensive and thorough covers children aged 5-17 years
REFERENCES
Badan Pusat Statistik. (2012). Profil Anak Indonesia 2012. Jakarta: Kementrian Pemberdayaan Perempuan dan Perlindungan Anak.
Badan Pusat Statistik. (2013). Profil Anak Indonesia 2013. Jakarta: Kementrian Pemberdayaan Perempuan dan Perlindungan Anak.
Darusasi , R., & Pitoyo, A. J. (2013). Kondisi Demografi dan Sosial Ekonomi Rumah Tangga Pekerja Anak DKI Jakarta (Analisis Data Susenas KOR 2010). Jurnal Bumi Indonesia, II, 1.
Statistics, 19(1), 1-67. Retrieved from http://www.jstor.org/stable/2241837
Hastie, T., Tibshirani, R., & Friedman, J. H. (2008). The Elements of Statistocal Learning: Data Mining, Inference, and Prediction. California, USA: Springer.
Hugo, B., & Verner, D. (2001). Revisiting The Link Between of Economics, Poverty and Child Labour The Ghanaian Experience. CLS Working Paper, 01-03.
Jalaluddin, M. (2009). Pemodelan Partisipasi Anak Dalam Kegiatan Ekonomi di Sumatera Barat Menggunakan Regresi Logistik dan MARS. Thesis. Surabaya, Indonesia: Institut Teknologi Sepuluh November.
Munoz, J., & Felicisimo, A. (2004). Comparison of Statistical Methods Commonly Used In Predictive Modelling. Journal of Vegetation Science, XV, 285-292.