COMPARISON OF KRIGING AND INVERSE
DISTANCE WEIGHTED (IDW) INTERPOLATION
METHODS IN LINEAMENT EXTRACTION AND
ANALYSIS
Agung Setianto∗1and Tamia Triandini2
1Geological Engineering Department, Faculty of Engineering, Universitas Gadjah Mada, Yogyakarta, Indonesia 2Civil and Environmental Engineering, Ehime University, Matsuyama, Japan
Abstract
Analysis that is based on geostatistics eliminates many corresponding defects and limitations com-pared to classical statistics which have been devel-oped by random distribution theory of processes and variables. Interpolation is important for local analy-sis by GIS, because many maps used for GIS opera-tion are made by interpolaopera-tion. In this research, two different methods which is Kriging method and In-verse Distance Weighted (IDW) method was exam-ined for developing Digital Elevation Model image. Each method’s advantages and disadvantages were considered.
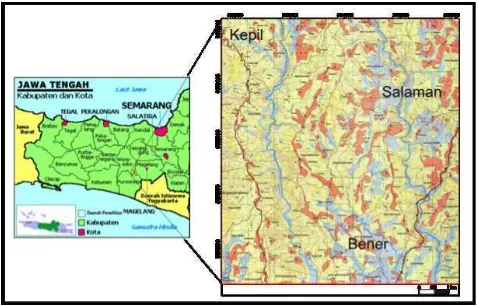
The study are, Kepil, is within Kulon Progo phys-iographic and stratigraphic area, located in the west-ern part of Yogyakarta city. This area is located close to the Java Island Subduction Zone, hence influ-ence of tectonic plate movement is relatively dom-inant. Geological structures become a main factor that shapes the recent morphology. This study area also has many settlements and has high weathering and erosion rate.
Lineaments are extracted based on Digital Eleva-tion Model to provide assistance in delineating ge-ological structures. The structural geology analy-sis and an understanding of tectonic phase of the area provide useful information for geological
map-∗Corresponding author: A. SETIANTO, Geological
Engineering Department, Faculty of Engineering, Uni-versitas Gadjah Mada. Jl. Grafika No 2, Bulak-sumur, Yogyakarta 55281, Yogyakarta, Indonesia. E-mail: [email protected]
ping. Accuracy of lineament depends on extraction and imagery parameters used. In this study, the ex-traction was conducted by two different raster meth-ods, namely Kriging and Inverse Distance Weighted (IDW) with the same resolution of 30 meters. Lin-eament extracted automatically (digitally) with cer-tain parameter settings.
Keywords:Kriging, inverse distance weighted,
in-terpolation, lineament, random distribution, digital elevation model.
1 Introduction
Lineament analysis is performed by using Dig-ital Elevation Model (DEM) data. DEM con-tains elevation and slope information that made interpretation easier. In Indonesia, the rate of weathering and erosion rate makes field map-ping of geological structures becomes difficult without the aid of satellite imagery mapping. DEM is basically a numerical representation of topography that is usually stored in equalized grid cells, each with a value of elevation. Its simple data structure and widespread availabil-ity has made it a popular tool for land character-ization. Because topography is a key parame-ter in controlling the function of natural ecosys-tems, DEMs are highly useful to deal with ever-increasing environmental issues.
thermore, this lineament analysis is intended to be able to analyze geological structures in some area which contains many eroded or mod-ified structures. Geological structures may have large dimensions that is not apparent in the field. In addition, the civil settlement obscure some parts of the strucures in the field. Simple identifications can be performed by using satel-lite imagery, and there are more than one raster available to use. Comparing two or more raster will make identification easier.
Study area
The study area (Figure 1) is within Kulon Progo Hills physiographic and stratigraphic zone. This area is located close to Java Island subduc-tion zone, hence the influence of tectonic plate movement is relatively dominant. Geological structures become a main factor that shapes the recent morphology. The study to analyze the forces that comprise them becomes important. Hills in the study area are formed due to the in-fluence of deformation force. This deformation takes place in several stages; its manifestation that can be observed in present circumstances is a mixture of all phases that has ever been happened.
This area has been studied earlier by Bemme-len (1949) who argued that Kulonprogo experi-enced three tectonic phases: the first phase was Ijo, Gajah, and Menoreh Volcano formation; the second phase was a transgression event that formed Jonggrangan and Sentolo Forma-tion; and third phase was lifting that produce morphological Kulonprogo recent time. Pu-lunggono et al. (1994) argued that Java Is-land was formed by three main structural pat-terns: Meratus pattern trending NE-SW
(Pale-Figure 1: Study area.
ocene), Sunda pattern trending N-S (Eocene-Late Oligocene), and Java pattern trending W-E (Late Oligocene-W-Earlier Miocene). By using Landsat-7 ETM+ and panchromatic aerial pho-tographs, Sudrajatet al. (2010) argued that Ku-lonprogo Hills and surroundings had trends in three different phases starting from oldest to youngest were NE-SW, NNW-SSE, and E-W.
This study of lineament analysis compares two interpolation methods to improve the re-sults obtained from lineament extraction using automatic (digital) and manual correction. The interpolation methods are Kriging and IDW.
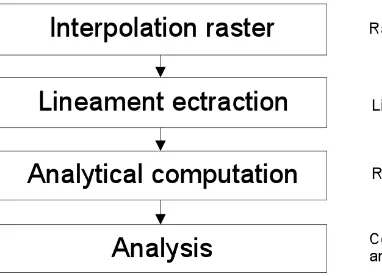
2 Methodology
The aim of this study is to investigate the differ-ences in the automation of lineament analysis between Kriging and IDW interpolation meth-ods. Analysis is based on DEM data. The methodology used in this study is shown in Fig-ure 2.
2.1 Interpolation method
Figure 2: The major methodology of lineament analysis.
especially if the data is acquired directly into regular grid (DEM). But interpolation of data sources to produce DEM is necessary if the data sources themselves do not predict treated land-scape phenomena.
Interpolation techniques are based on the principles of spatial autocorrelation which as-sumes that objects close together are more sim-ilar than objects far apart. On the edges of the interpolated area, extrapolation is also rea-sonable. Unfortunately, no interpolation tech-nique is universal for all data sources, geo-morphologic phenomenon, or purposes. We should be aware that in the praxis, different in-terpolation methods and inin-terpolation param-eters on the same data sources lead to differ-ent results. The best chosen algorithms on fair data sources should not differentiate much from nominal ground, that is idealization of our desired model and which is commonly simi-lar to actual Earth’s surface. Divergences be-tween results of interpolation and from nomi-nal ground are especially consequences of the following circumstances:
1. Available data sources do not approximate terrain (distribution, density, accuracy, etc. of the sources is not appropriate),
2. Selected interpolation algorithm is is not enough robust on the employed data sources,
3. Chosen interpolation algorithms or data structure are not suitable for selected ter-rain geomorphology or application,
4. Perception or interpretation of Earth’s sur-face (better: nominal ground) is not the
same when more DEM operators work on the same problem; operator’s own imagi-nation is common and reasonable problem in DEM production.
Application requirements play important role to expected characteristics of the DEM. For ex-ample, we need high geomorphologic quality of DEM for regional-small scale analysis and for calculating average altitudes, although geo-morphologic accuracy is more sensitive for vis-ibility analysis and even more for analysis that uses algorithms based on derivates like slope, aspect, cost surface, drainage, path simulation, etc.
2.2 Ordinary Kriging (K)
Ordinary Kriging is one of the most basic of Kriging methods. It provides an estimate at an unobserved location of variable z, based on the weighted average of adjacent observed sites within a given area. The theory is derived from that of regionalized variables (Deutsch and Journel, 1998) and can be briefly described by considering an intrinsic random function de-noted by z(si), where si represents all sample
locations, i = 1, 2, . . . , n. An estimate of the weighted average given by the ordinary Krig-ing predictor at an unsampled site z(s0)is
de-where, lare the weights assigned to each of
A = A matrix of semi ariances between the data points.
b = A vector of estimated semivariances be-tween the data points and the points at which the variable z is to be predicted.
c = The resulting weights.
2.3 Inverse Distance Weighting (IDW)
All interpolation methods have been developed based on the theory that points closer to each other have more correlations and similarities than those farther. In IDW method, it is as-sumed substantially that the rate of correlations and similarities between neighbors is propor-tional to the distance between them that can be defined as a distance reverse function of ev-ery point from neighboring points. It is neces-sary to remember that the definition of neigh-boring radius and the related power to the dis-tance reverse function are considered as impor-tant problems in this method. This method will be used by a state in which there are enough sample points (at least 14 points) with a suitable dispersion in local scale levels. The main factor affecting the accuracy of inverse distance inter-polator is the value of the power parameter p (Burrough and McDonnell, 1998). In addition, the size of the neighborhood and the number of neighbors are also relevant to the accuracy of the results.
di = The distance of sample point to estimated
point.
N = The coefficient that determines weigh based on a distance.
n = The total number of predictions for each validation case.
3 Results
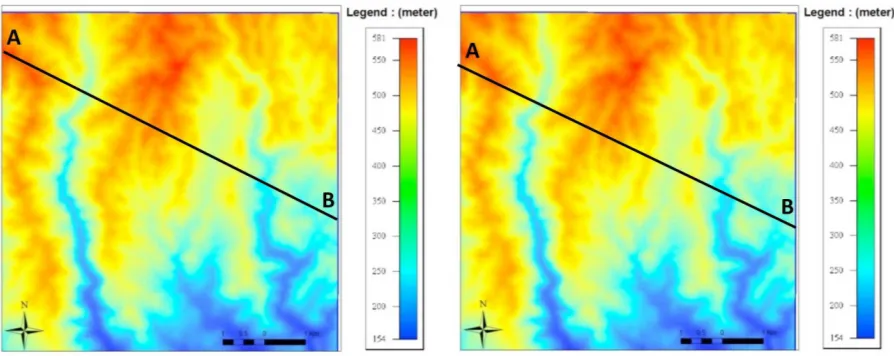
According to ESRI (2004), Kriging is one of the most complex interpolators. It applies so-phisticated statistical methods that consider the unique characteristics of dataset. IDW takes the concept of spatial autocorrelation literally. It as-sumes that the nearer a sample point is to the cell whose value is to be estimated, the more closely the cell’s value will resemble the sample point’s value. The parameters of both interpo-lation methods are seen in Table 1.
Figure 3: Kriging (left) and IDW (right), black line is profile line.
Figure 4: Profile from DEM of Kriging interpolation.
raster interpolation.
Both raster used for comparison were ana-lyzed with same lineament extraction param-eters (Table 2). There are six paramparam-eters are used as RADI (Radius of filter in pixels), GTHR (threshold for edge gradient), LTHR (threshold for curve length), FTHR (threshold for line fit-ting error), ATHR (threshold for angular dif-ference), and DTHR (threshold for linking dis-tance). After that, error correction is conducted by erasing the lineament as hills or ridge. This correction is based on the assumption that the lineaments are structural lineaments that iden-tified as valley, river, or erosion line. Compar-ison between two extraction lineaments can be seen in Figure 6.
3.2 Analysis
That lineament extraction is analyzed by using statistical rose diagram. Rose diagram are made using digital processes with frequency interval of 10°. The analysis is based on the Kriging and IDW interpolation methods results (Figure 7).
The major lineament direction trends in NE-SW. A small difference can be seen between the two rose diagrams. The diagram resulted from Kriging method shows a random linea-ment and almost same in all directions, whereas IDW method shows a rather random lineament and less NW-SE trends.
4 Discussion and conclusion
Several important points emerge from this re-search. Because the primary objective is to com-pare different interpolation methods, we first consider the effect of interpolation method on accuracy [as measured by log (MSE)]. The most
two types of methods tended to be greatest at those levels of the other factors at which all four methods performed best.
Although the primary objective of this inves-tigation was to compare interpolation methods, the effects of the other factors on overall polation performance were also of some inter-est. The significance of the main effects and the relatively small magnitude of the interac-tions allow us to make several points and to note some aspects that require further investi-gation. First, our results indicate that overall interpolation performance deteriorated consis-tently and significantly as the sampling pattern varied from the most regular pattern, hexago-nal, to the next most regular, inhibited, to a ran-dom pattern, and finally to the most irregular pattern, clustered.
Table 2: Parameter of lineament extraction.
Parameter Value for Kriging and IDW raster
Parameter Value for Kriging and IDW raster
RADI 3 FTHR 3
GTHR 5 ATHR 5
LTHR 3 DTHR 3
Figure 6: Comparison of lineament extraction in Kriging and IDW raster.
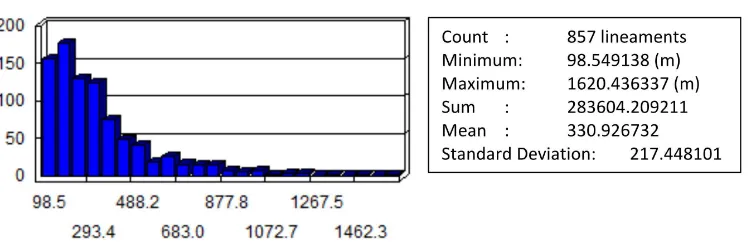
Figure 8: Frequency distribution of lineament resulted from kriging interpolation.
Figure 9: Frequency distribution of lineament resulted from IDW interpolation.
approach used in this paper could serve as the basis for visualizing and evaluating local per-formance characteristics
This study also evaluated the accuracy of two interpolation techniques for generating DEMs. Different landform types and density values of height measurement were considered. Irrespec-tive of the surface area, landscape morphology and sampling density, few differences existed between the employed interpolation techniques if the sampling density was high. At lower sam-pling densities, in contrast, the performance of the techniques tended to vary. Kriging yielded better estimates if the spatial structure of alti-tude was strong. The spatial structure of height was weak as observed at the IDW.
These results may help GIS specialists to select the best method for the generation of DEMs. A technique should be chosen not only for its performance on a specific landform type and data density, but also for its applicability to a wide range of spatial scales. The result of the methodology used in IDW raster is lineament
looks smoother and more firmly drawn than lineament from kriging raster extraction. Fur-thermore, lineaments analyzed by using Rose diagram show that the lineament in IDW raster is more accurate than Kriging because the pres-ence of minor lineaments and the less display of maxima whic are useful as an interpretation of the force that form lineament. The analysis from Kriging raster shows that there are many major maxima in study area, hence making ge-ological interpretation less accurate.
References
Bemmelen, R.W. Van (1949) The Geology of Indone-sia; Vol. I.A., The Hague, Martinus Nyhoff. Burrough, P.A., McDonnell, R.A. (1998) Creating
continuous surfaces from point data. In: Bur-rough, P.A., Goodchild, M.F., McDonnell, R.A., Switzer, P., Worboys, M. (Eds.), Principles of Geo-graphic Information Systems. Oxford University Press, Oxford, UK.
resolution and available pedological data. Geo-derma 97, 405–422.
Lillesand, T.M., Kiefer, R.W. and Chipman, J.W. (2004) Remote Sensing and Image Interpretation, 5th edition, Singapore, John Wiley & Sons Inc.
Pulunggono, A. and Martodjojo, S. (1994) The Tec-tonic Changes During Paleogene-Neogene was the Most Important Tectonic Phenomenon in Java Island, Proceeding of the Seminar on Geology and Tectonics of Java Island, from the Late Meso-zoic to Quaternary, pp. 1-14, Yogyakarta, Gajah Mada University.
Rahardjo, et al. (1995) Geological Map of the Yo-gyakarta Sheet, Jawa, Bandung, Pusat Penelitian dan Pengembangan Geologi.
Sabins JR., F.F. (1978) Remote Sensing Principles and Interpretation, Amerika Serikat, W.H. Freeman and Company.
Sudradjat, A., Syafri, I., dan Budiadi, E. (2010) The Geotectonic Configuration of Kulon Progo Area, Yogyakarta, Proceeding PIT IAGI 39th.