J.Food Pharm.Sci. 3 (2015) 46-54
Research Article
Effect of
Electrical Stunning
and Pre-Slaughtering Time Interval In
Expression of Heart Broiler Chickens Protein
Sandra Hermanto, Sri Suci Mulyani, Anna Muawanah
Study Program of Chemistry Faculty of Science and Technology Syarif Hidayatullah Jakarta State Islamic UniversityJl. Ir. H. Juanda No. 95 Ciputat 15412
ARTICLE INFO ABSTRACT
Received 10/08/2015 Received in revised form 25/08/2015
Accepted 25/10/2015 Available online 01/11/2015
E-mail address:
Pre-slaughtering process by transporting broiler chickens from farm to slaughterhouse and treatment of electrical stunning could be one of halal critical point. Stressing on chickens could be trigger a specific protein expression or increase its expression as a result of changes in metabolism that occurs. The purpose of this study was to identify the effect of treatment of electrical stunning and the pre-slaughtering interval time on broiler chicken liver protein expression through the analysis of protein profile by SDS-PAGE. Experiments conducted on 7 broiler chickens aged 35 days were given pre-slaughter treatment are different. Treatments include electrical stunning of 0 V, 25 V and 250 V as well as the pre-slaughtering time interval 0 hours, 2 hours, 2 hours + 12 hours (fasting) and 2 hours + 12 (fasting) with electrical stunning 250 V. Each of samples (chicken liver protein) isolated by homogenized in Trs-HCl buffer and the protein concentration determined by Lowry method. Identification of the protein profile was done by observing the differences in the intensity of the electrophoresis results followed by densitometry analysis. The results showed significant differences in outcomes electrical stunning treatment as indicated by the appearance of protein bands at around 109 kDa and do not appear on other treatments. The difference is predicted from particular protein expressed induced by cell metabolism responsive in chicken liver cell.
Keywords: Chicken liver, Electrical Stunning, SDS-PAGE, pre-slaughtering treatment.
1. INTRODUCTION
The high demand of chicken meat causes chicken meat production increase from year to year. The National Center of Poultry Market Information (Pinsar) estimates national broiler production in 2014 reached 2.4 billion with an average live weight of 1.4 kilograms. Pre-slaughtering conditions such as the transport of chickens from the farm to the slaughterhouse, the condition of transportations and the treatment of chickens after arriving at the slaughterhouse could be one of the critical points of halal. Chickens are transfered from farms located far and containers containing chicken in large quantities in a small space capable of stressing trigger on chickens. Even during the transport of chickens their fasting and left in a state
of hot, stuffy and lack of oxygen enhances the effects of stress, sometimes cause to death.
Noting the Prophet hadith narrated by Muslim that reads "From Syidad bin Aus ra. that the Rasulullah said: Verily Allah requires doing good to all things. Therefore, if you kill, kill in a good way and when you slaughter, slaughtering in a good way. And before one of you slaugter the animals, sharpen your knife and make happy the animals to be slaughtered. "This hadith advised us to make the animals to be slaughtered happy, in other words do not make animals that will cut the stress or suffering.
Amid et.al. (2012), mentions that stuning with electrical currents and 70V 0,75A can produce proteins that are relatively different spots when compared to controls that do not stunning. The study shows that a high voltage is able to induce some kind of protein that is expressed in the chicken heart like actin and troponin I. In addition, several other studies claim that as a response to the stress of transport process changes kortikostreron levels, glucose, lactic acid, cholesterol, uric acid, triglycerides, HDL and heterophile / lymphocyte in chicken blood (Puvadolpirod and Thaxon (2000), Nijdam et al. (2005) and Vosmerova et al. (2010)). Yue et al. (2010), saying that hypoglycemia occurred in chickens undergo a process of transport and storage of each 3 hours. Zanneti et al. (2013), shows that the emergence of protein expression were identified as thimet oligopeptidase and heat shock protein beta-1 in muscle chicken breast to treat the transport of chickens from the farm to the slaughterhouse.
The liver is the central metabolic organ in chickens. Protein expression associated with stressful conditions can occur in the liver (Dibner and Ivey, 1990). The possibility of changes in protein expression or the emergence of a certain protein in chicken liver can occur as a response to stress. Zanneti et al. (2013), showed changes in the expression of several types of proteins in the muscle meat, but research on stress-related protein expression in chickens liver are relatively less informed. This study aimed to explore the possible differences in protein expression in the chicken liver as a response to stress conditions during pre-slaughter interval (trasportation period and storage) as well as the treatment of electrical stunning. Results of this study are expected to contribute in the food development of halal analytical methods especially in broiler chickens were treated with electrical stunning.
2. MATERIAL AND METHODS
2.1 Experimental Animals
Liver sampels took from 7 male chickens brouiler strain male Hubbard weight +1.7 kg (35 days) obtained from farms in Bekasi, aquabidest, methanol, glacial acetic acid, Sodium hydroxide, Sodium bicarbonic, Follin Collicateu reagent, KNa-Tartrat, coomasie brilliant blue, Bovine Serum Albumin (BSA), Dodecile Sodium Sulfate (SDS), triton X-100phenylmethylsulfonylflouride (PMSF), a solution of 30% acrylamide, resolving buffer (1.5 m Tris-HCl pH 8.8), stacking Buffer (Tris 0.5M Tris-HCl pH 6.8), sample buffer, running buffer (Tris-Glysin-SDS, pH 8.3), Ammonium Peroxide disulfat (APS) of 10% and N, N, N ',
N'-tetramethyl ethylene diamine (TEMED ). The tools used consisted of glass tools, microtube, micro pipette, homogenizer (Tokebi), vortex, refigrated microcentrifuge (Peqlab), Mini Protean II Cell Electrophoresis (Bio-Rad) and UV-Vis spectrophotometer Lambda 25 (Perkin Elmer).
2.2 Sample Preparation
Liver samples obtained by sampling directly to the farm then selected 7 male chickens with weight +1.7 kg. Each of chicken was given different treatment by electrical stunning and pre-slaugtering time interval (Table 1).
Each of treatment outcomes chicken slaughtered in the Islamic way, cleaned and separated parts of its heart and then stored in a freezer. Each of sample (chicken liver) weighed 10 grams then added 20 mL of Tris-HCl buffer pH 8.2, triton X-100 40μL and μL PMSF 50 mM. Samples homogenized with a homogenizer for 5 minutes with an interval of 1 minute and 30 seconds breaks. Samples put into the microtube and centrifuged at 15000xg at 4 ° C for 30 minutes. Supernatant was separated and stored at -20° C until use.
2.3 Measurement of protein content (Lowry, 1959)
Standard solution of protein (BSA) was added to each test tube as much as 1 mL, then added with 5 mL of reagent Lowry I (100 mL Na2CO3 2% in 0,1N NaOH and 2 mL of 1% CuSO4 in KNaTartrat 1%), hereinafter divortex mix 5 seconds and incubated at room temperature for 10 minutes. Then the mixture was added 0.5 mL reagent II Lowry (Folin Collicateu), divortex 5 seconds and incubated at room temperature for 30 minutes. Standard solution absorbance is read at a wavelength of maximum. A calibration curve was made by plotting the absorbance value of each standard solution and the sample concentration is calculated using the linear regression equation of the standard calibration curve.
2.4 Sodium Dodecyl Sulphate Polyacrylamide Gel Electrophoresis (Laemli, 1970)
Protein sample solution from chicken liver were mixed in sample buffer 1:8, heated at 85oC for 5 minutes, then 15µL loaded into acrylamide gel wells. Electrodes are placed in two of poles. Electrophoresis was run at 200 V and 15 mA/gel for 60 minutes using a Mini-Protean Tetra Cell-BIO-RAD. After electrophoresis, gels were stained with 0.05% (w / v) Coomassie blue R-250 in 15% methanol (v / v) and 5% acetic acid (v / v) was heated in a microwave for 15 seconds and then incubated for 60 minutes , Gel is rinsed with soaked in a mixture of 30% methanol and 10% acetic acid for 2-3 hours.
2.5 Analysis of the protein molecular weight (Mr)
tracking of stacking gel to each protein bands were formed (b), then searched retardation factor (Rf) by dividing the distance of each tape with distance tracking a total of (b / a), then the value of log BM of each ribbon marker. BM tape fragment of the polypeptide in the sample is calculated by linear equations {Y = a + bX} where Rf value as the X-axis and the value of log BM as the axis Y.
2.6. Image Analysis by Densitometry
Electrophoregram from SDS-PAGE results are converted into a chromatogram then analyzed using an ImageJ software 1.4. Electrophoregram results in gray scale scan mode with a DPI of 300 or more and saved in JPEG format. Scanned file opened in ImageJ application. To determine the intensity and the retardation fraction (Rf) have been straight tool then pulled down from the end of the gel to the tip of the gel on a track contained protein bands were chosen menu Analyze> profile plot. This will bring up a histogram with scale and grid.
3. RESULTS AND DISCUSSION
3.1 Protein extraction
Each of samples of chicken liver with a variety of treatments isolated using Tris-HCl buffer pH 8.2, and PMSF as protease inhibitors. Triton X-100 as an agent for cell lysis and denaturation of the protein quaternary structure. Samples with a solution mixture is then mashed with a homogenizer to facilitate cell lysis so that the soluble protein in the cell can be out. Sampel then centrifuged to separate the remains of cells such as insoluble precipitate cell organelles and separate the extraction solution.
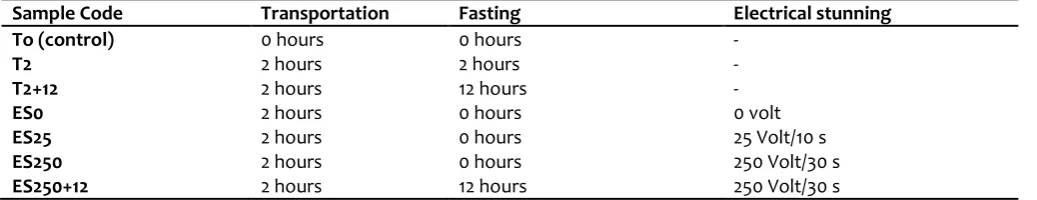
The results of protein isolate in Figure 1 shows the different colors. The most obvious difference in the colors shown in the samples treated with electrical stunning. The color increasingly concentrated at the higher voltage, possibly due to cardiac arrest because of an electrical stunning. This fibrillation result is supported by Savenije et al. (2002), said cardiac arrest impact on blood pressure slowly. Finaly the loss of blood is not pumped out properly. Hasegawa et al, (2002), said high voltage at the time of stunning (150 V) causes fibrillation and cardiac arrest resulting in death directly. Lambooij et al. (2008), stating that sufficient current (50V for 1 second) can induce spontaneous epileptic symptoms,
cardiac fibrillation followed by cessation of cardiac activity and cessation of all brain functions. No
discharge of blood both at the time of slaughter because of heart activity has stopped so there is the blood that remains in the hearts of this ayam.Hal cause colored hearts isolated merah. Lawrie (2003), stating that the red color of the meat due to the liver can be affected hemoglobin.The color given in the liver is that organt plays a role in reshuffle hemoglobin-containing red blood.
3.2 Protein quantification of Chicken Liver
This is the results of the protein measurement of chicken liver extract :The highest protein content was found in the samples without treatment (ES0 electrical
stunning) and the lowest levels of the protein exist in the sample EST12 with electrical stunning 250 V, transportation for 2 hours and without food for 12 hours. The level of chicken liver protein in the treatment of electrical stunning and the time interval pre-slaugtering showed that more extreme treatment can reduce the levels of proteins. Decreased levels of this protein is thought to be due to the stress of chicken.
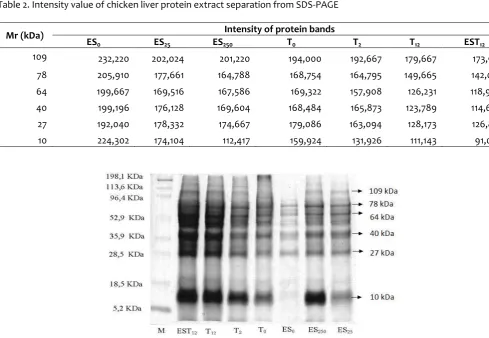
3.3 SDS-PAGE results
Samples of chicken liver extract is equated with the lowest protein concentration which is 7246.97 mg / mL. Each 20 µL sample was taken and mixed with 160 µL of sample buffer then vortex and heated for 5 minutes in a boiling water bath. Gel formulation used was 6% stacking gel and 12% resolving gel. The gel formulation is able to separate up to 9.5 kDa protein. Each well on the gel is filled with 10 mL of sample was mixed with a sample buffer (1: 8). Gel electrophoresis for 50 minutes at a constant voltage of 150 V. SDS-PAGE electrophoresis results of chicken liver protein extracts can be seen in the following figure:
Figure 2 shows some differences in protein profiles in which the sample EST12 and T12 shows thick bands while protein profile ES0 sample showed a
relatively thin ribbon. Each sample is given in the form of electrical stunning stressing or pre-slaugthering time interval indicates the difference in protein bands intensity at around 109 kDa and 10 kDa. The higher the intensity of the band corelated with the more extreme treatment given. The range of 10 kDa protein band intensity was the highest seen in the treatment of electrical stunning and the pre-slaugtering time interval (EST12). The intensity of protein bands chicken liver with
various treatments can be seen in Table 2. Table 1. Treatment in each sample
Sample Code Transportation Fasting Electrical stunning
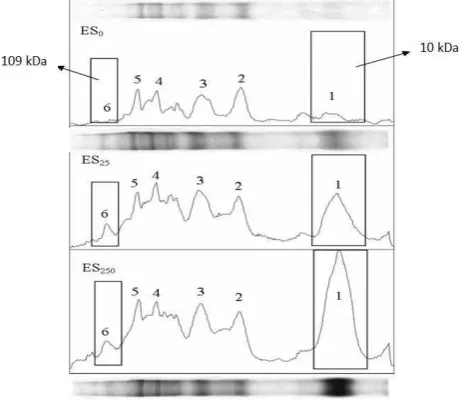
Figure 3 shows the results of densitometry analysis of chicken liver protein profiles with a variety of electrical stunning. Sharp peaks (number 6 in Figure 3) shows this protein only appears on the treatment of electrical stunning. This peak also appears on EST12 samples (Figure 4) are also being subjected to electrical stunning. So it can be assumed that the pointed peaks at no.6 is a specific protein whose only expression is influenced by electrical stunning. This protein has a molecular weight of 109 kDa and could be candidated for proteomic markers in chicken treatment by electrical stunning.
The results of densitometry analysis showed a significant difference in the intensity of the plot of the
protein profiles between ES0, ES250 and ES25 in the range
of molecular weight of 27 kDa - 78 kDa (Figure 3). Peaks that appear in the results of densitometry analysis were associated with metabolic response due to electrical stunning treatment. Other proteins that appear with greater intensity in the range of 10 kDa may be a protein that is involved in energy metabolism due to lack of feed given intensity increased at T12 and EST12 which is sampled pemberiaan treatment without feed. Just as in the treatment of electrical stunning, the expression of the protein in the range of 10 kDa molecular weight increase is directly proportional to the time interval of pre-slaughter.
Figure 1. Protein isolate of chicken livers in various treatments
Table 2. Intensity value of chicken liver protein extract separation from SDS-PAGE
Mr (kDa) Intensity of protein bands
ES0 ES25 ES250 T0 T2 T12 EST12
109 232,220 202,024 201,220 194,000 192,667 179,667 173,912
78 205,910 177,661 164,788 168,754 164,795 149,665 142,019
64 199,667 169,516 167,586 169,322 157,908 126,231 118,984
40 199,196 176,128 169,604 168,484 165,873 123,789 114,667
27 192,040 178,332 174,667 179,086 163,094 128,173 126,821
10 224,302 174,104 112,417 159,924 131,926 111,143 91,053
Figure 2. SDS-PAGE profile of chicken liver extract separation. M: Protein Marker; EST12: Transportation 2 hours + 12 hours Withdrawal of Feed + Electrical Stunning 250 V; T12: transportation of 2 hours + 12 hours Withdrawal of feed; T2: Transportation 2 hours; T0: Transportation 0 hours; ES0: Non Electrical Stunning; ES250: Electrical Stuning 250 V; ES25:
Some stressors when transporting include hypoxia, heat, space density and hunger (Zanetti et al., 2013). According to Bao et al. (2011), hypoxia increases the activity of glutathione reductase in glutathione metabolism in response adaptation. Due to transport several compounds in the plasma concentration changes. The change is the increase in value of NEFA (nonesterified fatty acid) and corticosterone (Nidjam et al., 2005) and a decrease in glucose levels (Yue et al., 2010). Nijdam et al. (2005) said that the transport of chickens from the farm to the slaughterhouse is a process that requires more energy is obtained from the oxidation of glucose with the added effect of the increase in corticosterone neoglukogenetik that combines stress and without feeding.
Glucose oxidase is used as an energy source early and increase in plasma NEFA levels showed an increase in lipolysis. Fatty acid oxidation increased by 4 times after the feed withdrawal before panen.Kebutuhan energy-filled carbs later by catabolism of lipids and proteins (Hazelwood et al., 1986). Decrease fat content in the chicken liver during fasting before harvest is a combination of a decrease in fat synthesis and increase in fat lysis (Trampel et al., 2005).
4. CONCLUSIONS
Differences in protein profiles in chicken livers treated with the transport of livestock to slaughterhouses showed an increase in protein expression levels in the range of 27-84 kDa. Treatment Figure 3. The difference in peak intensity of densitometry. ES0) Without treatment Electrical Stunning; ES250) Treatment Electrical Stunning 250 V; ES25) Treatment Electreical Stuning 25 V.
of electrical stunning produce a specific protein bands at around 109 kDa which does not appear in the other treatments. This is thought to result from particular protein expressed induced by cell metabolism responsive of chicken liver.
5. Acknowledgments
The authors wish to thank to Dr. Fahma Wijayanti as Head of PLT and Dean of FST for helpful discussion and encouragements and for kindly providing some of the gelatines used in this work.
6. REFERENCES
1. Amid, A., Norshahida, A, S., and Faridah Y. 2012.Identification of Troponin I and Actin, Alpha Cardiac Muscle 1 as Potential Biomarkers for Hearts of Electrically Stimulated Chickens.ProteomeScience.10: 1-8
2. Bao, H. G., Wang, X. Y., Li, J. Y., and Wu, C. X.2011. Comparison of Effect of Hypoxia on Glutathione and Activities of Related Enzym in Livers of Tibet Chicken and Silky Chiken. Poultry Science. 90: 648-658.
3. Dibner, Julia J. and Ivey, Francis J. 1990. Hepatic Protein and Amino-Acid Metabolism in Poultry. Poutlry Science. 69. 1188-1194.
4. Hasegawa, S., Kawakami, T., Honda,K. and Hikami,Y.2002. Effect of Fasting on Adipose Tissue Weight in Chicks, with Reference to Changes in Chemical Composition and Lipase Activity. Anim. Sci. Technol. 65:89–98.
5. Hazelwood, R. L. 1986. Carbohydrate Metabolism. Pages 303–325 in Avian Physiology. P. D. Sturkie, ed. Springer-Verlag, New York.
6. Laemmli UK.1970. Cleavage of Structural Proteins During The Assembly of The Head of Bacteriophage T4. Nature.227 (5259): 680–685. 7. Lambooij, E., Reinert, H., Van de Vis, J. W., and
Gerittze, M. A. 2008. Head-to-Cloaca Electrical Stunning of Broilers. Poultry Science. 87:2160-2165.
8. Lawrie. R.A. 2003. Ilmu Daging.Edisi kelima penerjemah Prof Dr.Aminuddin Parakkasi. Penerbit Universitas Indonesia. Jakarta
9. Lowry, O. H., Rosebrough, N. J., Farr, A. L., and Randall, R. J. 1959. Protein Measurement with the Folin Phenol Reagent J. Biol. Chem.193:265–275. 10. Nijdam, E., Delezie, E., Lambooij, E., Nabuurs, M.
J., Decuypere, E. and Stegeman J. A.2005.Feed Withdrawal of Broilers Before Transport Changes
Plasma Hormoneand Metabolite Concentrations. Poult Sci. 84:1146–152.
11. Puvadolpirod, S and Thaxton, P. J. 2000.Model of Physiological Stress in Chickens 2.Dosimetry of Adrenocortropin. Poultry Science.79:370–376. 12. Puvadolpirod, S and Thaxton, P. J. 2008.Model of
Physiological Stress in Chickens 1.Response Parameters.Poultry Science.79:363–369.
13. Savenije, B., Lambooij, E., Gerritzen, M. A., Venema, K. and Korf,J. 2002. Effects of Feed Deprivation and Transport on Preslaughter Blood Metabolites, Early Postmortem Muscle Metabolites, and Meat Quality. Poult. Sci. 81:699– 708.
14. Trampel, D. W., Sell, J. L., Ahn, D. U., and Sebranek, J. G. 2005. Preharvest Feed Withdrawal Affect Liver Livid and Liver Color in Broiler Chickens. Poultry Science. 84: 137-142.
15. Trampel, D. W., Sell, J. L., Ahn, D. U., and Sebranek, J. G. 2005. Preharvest Feed Withdrawal Affect Liver Livid and Liver Color in Broiler Chickens. Poultry Science. 84: 137-142.
16. Vosmerova.P., Chloupek, J., Bedanova, I., Choupek, P., Kruzikova, K., Blahova, J. and Vecerek, V. 2010. Changes in Selected Biochemical Indices Related to Transport of Broilers to Slaughterhouse Under Different Ambient Temperatures. Poult Sci. 89:2719–2725. 17. Yue H. Y, Zhang L, Wu S. G, Xu L, Zhang H. J and Qi
H. G. 2010.Effects of Transport Stress on Blood Metabolism, Glycolytic Potential, and Meat Quality in Meat-Type Yellow-Feathered Chickens.Poultry Science. 89:413–419