1
The Value Relevance Of Environmental Performance:
Evidence From Indonesia
Full paper
! ! "
Abstract:
This study aims to provide empirical evidence on the value relevance of environmental
performance by testing the relationship between share prices of Indonesian listed corporations
and their environmental performance ratings, called the PROPER ratings. PROPER (Program
for Evaluation of Environmental Performance Ratings) is carried out by Indonesia Ministry of
Environment, which annually evaluates and rates environmental performance of selected
Indonesian companies and releases the results to the public. 62 listed companies participating in
PROPER during 2002-2012 were identified as usable sample, resulting an unbalanced 256
firm-year observations. Following Clarkson et al. (2004) which modifies Ohlson (1995) model, share
price is regressed against earnings per share, book value per share, PROPER ratings and other
control variables commonly used in value relevance literature. We find that superior
environmental performance is associated with higher share price. Specifically, there is evidence
that environmental performance information is value relevant incremental on that of the
accounting information, and particularly on profitable firms.
2
1
Introduction
This study aims to provide empirical evidence on the value relevance of environmental performance by
testing the relationship between share prices of Indonesian listed corporation and their environmental
performance ratings. Such ratings are annually by The Indonesia Ministry of Environment, through its’
program called PROPER (Program for Evaluation of Environmental Performance Ratings). We find that
superior environmental performance is associated with higher share pricepublished. Specifically, there is
evidence that environmental performance information is value relevant incremental on that of the
accounting information, and particularly on profitable firms.
PROPER aims to target selected Indonesian companies whose operational impacts are considered
significant to the environment. Initiated in 1995 as a pilot project funded by the World Bank, PROPER
restarted in 2002 and fully funded by the state budget. The number of PROPER participants have increased
overtime, from 82 in 2002 up to more than 1.000 in 2014. PROPER rates corporate environmental
performance using color codes: black, red, blue, green, and gold, indicating the poorest to best
environmental performance (Indonesia Ministry of Environment, 2007). One of its purposes is to provide
rewards and punishment mechanism for targeted companies based on their environmental performance. By
publicly releasing their environmental performance ratings to the stakeholders (2011), the Ministry expects
that the PROPER ratings will influence the stakeholders in making investment and related decisions. For
example, green investors and creditors may use PROPER ratings in assessing the risks and return of the
rated firms. Meanwhile, green consumers may find PROPER results useful for making purchase decisions.
However, after more than a decade of implementation, there has been little research undertaken to evaluate
the effectiveness of the PROPER program, specifically on how different stakeholders value such
information as a reward and punishment mechanism, as planned by the ministry. Furthermore, studies on
how environmental performance information affects the capital market in an emerging economy, such as
3 al. 2004; Goldar, 2003; Konar & Cohen, 2001; Stevens, 1984). This study contributes to the literature by
providing empirical evidence on how corporate environmental performance influence their share prices.
Using the framework by Ohlson (1995), share prices of Indonesian listed companies are regressed against
their PROPER ratings and other control variables.
Previous studies on the relationship between environmental performance and financial performance have
been extensive, but are inconclusive (Hughes 2000; Clarkson, et al. 2004; Hassel et al. 2005; Moneva &
Cuellar 2009). Various measures of financial performance, both accounting and market measures, have
been used in these studies and may contribute to the inconclusiveness. Other studies that investigate the
relationship between environmental performance and environmental disclosures have also found mixed
results (e.g. Hackston & Milne, 1996; Magness, 2003; Neu, et al., 1998; O’Donovan, 2002; Patten, 2002).
Environmental performance was also measured using different proxies, such as environmental emissions
(e.g., Clarkson, et al., 2004.; Decker & Jalbert, 2003; Johnson, 1995; Konar & Cohen, 2001; Shadbegian &
Gray, 2003), companies with hazardous sites (Hutchison, 1997) , and firms partially environmental
responsible parties by US EPA (Mitchell, 1994).
These studies use only negative environmental performance indicating only poor performers and neglecting
good environmental performers in the sample by classifying them into the control sample, i.e. the same
category as average performers. We argue that positive environmental performance could also have
information content. Therefore, the use of a environmental performance measure that distinguishes poor
and good performers, such as PROPER ratings, provides exclusive contribution to the literature. One
particular study by Nilsson (2003) uses a five-scaled index of environmental performance of listed Swedish
companies provided by a rating firm, named Caring Company. Although such an index includes both poor
and superior environmental performance, it may contain of potential validity and reliability problems,
because such an index was derived from corporate annual reports, instead of an evaluation by authorized
third party. Another study by Endrikat (2015) uses environmental events, i.e., company announcements
4 Similarly, this measure bears similar issues as compared to third party announcements, because corporate
announcements involve much subjectivity of the internal management.
In relation to value relevance literature, prior studies have extensively examined how capital markets
combine accounting information with “other information” for firm valuation. For example, Floros (2008)
and Oehler, et al. (2013) investigated how political events, such as election, influence capital markets.
Barth, et al. (1998) finds that brand value estimates are positively related to prices and returns, incremental
to accounting variables. This is consistent with the findings in market valuation literature that find financial
information provided by the historical cost basis of accounting lack of relevance (Scott, 2003). This study
also contributes to the empirical findings by testing how environmental performance affects firm value.
The results of this study provide contributions as follows. First, as the Indonesia Ministry of Environment’s
intention to provide a “stick and carrot” mechanism of the PROPER program, this study gives insight on
whether investors, as the primary stakeholders, value corporate environmental performance information
in the form of PROPER ratings, which is reflected in the share price. Such an evaluation may help the
ministry to understand the effectiveness of PROPER program and how to improve its implementation. This
study also provides implications for the managers of Indonesian corporations in developing strategies and
managing environmental issues. By understanding how investors respond to environmental performance
information, different strategies may be considered in the development of environmental management
systems and the handling of their environmental and social reputations. Finally, as mentioned earlier, this
study contributes to the literature by providing insight on the information content of environmental
5
2
Theoretical Framework And Hypothesis Development
2.1 The Concept of Value Relevance
In capital markets research, accounting information is considered to be value relevant because it
indicates future profitability, and is thus used by market participants in corporate valuation (Beaver, 2002).
While only some economic activities are manifested in current earnings, other information about current
economic performance and its implications for future profitability can be assessed by capital market
participants (Jiambalvo, et al., 2002). If it has implication for future earnings, then it will be reflected in
current share prices.
Accounting Information
Companies are competing for limited capital resources; therefore, information about earnings is of
a particular interest for investors in relation to their investment decisions. Early studies (e.g., Ball & Brown
1968; Beaver 1968) expound that earnings information contributes to the changes in market value of a
company, hence had been used to predict future earnings. Similarly, Nichols and Wahlen (2004) assert
current period earnings offers wealth creation information that is useful for predicting future earnings.
Earnings information may be more value relevant to the market than the book value of equity for
companies that have a good financial condition ( Barth, et al., 1998) and may provide complementary
information to book value of equity when abnormal earnings are more persistent (Ohlson, 1995). However,
book value of equity (which is the information provided by the balance sheet) is adequate in determining
the market value of a normal-growth corporation (Nwaeze, 1998), and is deemed to be more relevant than
earnings information where losses are more prevalent and one-time items are substantially impounded in
earnings (Barth et al.,1998). Therefore, the complementary value relevance of earnings and book value in
6
Environmental Information
Jiambalvo et al. (2002) argue that sophisticated investors utilize information (i.e. financial and
non-financial) to predict future earnings and this is impounded in current share prices. Accordingly, although
non-financial information might not be manifested in current earnings, it may have an impact on future
earnings. Therefore, accounting information may not adequately represent future corporate financial
performance.
The value relevance of information beyond earnings and book value has been investigated by many
studies. For example, Hughes (2000) examines the value relevance of air pollution measures and finds that
the market uses this information to estimate future environmental liabilities of the electric utility industry.
Moneva and Cuellar (2009) investigate whether financial and non-financial environmental performance
information is value relevant to the share market. They find that financial measures of environmental
performance (environmental assets/investments, environmental costs, and provisions) are value relevant
but non-financial disclosures (environmental policy and environmental management systems) are not.
Clarkson et al. (2004) examine the value relevance of environmental capital expenditures of pulp and paper
companies and find environmental capital expenditures for low polluting firms are value relevant to the
market. Studies in the context of environmental performance information evidently show that
environmental information is regarded as value relevant by investors and is useful for equity valuation.
This summarizes that non-financial information has implications on the future financial performance of a
company and provides additional information to that of earnings and book value of equity.
2.2 PROPER Ratings and The Value Relevance of Environmental Performance
PROPER is an environmental performance ratings which have been released by the Indonesia Ministry of
Environment annually for more than a decade. Such ratings are given to companies whose operating
7 from 82 in 2002 to more than 1,000 facilities in 2014. It evaluates and rates the participating companies
into five color code ratings, black, red, blue, green and gold, from the worst to the best, respectively. Such
ratings are given based on the documentation provided by the participating companies and the
environmental audit performed by the ministry.
PROPER ratings provide information about corporate environmental performance to the stakeholders, such
as equity investors. Companies with superior performance are expected to gain rewards by the increase in
share price, and vice versa. In other words, environmental management system and corporate environmental
performance are expected to influence corporate performance. A study by Clarkson et al. (2004) reveals
that companies with good environmental performance are favored by the share markets as indicated by
increased share prices. Management effort to manage company’s environmental performance can influence
its financial performance and thus companies need to calculate its sacrifice or investment to adopt cleaner
production strategies (Porter & Linde, 1995; Russo & Fouts, 1997).
Previous studies support the argument that information about environmental performance is value relevant
in particular context (P. Clarkson & Li, 2004; Hamilton, 1995; Hassel, Nilsson, & Nyquist, 2005; Hughes,
2000; Moneva & Cuellar, 2009). (P. M. Clarkson et al.(2004) investigates the value relevance
environmental capital expenditure by firms in pulp and paper industry in the US from 1989 to 2000.
Categorizing firms of good and poor environmental performance based on their capital expenditure, they
reveal incremental economic benefits associated with environmental capital expenditure investment by
low-polluting firms but not high-polluting firm.
Hughes (2000) examines the relation between the market value of equity and pollution measures sulfur
dioxide emissions. He finds that the levels of sulfur dioxide emissions are negatively associated with share
prices. Hamilton (1995) reported that the higher pollution figures (such as air emissions or offsite shipments
of toxic waste) were in a firm's TRI reports, the more likely print journalists were to write about the firm's
8 upon the first release of the information. However, Hassel et al. (2005) finds environmental investments
represent only increased costs, resulting in decreased earnings and lower market values. Using a sample of
Swedish companies they find that the results of their study support the cost-concerned school, because the
results indicate that environmental performance has a negative influence on the market.
Based on these inconsistent results, we believe that a new investigation on the value relevance of
environmental performance information will have an important contribution to existing literature. Using a
different context and measures of environmental performance, we expect that this particular study will provide
empirical finding on how environmental related information influence the share markets. The use of Indonesia
as an emerging economy and PROPER ratings are unique in this study and therefore are expected to provide
significant contribution to the existing literature which is mainly from developed nations.
Information regarding environmental performance ratings can be value relevant if it provides additional
information to the accounting numbers and helps investors access the future financial performance of the
firms. As discussed earlier, firms with superior performance may gain benefits from such ratings because
they are protected from environmental costs or liabilities. Firms with good PROPER ratings can have higher
reputation and legitimacy, which may improve their competitive advantages, and future profitability. Since
PROPER ratings indicate future profitability, we predict that PROPER ratings are valued by investors as
reflected in share prices:
Hypothesis 1: Environmental performance ratings are value relevant to the market.
3
Research Method
3.1 Sample Selection
The population of this study consists of 71 unique listed companies covered under PROPER from the period
of 2003 to 2012 (except for 2006 and 2007 when PROPER was suspended). This forms 313 firm-year
9 the information needed for this study are excluded from the sample. After cleaning for the unavailable data,
the final sample consists of 62 unique companies forming 256 firm-year observations.
3.2 Data Collection
Two types of data sources used in this study are financial data and environmental performance data. The
financial data was mainly collected from electronic database, OSIRIS. Where these database failed to
provide such data, corporate financial reports from Indonesia Stock Exchange website and ICMD
(Indonesian Capital Market Directory) were used to obtain financial figures. Data
regarding
environmental ratings (PROPER) was obtained from the website of the Indonesian Ministry of
Environment when such ratings were released. Due to its limited economic resources, PROPER
only evaluates companies whose environmental impacts are considered significant, but with
expanded coverage over time. It includes listed and unlisted companies.
3.3 Statistical Method
This study uses panel data approach. The sample size of 256 observations formed an unbalanced panel.
Based on Hausman test (Wooldridge, 2013) it is found that the preferred model to analyze the panel data
is the fixed-effect model.
3.4 Research Model
The value relevance of environmental ratings in this study is examined using the Ohlson (1995) model
modified by including the environmental ratings and control variables, in which we argue that
environmental ratings are information incremental to those of accounting information. The model is as
follows:
10 Where,
SP = Share prices of company i at year t
E = Earnings per share of company i at year t
BV = Book value per share of company i at year t
Environmental Ratings = PROPER ratings of company i at year t
Control Variables = Consists of Growth, Leverage, and Liquidity of company i at year t
Dependent Variable
This study uses share prices three months after the end of fiscal year. In this case the share prices used are
share prices as of March 31 since the fiscal year end of all the samples at the related years is December 31.
Share prices represent firms’ expected future cash flows and therefore would provide a more objective
measure of firms’ financial performance.
Independent Variables
Earnings
Earnings per share is the first independent variable in this study. It is measured by earnings before interest
and taxes divided by number of shares outstanding. According to Ball and Brown (1968), Beaver (1968),
and Tucker and Zarowin (2006), earnings which is the product of income statement have a role in
determining firms’ market value. This is because studies have shown that earnings contain information
11
Book Value
Book value per share is the second independent variable which is measured by book value of equity divided
by number of shares outstanding. Book value of equity is the product of balance sheet (or statement of
financial position) and is deemed value relevant because it provides information that can affect the value
of equity. Ohlson (1995) states that current book value can be a factor to determine future earnings, thus
provides fair estimation for market value of the firms.
Environmental Performance (PROPER Ratings)
To operationalize the variable for environmental performance this study uses PROPER ratings. As
mentioned earlier, PROPER is a performance evaluation program conducted by the Indonesia Ministry of
Environment to selected Indonesian companies’ facilities. The results are released to the public using five
color-coded instruments; black, red, blue, green and gold represent environmental ratings from worst to
best. In this study, we define these ratings into an order scale; 1 to 5 for black to gold, respectively.
Since PROPER evaluates and rates companies of their selection based on facilities, companies with more
than one facilities will likely to earn more than one ratings and the we averaged the ratings for the purpose
of this study. For example, in 2001 PT.Indocement Tunggal Prakasa Tbk. (IDX ticker: INTP) was awarded
2 blues and 1 green for its three facilities located in different areas. The average ratings for INTP is 3,33.
Furthermore, we categorized companies with PROPER ratings of larger than 3 as good performers, and
poor performers otherwise.
Control Variables
Growth
Growth is measured by percent of changes in sales. This is one indicator of firms’ potential future financial
performance because it provides information regarding future investment opportunity (Minnis, 2011). As a
12
Liquidity
Liquidity is measured by total assets divided by total liabilities. Liquidity is one indicator of firms’
performance. Firms that are more liquid have more financial resources to conduct environmental related
activities as a signal of their capacity in complying with environmental regulation.
Leverage
Leverage is measured by total liabilities divided by total assets. Leverage captures firms’ capacity to
finance their assets through debt (Clarkson, et al., 2008) . The higher the debts to assets ratio results in a
highly leveraged company which makes it riskier to invest in. This means, if a company becomes default,
shareholders may lose all their investments.
4
Results and Discussion
4.1 Descriptive Statistics
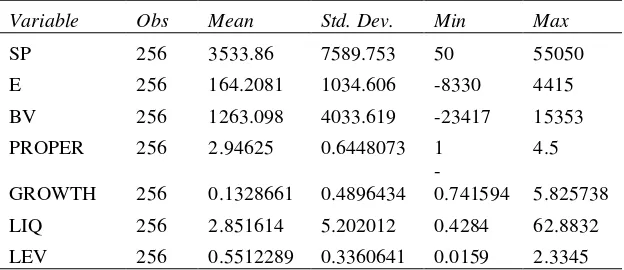
The descriptive statistics of 256 observations are presented on Table 1. On average, the share prices of all
companies are around Rp3,500 with the minimum of Rp50 and maximum of Rp55,050. This shows the
relative wide range of samples. The earnings per share are approximately Rp164, while the book value per
share has an average of Rp1,263. However, it can be seen from the table that there are companies with
negative earnings which might influence the examination. The PROPER ratings are around 2.9 in which
we categorized the samples as poor environmental performers, on average. The sample companies have
PROPER ratings as low as 1 and as high as 4.5. The sales growth of average companies is 13% which is
higher than the average inflation rate in Indonesia as presented in www.inflation.eu, thus could be said that
the average sample companies have positive growth rate. The liquidity ratio shows that the average
companies have total assets which are 2.85 times higher than total liabilities. This indicates that those
companies are relatively liquid. The leverage is 0.55, indicating that samples have total liabilities of 55%
13
Table 1 Descriptive Statistics
Variable Obs Mean Std. Dev. Min Max
SP 256 3533.86 7589.753 50 55050
E 256 164.2081 1034.606 -8330 4415 BV 256 1263.098 4033.619 -23417 15353
PROPER 256 2.94625 0.6448073 1 4.5
GROWTH 256 0.1328661 0.4896434
-0.741594 5.825738
LIQ 256 2.851614 5.202012 0.4284 62.8832
LEV 256 0.5512289 0.3360641 0.0159 2.3345 Notes: SP: share price; E: earnings per share; BV: book value per share, PROPER: proper ratings, GROWTH: sales growth; LIQ: liquidity; LEV: leverage
.
4.2 Classical Assumptions
We ran the classical assumptions tests for regression analysis and found some issues of normality,
heteroskedasticity, and autocorrelation. We use STATA package which is able to address these issues,
which are common in panel data. The Saphiro-Wilk test (Gujarati, 2004) of normality shows that all the
variables are not distributed normally (p-value < 0.05). In addition, when predicting the cook’s distance,
21 of 256 observations are found to be influential outliers. Therefore, at first those observations are retained
with the consideration that the additional hypothesis testing would be conducted by excluding the influential
outliers to test for robustness of the results. Testing for heteroskedasticity problem by using
Breusch-Pagan/Cook-Weisberg test (Gujarati, 2004), we found the p-value of less than 0.05, which indicates the
existence of heteroskedasticity problem in the model. We use robust standard errors to correct for
heteroskedasticity.
14 none of the VIF is larger than 10, thus indicate that collinearity problem does not exist among the
independent variables (Gujarati, 2004). Autocorrelation problem is tested using Wooldridge test
(Wooldridge, 2013) for autocorrelation in panel data. It is found that the p-value of the test is less than
0.05, indicates autocorrelation problem in the samples. This problem is controlled by clustering the
observation (Wooldridge, 2013).
4.3 Regression Results
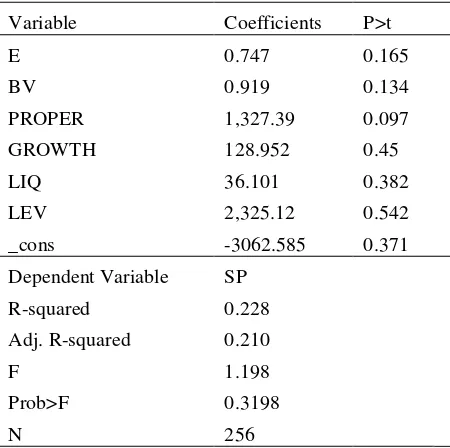
To test the hypothesis the first regression is conducted on the pooled samples. Table 2 presents the results.
It is found that the model is not significant at all (p-value = 0.3198), indicates that the independent variables
cannot explain the changes in share prices. However, reflecting on the descriptive statistics where on
average the samples are comprised of poor performers, it would be problematic to draw an early conclusion
about the results. Therefore, additional testing is conducted to refine the results.
Table 2 Regression Results for Pooled Data
Variable Coefficients P>t
E 0.747 0.165
BV 0.919 0.134
PROPER 1,327.39 0.097
GROWTH 128.952 0.45
LIQ 36.101 0.382
LEV 2,325.12 0.542
_cons -3062.585 0.371
Dependent Variable SP
R-squared 0.228
Adj. R-squared 0.210
F 1.198
Prob>F 0.3198
N 256
legend: *p<0.05; ** p<0.01; *** p<0.001
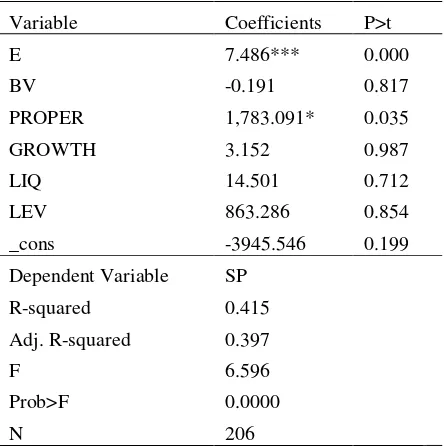
15 Given that on the descriptive statistics it is shown that there are firms with negative earnings and book
value, we argue that this negative accounting information might bias the results. Therefore, we exclude the
negative earnings and book value and rerun the test. The results are available on Table 3 below.
Table 3 Regression Results for Positive Earnings and Book Value Firms
Variable Coefficients P>t
E 7.486*** 0.000
BV -0.191 0.817
PROPER 1,783.091* 0.035
GROWTH 3.152 0.987
LIQ 14.501 0.712
LEV 863.286 0.854
_cons -3945.546 0.199
Dependent Variable SP
R-squared 0.415
Adj. R-squared 0.397
F 6.596
Prob>F 0.0000
N 206
legend: *p<0.05; ** p<0.01; *** p<0.001
After excluding negative earnings and book value, 206 observations remained. The results on Table 3
shows that the model is significant at 0.001 level (p-value = 0.000), suggests that the independent variables
are able to explain the changes in dependent variable. The adjusted R2 is 0.397 which means that 39.7% of
the changes in dependent variable can be explained by the independent variables.
Among the accounting information, it can be seen that only earnings is positive and significant (p-value =
0.000). However, the significant influence of book value to the share prices does not exist. This shows
that the market values information of accounting earnings rather than that of book value, meaning that
16 0.035). There is evidence that environmental ratings would be value relevant on companies that have better
financial performance. This is parallel to the argument that better financial performance is indicative of
firms’ capacity to better perform environmentally (Al-Tuwaijri, Christensen, & II, 2004; Bosworth &
Clemens, 2011).
A study by Clarkson et al. (2004) finds that the market favors information about capital expenditure
investment of low polluter firms but not that of high polluters. This indicates that the market could
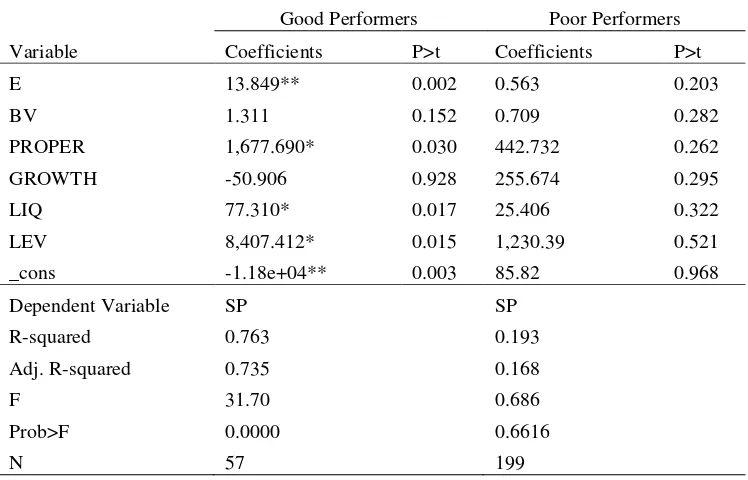
potentially value PROPER ratings of good and poor performers differently. Therefore, the third regression
analysis is conducted over the split samples to compare to examine whether the findings are consistent with
the notion. The results are shown in Table 4.
Table 4 Regression Results for Split Samples
Good Performers Poor Performers
Variable Coefficients P>t Coefficients P>t
E 13.849** 0.002 0.563 0.203
BV 1.311 0.152 0.709 0.282
PROPER 1,677.690* 0.030 442.732 0.262
GROWTH -50.906 0.928 255.674 0.295
LIQ 77.310* 0.017 25.406 0.322
LEV 8,407.412* 0.015 1,230.39 0.521
_cons -1.18e+04** 0.003 85.82 0.968
Dependent Variable SP SP
R-squared 0.763 0.193
Adj. R-squared 0.735 0.168
F 31.70 0.686
Prob>F 0.0000 0.6616
17
legend: *p<0.05; ** p<0.01; *** p<0.001
When conducting the regressions among the split samples, it is found that compared to poor performers
that comprised of 199 observations, the number of observations for good performers is reduced remarkably
to 57 observations. This means that most of the observations have PROPER ratings equal to or less than 3.
Although the poor performers outnumbered the good performers, the regression model for good performers
is significant at 0.001 level (p-value = 0.000) and gives the highest explanatory power compared to other
regressions (adjusted R2 = 73.5%).
Table 4 shows that, for good performers, earnings are positive and significant at 0.01 level (p-value =
0.002), meaning that information about earnings is still regarded as value relevant to the market, consistent
with previous results. It is also found that PROPER is positive and significant at 0.05 level for good
performers (p-value = 0.030) relative to poor performers. This confirms that the market values
environmental performance of good and poor performers differently. Two of the control variables, i.e.
liquidity and leverage are both positively significant at 0.05 level (p-value = 0.017 and 0.015 respectively).
The findings show that financial condition of good performers is valuable to the market compared to that
of their counterparts. These significant results are absence in the regression of poor performers.
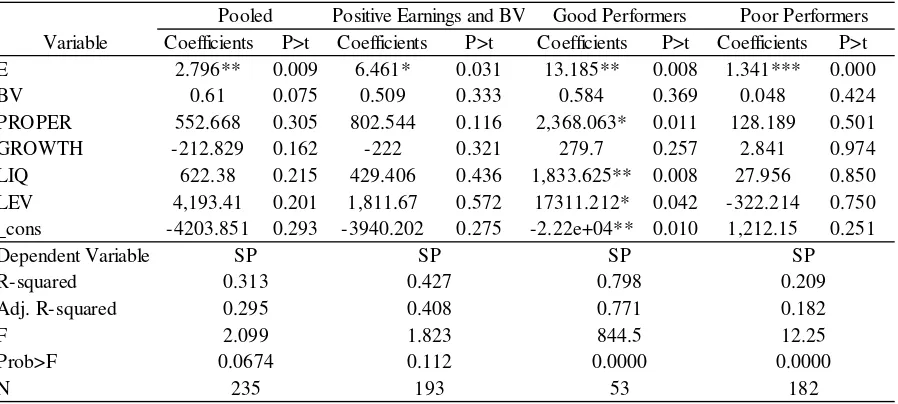
To test the robustness of the results, additional tests are conducted after excluding the influential outliers.
This exclusion reduced the sample size to 235 observations. The results on Table 5 are fairly consistent for
earnings across all the regressions, although not for PROPER. In fact, the significant result of PROPER
that exists in the previous regression on the positive earnings and book value observations is now absent.
Nevertheless, all the results from previous regressions hold when the test is conducted among good
performers. This shows that besides accounting information, information about environmental ratings is
value relevant to the market. Specifically, the market values the environmental performance of good
18 Table 5 Robustness Test
5
Conclusion, implication, and limitation
This study investigates whether corporate information of environmental performance is value relevant.
Using environmental performance ratings by Indonesia Ministry of Environment, called the PROPER
ratings, we test whether such information influences share prices in Indonesian capital market. Prior studies
from different contexts using various measures of environmental performance have resulted in mixed
findings. The use of Indonesia as an emerging economy and PROPER ratings, which indicate both negative
and positive environmental performance, are unique to this study. Such uniqueness provides significant
contribution the existing literature that reveals how financial and non-financial information are both value
relevant (Jiambalvo et al., 2002; Clarkson et al., 2004).
We use a sample of 62 firms during 2003-2012 and resulted in 256 firm-year observations as our final Variable Coefficients P>t Coefficients P>t Coefficients P>t Coefficients P>t
E 2.796** 0.009 6.461* 0.031 13.185** 0.008 1.341*** 0.000
BV 0.61 0.075 0.509 0.333 0.584 0.369 0.048 0.424
PROPER 552.668 0.305 802.544 0.116 2,368.063* 0.011 128.189 0.501
GROWTH -212.829 0.162 -222 0.321 279.7 0.257 2.841 0.974
LIQ 622.38 0.215 429.406 0.436 1,833.625** 0.008 27.956 0.850
LEV 4,193.41 0.201 1,811.67 0.572 17311.212* 0.042 -322.214 0.750
_cons -4203.851 0.293 -3940.202 0.275 -2.22e+04** 0.010 1,212.15 0.251
19 sample. Following Clarkson et al. (2004) that modified Ohlson (1995) model to find the value relevance of
environmental performance, we regressed share price with earnings (EPS) and book value (BVS), adding
PROPER ratings and other control variables commonly used in the literature, namely growth, liquidity, and
leverage.
We did not get significant result for the overall model using the pooled data. However, after excluding
firms with negative EPS and BVS, we find that PROPER, as well as earnings, are positively associated
with share price, whereas book value of equity and other financial information are not. This finding is
consistent with prior studies which find that firm’s financial performance is indicative of its capacity to
better perform environmentally (e.g., Clarkson et al., 2004; Al-Tuwaijri et al., 2004). When we split the
sample into good and poor performers, we find that such positive relationship between PROPER and share
price only exists among good performers. This confirms that the market values environmental performance
of superior and inferior performers differently.
Furthermore, we conduct four additional tests for robustness by repeating the procedures, but excluding
outliers. Similar to the prior procedure, the results show consistency in the association of earnings and share
price. However, PROPER was only significant when poor performers were excluded from the sample,
which indicates that good news regarding environmental performance are better valued by investors that
its bad news. Overall, this study confirms that “other information" does have information content.
We emphasize some limitations of this study. First, due to limited funding, PROPER only rates small
portion of listed companies, mostly those who are large and sensitive to the environment. This selection
creates potential issue in sample selection bias, because stock market could value environmental
performance of smaller and less environmentally sensitive firms. Second, we did not observe different types
of corporate environmental performance other than PROPER. Environmental events involving corporations
which are reported by the press and environmental information reported by management in the annual
reports and company websites may also contain information for investors in assessing firm value. These
20 Extensive research in this topics employed archival method using secondary data. This opens opportunities
for further investigations in this issue. The use financial analysts in an experimental or survey setting will
advance the research methodology and improving the understanding of how stock market values
environmental information. Finally, this study also offers practical implications for management and
regulators, such as the Indonesian Ministry of Environment, on the effectiveness of PROPER program. Our
finding shows that Indonesian capital market values positive rather than negative environmental ratings,
implying that the rewards mechanism seems to function better than the punishment.
REFERENCES:
Al-Tuwaijri, S. A., Christensen, T. E., & II, K. E. H. (2004). The Relations among Environmental
Disclosure, Environmental Performance, and Economic Performance: a Simultaneous
Equations Approach.
Accounting, Organizations and Society
,
29
(5,6), 447.
Ball, R., & Brown, P. (1968). An Empirical Evaluation of Accounting Income Numbers.
Journal
of Accounting Research
,
6
(2), 159–178.
Barth, M. E., Beaver, W. H., & Landsman, W. R. (1998). Relative valuation roles of equity book
value and net income as a function of financial health.
Journal of Accounting and Economics
,
25
(1), 1–34.
Barth, M. E. C., Beaver, M. F., George, F., & Kasznik, R. (1998). Brand Values and Capital Market
Valuation.
Review of Accounting Studies
,
3
(1), 41–68.
Beaver, W. H. (1968). The Information Content of Annual Earnings Announcements.
Journal of
Accounting Research1
,
6
, 67–92.
Beaver, W. H. (2002). Perspectives on recent capital market research.
The Accounting Review
,
77
(2), 453–474.
Bosworth, W., & Clemens, B. (2011). Does It Pay to Be Environmentally Responsible? Toxic
Releases and Financial Performance.
Journal of Strategic Innovation and Sustainability
,
7
(2),
115–121.
Clarkson, P. M., & Li, Y. (2004). The Market Valuation of Environmental Capital Expenditures
by Pulp and Paper Companies.
The Accounting Review
,
79
(2), 329–353.
Clarkson, P. M., Li, Y., & Richardson, G. D. (2004). The Market Valuation of Environmental by
Pulp Expenditures Valuation Paper Companies.
The Accounting Review
,
79
(2), 329–353.
Clarkson, P. M., Li, Y., Richardson, G. D., & Vasvari, F. P. (2008). Revisiting the relation between
environmental performance and environmental disclosure: An empirical analysis.
21
Decker, J. L., & Jalbert, T. (2003). An empirical analysis of where firms choose to emit and
corresponding firm performance.
Journal of American Academy of Business, Cambridge
,
3
(1/2), 190.
Endrikat, J. (2015). Market Reactions to Corporate Environmental Performance Related Events:
A Meta-analytic Consolidation of the Empirical Evidence.
Journal of Business Ethics
, 1–14.
Floros, C. (2008). The influence of the political elections on the course of the Athens Stock
Exchange 1996-2002.
Managerial Finance
,
34
(7), 479–488.
Goldar, B. (2003). Do Stock Markets Penalise Environment-unfriendly Behaviour? Evidence from
India.
Social Science Research Network Electronic Library
.
Gujarati, D. N. (2004).
Basic econometrics
(4th ed.). Boston: McGraw Hill.
Hackston, D., & Milne, M. J. (1996). Some determinants of social and environmental disclosures
in New Zealand companies.
Accounting, Auditing & Accountability Journal
,
9
(1), 77.
Hamilton, J. T. (1995). Pollution as News: Media and Stock Market Reactions to the Toxics
Release Inventory Data.
Journal of Environmental Economics and Management
,
28
(1), 98–
113.
Hassel, L., Nilsson, H., & Nyquist, S. (2005). The Value Relevance of Environmental
Performance.
European Accounting Review
,
14
(1), 41–61.
Hughes, K. E. (2000). The Value Relevance of Nonfinancial Measures of Air pollution in the
Electric Utility Industry.
The Accounting Review
,
75
(2), 209–228.
Hutchison, P. D. (1997).
An examination of the information content of a specific environmental
disclosure, Potentially Responsible Party status, in publicly held corporations
. Texas Tech
University, United States -- Texas.
Indonesia, M
inistryof E
nvironment. (2007). PROPER Program Peniliaian Peringkat Kinerja
Perusahaan dalam Pengelolaan Lingkungan Hidup.
Jiambalvo, J., Rajgopal, S., & Venkatachalam, S. M. (2002). Institutional ownership and the extent
to which stock prices reflect future earnings.
Contemporary Accounting Research
,
191
, 117–
145.
Johnson, S. D. (1995).
An analysis of the relationship between corporate environmental and
economic performance at the level of the firm
. University of California, Irvine, United States
-- California.
Konar, S., & Cohen, M. A. (2001). Does the market value environmental performance?
The Review
of Economics and Statistics
,
83
(2), 281.
Magness, V. (2003). How green pays: The impact of the environmental movement on economic
performance and share price a cross-border comparison.
CMA Management
,
76
(10), 16.
Minnis, M. (2011). The value of financial statement verification in debt financing: Evidence from
private U.S. firms.
Journal of Accounting Research
,
49
(2), 457–506.
Moneva, J. M., & Cuellar, B. (2009). The value relevance of financial and non-financial
environmental reporting.
Environmental and Resource Economics
,
44
(3), 441–456.
22