VALORISATION OF COMO HISTORICAL CADASTRAL MAPS THROUGH MODERN
WEB GEOSERVICES
M. A. Brovelli*, M. Minghini, G. Zamboni
DIIAR, Politecnico di Milano, Como Campus, via Valleggio 11, 22100 Como, Italy - [email protected], [email protected], [email protected]
Commission IV, WG IV/5
KEY WORDS: Cultural Heritage, Mapping, Services, Metadata, Open Systems, Web based, Three-dimensional
ABSTRACT:
Cartographic cultural heritage preserved in worldwide archives is often stored in the original paper version only, thus restricting both the chances of utilization and the range of possible users. The Web C.A.R.T.E. system addressed this issue with regard to the precious cadastral maps preserved at the State Archive of Como. Aim of the project was to improve the visibility and accessibility of this heritage using the latest free and open source tools for processing, cataloguing and web publishing the maps. The resulting architecture should therefore assist the State Archive of Como in managing its cartographic contents. After a pre-processing consisting of digitization and georeferencing steps, maps were provided with metadata, compiled according to the current Italian standards and managed through an ad hoc version of the GeoNetwork Opensource geocatalog software. A dedicated MapFish-based webGIS client, with an optimized version also for mobile platforms, was built for maps publication and 2D navigation. A module for 3D visualization of cadastral maps was finally developed using the NASA World Wind Virtual Globe. Thanks to a temporal slidebar, time was also included in the system producing a 4D Graphical User Interface. The overall architecture was totally built with free and open source software and allows a direct and intuitive consultation of historical maps. Besides the notable advantage of keeping original paper maps intact, the system greatly simplifies the work of the State Archive of Como common users and together widens the same range of users thanks to the modernization of map consultation tools.
1. INTRODUCTION
Advancements in digital technologies have recently cleared the way for an unprecedented usage of ancient cartography. Thanks to these innovations, old maps preserved in worldwide archives represent nowadays a precious source of information not only as simple archival documents, but also as real spatial data (Balletti, 2006). Therefore, handling historical maps in digital form is not merely important for a safe preservation of the paper originals. In fact, in addition to the cultural and artistic value, their metric content allows to insert them into modern GIS and Internet GIS systems (Gatta, 2010) for a wide range of applications, such as territorial planning, landscape and urban evolution research and archaeological studies.
Exploitation of ancient cartography in digital format requires to follow a well-defined procedure (Minghini, 2010). First step is to fully understand the nature of each map (i.e. its content, goal of the representation and surveying techniques) and to collocate it in the correct historical and cultural context in which it was produced. Next, digitization through high-resolution scanners is needed to transform map support from analogical to digital. The georeferencing process assigns then a metric reference system to the maps and provides also information about their positional accuracy. Before the web publication of georeferenced maps, another essential pre-processing step is their documentation by means of metadata (CNIPA 2006). Historical cartographies can finally be included into ad hoc web based systems for their 2D, and recently even 3D visualization. According to the interoperability paradigm, maps can be integrated with heterogeneous data coming from different sources, such as current numerical cartography, orthophotos and DTMs, in order to maximize the exploitation of their metric properties derived from georeferencing. In order to perform all the aforementioned
steps, both proprietary and open source software can be used. Previous research has basically addressed all the aspects related to the valorisation of ancient maps through the web: digitization (Buonora, 2009), georeferencing (Balletti, 2006; Livieratos, 2006), creation of metadata web catalogs (Brovelli et al., 2011a; Gatta, 2010) and development of systems for visualizing maps on the web and integrating them with current data, both in 2D (Minghini, 2010; Oreni et al., 2010) and 3D (Bitelli and Gatta, 2011; Brovelli et al., 2011b). Despite the big amount of existent studies, the resulting framework is highly heterogeneous. These researches often deal with only a single step related to maps processing and publishing, or they deal with more than one but in a separate way. Furthermore, a lot of conceptually different strategies and software (both proprietary and open source) can be identified in literature.
Against this background, the purpose of this study is to make use of free and open source software to conceive a web based system able to access georeferenced historical maps and provide their related information. The research is carried out as part of the Web C.A.R.T.E. project (Web Catalogo e Archivio delle Rappresentazioni del Territorio e delle sue Evoluzioni, Web Catalog and Archive of the Territory and its Evolutions Representations), started in 2010 in collaboration with the State Archive of Como. More specifically, the study aims to achieve the following objectives: a) to implement a web geocatalog for managing the metadata of georeferenced maps; b) to design an efficient system, both for traditional and mobile devices, which is linked to the geocatalog, and is able to optimally provide 2D navigation of maps; c) to use also a virtual globe for 3D and, considering also time, 4D maps visualization.
The paper has four parts. First, it reviews the existent literature relevant to the implementation of web geocatalogs and systems for web visualization of historical maps. Next, the data used and
their pre-processing operations are described. The systems for 2D and 3D visualization are then presented in detail. The paper concludes with a summary of the study’s contributions and directions for future research.
2. BACKGROUND
In this section, the state of the art concerning the web utilization of georeferenced historical maps will be discussed. Focus will be placed both on the management of historical maps metadata and the visualization of the same maps in 2D and 3D systems. As the project described in the paper was born within the Italian administrative and normative context, and is specifically related to it, attention will be given most to comparable studies which have been carried out in the same national context.
Metadata (literally data over data) is a documentation which is needed for spatial data acquisition, management, diffusion and search (CNIPA, 2006). According to ICCU (2006b), metadata is fundamental to even make any digital resource be significant, identifiable and accessible. Clearly, an effective interoperability between data users and systems can only be reached, if metadata are compliant with predefined standards. The documentation of Italian historical maps is currently regulated by two standards of metadata (see subsection 3.2 for details). The first conceives the maps as geographic data (CNIPA, 2006), the second considers them as simple digital images (ICCU, 2006a). The systems used to manage maps and their metadata on the web are called web geocatalogs (Minghini, 2010). Recent literature provides only few examples of metadata web geocatalogs which comply with at least one of the aforementioned Italian standards. An example is the project ‘Creare e divulgare cultura attraverso gli archivi storici’ (Gatta, 2010).
Web based systems for 2D visualization of historical maps have become very popular, and several projects have been developed by local Italian State Archives collaborating with universities. Examples are a webGIS on the Gregorian Cadastre (Buonora, 2009), Atl@nte dei Catasti Storici e delle Carte Topografiche della Lombardia (Oreni et al., 2010), CARSTOS (CARtografia STOrica Sardegna, State Archive of Cagliari), CASTORE (CAtasti STOrici REgionali, Tuscany Region) and a collection of Venice cadastral maps (Contò et al., 2009). These projects attest the high level of development of free and open source tools for web publishing historical maps. Anyway, at least three drawbacks can be highlighted. First, the systems generally lack a good interactivity with the end user, especially due to long loading times and the absence of a direct link with the geocatalog, which is often stored on independent web pages (usually the websites of State Archives). Secondly, metadata are not compiled according to the Italian standards. In particular, historical maps are almost never considered as geographic data and documented through the CNIPA standard. Finally, all these platforms do not integrate a version specifically built for mobile devices.
In contrast with the 2D case, 3D web visualization of historical maps has gained interest only in the recent past. The easiest way to three-dimensionally display 2D georeferenced maps is given by virtual globes, i.e. software allowing to explore the Earth in three dimensions while streaming satellite imagery, elevation, and other data from the Internet (Schultz et al., 2008). Also for virtual globes, both open and closed source solutions exist. Most popular open source virtual globes are gvSIG3D, Norkart Virtual Globe, ossimPlanet, osgEarth and NASA World Wind (Walker and Kalberer, 2010). On the contrary, Google Earth, Bing Maps 3D and Ovi Maps 3D are closed source solutions. Literature provides few examples of using virtual globes for the
visualization of historical maps. In particular, no Italian State Archive has yet implemented a 3D ad hoc web visualization of its full cartographic heritage. The use of virtual globes is instead restricted to studies on peculiar maps and for peculiar aims (e.g. Bitelli and Gatta, 2011; Brovelli et al., 2011b). The first of these researches makes use of the popular Google Earth, which is also exploited as 3D viewer by a number of historical libraries, such as the Cartography Associates David Rumsey Map Collection. The second study uses instead the NASA World Wind Virtual
About 15000 maps corresponding to 246 current municipalities are preserved at the State Archive of Como. These maps belong to different historical cadastral series: a) the Theresian Cadastre (XVIII century); b) the Lombardo-Veneto Cadastre (mid-XIX century) with c) its updates of 1898; d) the New Lands Cadastre (1905). In 2010 the State Archive of Como renewed its digital collection promoting a high-resolution digitization campaign of the maps. Hence, the Web C.A.R.T.E. project was started in order to valorise this cartographic heritage using the latest free and open source web technologies.
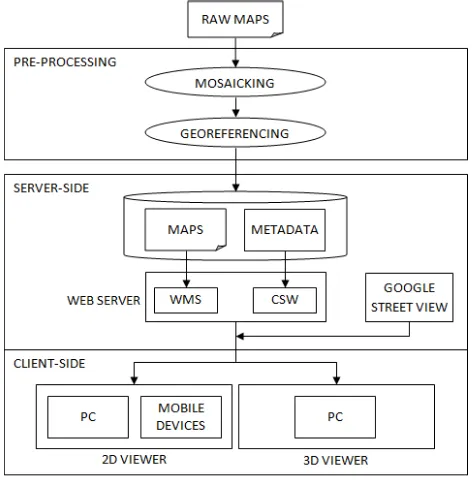
The maps of each cadastral series were originally surveyed and drawn independently for each municipality. These maps are also available as divided into a variable amount of adjacent cadastral sheets, depending on the municipality size. As shown in Figure 1 representing the architecture of the whole system, a geometric pre-processing of maps justified by a number of considerations (Brovelli et al., 2012) was performed. The first pre-processing step consisted of a mosaic of all the sheets, for each municipality and for each cadastral series. The new mosaicked maps were then georeferenced through an ad hoc polynomial-based procedure, in which the optimal polynomial order to be used is determined according to statistical remarks (Brovelli et al., 2012). As maps have to be later documented by means of metadata (see subsection 3.2) and inserted into GIS applications (see subsections 4.1 and 4.2), their accuracy was determined by quantitatively evaluating georeferencing results.
3.2 Implementation of a metadata web geocatalog
The two types of data which will constitute the online collection of the State Archive of Como, i.e. individual digitized cadastral sheets and mosaicked georeferenced maps, must be documented in terms of metadata. As mentioned above, two Italian standards currently deal with the context of historical maps.
The first one is an Italian customization of ISO 19115:2003 Geographic Information - Metadata (ISO/TC211, 2003), which was chosen as a reference for the national Repertorio Nazionale dei Dati Territoriali (National Inventory of Territorial Data) established by CNIPA (2006). Particularly, a minimum set of metadata, the so-called ‘Core Metadata’, was defined in order to describe any geographic data (including historical maps) owned by Italian institutions. ‘Core Metadata’ are grouped into classes providing information about metadata, data identification, data reference system, data quality (in which map accuracy has to be specified), data constraints, data origin and production process and data distribution. According to CNIPA standard, every set of data is conceived in a hierarchical way and metadata have to be applied at three levels: datasets, series (sets of datasets which
have some common characteristics) and sections (subsets of the same datasets which again share some properties). This schema has to be customized for the specific case to which it applies. Therefore, series can be referred to complete products, datasets to distinct entities constituting a series of data, while sections to the smallest units in which a product is provided. Datasets inherit some metadata from the series they belong to, in the same way that the common information between sections derives from their same dataset. CNIPA standard was applied, documenting each cadastral production (Theresian, Lombardo-Veneto, etc.) as series and the georeferenced mosaicked maps of each municipality as datasets. Concerning the single map sheets, which were simply digitized but not georeferenced, the initial approach (Brovelli et al., 2011a) was to use again the CNIPA standard and to consider them as sections (common dataset is the municipality they belong to).
Digitized map sheets are indeed an example of scanned maps, for which another Italian standard exists. This was defined by ICCU (2006a) with the specific purpose of standardizing the management and preservation of the ancient documents owned by all the national State Archives, museums and libraries. This standard, named MAG (Metadati Amministrativi e Gestionali, Administrative and Management Metadata) was therefore the most suitable to be used for map sheets documentation. MAG is an XML-based application profile associated to the digital resource as a whole (ICCU, 2006b). It is an open standard, documented, freely available and fully hardware and software platforms independent. MAG standard consists of several metadata sections, which are usable according to the content of the corresponding data. The most important section includes descriptive metadata, for which the international Dublin Core profile is used. This is the world’s most widespread metadata standard thanks to its flexibility and simplicity, as it is composed by only 15 elements.
To build up the web geocatalog for the State Archive of Como (see the server-side component of system architecture in Figure 1), the selected software tool was GeoNetwork Opensource.
Figure 1. Architecture of the system
GeoNetwork is a free and open source application which implements a number of international and open standards for services and protocols (e.g. from ISO/TC211 and OGC). In
particular, GeoNetwork natively handles both ISO 19115 and Dublin Core metadata standards. It also supports the CSW (Catalog Service for the Web) protocol (Open Geospatial Consortium, 2007), which is useful to access maps metadata directly from the webGIS system (see subsection 4.1). To correctly produce maps metadata, ISO and Dublin Core profiles were initially translated and customized, according to CNIPA ‘Core Metadata’ and ICCU indications, respectively. The entire software was then translated and recently provided as its official Italian version, which should be contained in the next 2.8 release. By means of an easy to use web interface, the web geocatalog allows State Archive users to search, access and manage metadata in a practical and fast way. This, in turn, makes data searchable and accessible online, as required by the European INSPIRE Directive (European Parliament, 2007).
4. 2D AND 3D WEB VISUALIZATION
4.1 WebGIS systems for maps 2D visualization
Two different webGIS systems were built for cadastral maps 2D web visualization (see the 2D client-side component of system architecture in Figure 1): the first for usual computers, the second optimized for mobile devices (tablets, smartphones, etc.). In both cases, the server-side software was MapServer, a powerful open source platform for publishing spatial data and interactive mapping applications on the web. MapServer allowed to visualize the historical cadastral maps through the OGC standard WMS (Web Map Service).
The first client was built with the purpose of comparing cadastral maps either with each other or with current cartography. The software used was MapFish, a JavaScript-based framework which combines ExtJS for web pages customization, OpenLayers for geographic data management and GeoExt for developing advanced web mapping applications. The client built with these tools consists of a layer menu and two map panels (see Figure 2). In the layer menu, the layer trees corresponding to both the panels are stored. Each of them shows the list of municipalities and their available maps, which can be viewed as more or less opaque thanks to a transparency slider. In the two map panels, selected cadastral maps are superimposed on an OpenStreetMap base layer. The comparison between maps visualized in the two panels is favoured by their corresponding toolbars. The toolbar located in the first map panel offers navigation controls for the simultaneous management of both the maps (e.g. a zoom or pan request is valid for both the panels). Conversely, the toolbar located in the second panel only allows to navigate the map represented in it. An alignment control gives also the possibility to exactly line up the two panels on the same geographic area (see Figure 2). Right-clicking on a map in the layer tree, users can access its metadata through a CSW request. An XML file containing the metadata is returned. After its parsing, metadata are shown into a dedicated pop-up window, which contains also the link to the corresponding map page of the web geocatalog. A link inside the client allows to access another 2D application, which enables to display historical maps together with Google Street View panorama (see the server-side component in Figure 1). This web page (see Figure 3), developed with GeoExt libraries, is first of all composed of a layer tree for the selection of historical maps. The chosen map is displayed in the first map panel and superimposed, with a default level of opacity, to the Google cartography streets whose panorama is available. Clicking on one of these streets, the corresponding panorama is visualized in the Street View panel. The navigation of panorama
(meant as both the planimetric movement along a street and the change in orientation) can be performed by acting on any of the two panels. This application proved to be very useful, as it enables an immediate analysis of buildings state of preservation, highlighting e.g. if an ancient building represented in the map is still today existing, or if it has been restored or even demolished.
The second client was specifically developed for mobile devices (tablets, smartphones, etc.). Again OpenLayers for the mapping part, together with jQuery libraries for customizing the page graphics, were now used. In fact, OpenLayers last releases made available new navigation controls handling map browsing with touch events (dragging, double-tapping, tap with two fingers and pinch zoom). The client consists of a full-screen map panel and a bottom menu (see Figure 4).
With the command Localizza (Locate), the estimated position of
the device is represented on the map. The Layer menu allows to access the list of available historical maps (served again through WMS by MapServer) and turn them on/off. Selecting Proprietà Layer (Layer Properties), users can request the layer metadata (again through CSW protocol), zoom to the layer extent and set its opacity. The Cerca (Search) button allows to search for a specific location on the map, while Info provides information about the application. The client represents a prototype of web mapping cartographic application and it was successfully tested on Apple iOS (iPhone and iPad) and Android devices.
Summarizing, the overall system for 2D web visualization is able to organize the State Archive of Como historical maps for an easy consultation, efficiently navigate them (also with touch-screen commands for mobile devices) and immediately retrieve their metadata through the link to the web geocatalog.
Figure 2. 2D visualization of Theresian (left) and Lombardo-Veneto (right) cadastral maps in the web client for computers
Figure 3. Example of integration between a Lombardo-Veneto cadastral map and the current Google Street View panorama
Figure 4. 2D visualization of a Theresian cadastral map in the web client for mobile devices
4.2 System for maps 3D web visualization
3D visualization of historical maps, which is part of the client-side component of the system (see Figure 1), was implemented using the NASA World Wind Virtual Globe. In particular, a Java Applet was inserted into an html page accessible from the previous 2D interface. World Wind Java (WWJ) Software Development Kit (SDK) provides a pool of components in order to deploy 3D web visualization of spatial information as Java Application, Java Applet or Java Web Start Application. This means that one or more windows showing 3D contents can be placed into a GUI (Graphical User Interface). In addition, other components are available in order to represent the shape of the planet, to overlap geospatial information (i.e. the layers), to set the scene rendering and to interactively control the user’s view. The system makes directly available a default collection of preconfigured layers, in order to project satellite images (Landsat 7, Blue Marble, USGS Ortho-Topo, etc.) and Digital Terrain Models (SRTM, ASTER, USGS NED, etc.) on the globe. They are dynamically served as WMSs by NASA and United States Geological Survey (USGS). Moreover, on the globe and in its surrounding space, it is possible to place both 2D objects like lines, polygons, markers, call-out, etc., and 3D objects like parallelepipeds, spheres, extruded polygons, etc. (Brovelli and Zamboni, 2011).
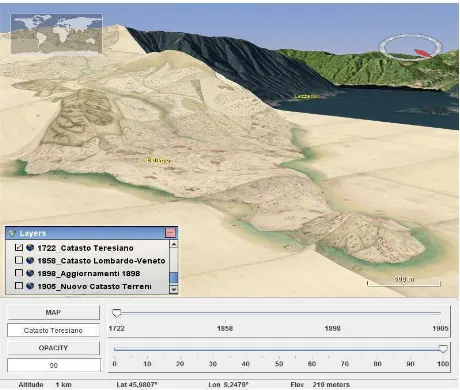
Historical maps are read from the same WMS server which was used for 2D publication. In order to simplify the configuration of these layers (also in the perspective of a future updating of the system by non-expert personnel), a functionality was implemented, which is able to read the list of maps to be included in the 3D interface from an easily editable text file stored on the server side. The 3D viewer allows to directly overlap the historical maps on both the local orthophoto and DTM, i.e. the national orthophoto with pixel resolution of 0.5 m and the Lombardy Region DTM with ground resolution of 20x20 m. Users can three-dimensionally navigate the maps and visualize at the same time the position information, i.e. latitude, longitude, elevation of a point on the globe and altitude of the point of view (see Figure 5). A temporal slidebar was then introduced, in order to simplify the analysis of the peculiar project data typology, that is cadastral series maps dating back to precise historical epochs. Introducing the temporal variable, the slidebar makes the viewer become 4D. In fact, specifying the dating of each map (through the same layer configuration file), the software is capable of synchronizing the visualization of maps with the temporal point in time given by the slidebar cursor. When a historical epoch is selected on the slidebar, all the maps which were existing up to that time are automatically
turned on in their same temporal order (a map dating to time t+1 lays over a map dating to time t). A second slidebar was implemented, in order to regulate map opacity. This controller allows users to visualize either a single map (opacity 100) or more overlapping maps (0<opacity<100). Historical maps can thus be compared both with each other and with the base orthophoto. Hence, this temporal map navigation (based on cadastral series) integrates the simply spatial one (based on municipality regions) described in the 2D case. In fact, even in the classic layer controller (which was maintained into the GUI), map activation is based on the time instead of the belonging municipality.
Figure 5. 3D visualization of Theresian cadastral map selected through the temporal slidebar
5. DISCUSSION AND CONCLUSIONS
This study experienced the use of free and open source software related to the web publication of historical cartography. In the frame of the Web C.A.R.T.E. project (Web Catalogo e Archivio delle Rappresentazioni del Territorio e delle sue Evoluzioni), the implementation of web technologies was aimed at valorising the valuable collection of cadastral maps preserved at the State Archive of Como. To our knowledge, it is the first research that specifically investigates the use of free and open source tools to built a complete system for web distribution of historical maps. A system for maps 2D visualization was first created. Although many similar applications can be found in literature (e.g. Contò et al., 2009; Oreni et al., 2010), several notable improvements can be highlighted. The first is the presence of a dedicated web geocatalog, in which maps metadata are stored and can be easily searched and accessed. Metadata are compliant with current Italian standards dealing with historical maps (CNIPA, 2006; ICCU, 2006b). Particularly, implementation of CNIPA standard represented a major innovation, as literature often considers ancient cartography as pure archival documentation and not as real georeferenced data. The link between the webGIS system and the web geocatalog, built using the CSW standard, provided the application with a high degree of interactivity, as users can navigate maps and immediately get their metadata. In addition, a new application was built, exploiting the panorama of Google Street View to analyze buildings preservation during time. Historical maps 2D visualization was also extended to mobile devices. Keeping the server-side platform unchanged, an historically-oriented application with no precedent in literature
was built to make maps navigable even with touch commands. Finally, a module for maps 3D visualization was integrated into the system. The use of an open source virtual globe allowed a full customization of the viewer, which became 4D thanks to a temporal slidebar. Drawbacks of the traditional closed source virtual globes (especially Google Earth), which do not presently allow such customization, were overcome.
This research provides strong empirical support for the potential use of free and open source software in the context of historical cartography. As a matter of fact, their free availability and code openness allows to easily customize the applications according to the needs. More specifically, map users at the State Archive of Como should highly benefit from the developed system. The user-friendly and interactive tools, together with the web access (also from mobile devices) to historical maps, should not only simplify the work of traditional users (scholars and historians), but favour also an enlargement of the same range of users. The main limitation of the study might be related to the fact that the overall system will have to be finally managed and updated by the State Archive of Como, whose personnel is likely to be not familiar with the software used and not endowed with sufficient skills to autonomously modify the source code. Future work should thus develop simplified managing procedures (for instance, to add a new map and the corresponding metadata), in order to facilitate the personnel’s work as much as possible. The module for 3D visualization can also be improved, in order to be better integrated into the overall web based system. Future work should first of all enable a synchronization between maps 2D and 3D visualization, in such a way that, moving from one to the other, both the displayed data and geographic area could be the same. The 3D viewer enrichment through a CSW link to the geocatalog and a dedicated version for mobile devices offers also fruitful avenues for future research. Despite the fact that the functioning of the system appears to be good, a quantitative evaluation of its performance will be finally taken into account after the conclusion of current implementing phase.
REFERENCES
Balletti, C., 2006. Georeference in the analysis of the geometric content of early maps. e-Perimetron 1(1), pp. 32-42.
Bitelli, G., Gatta, G., 2011. Digital Processing and 3D Modelling of an 18th Century Scenographic Map of Bologna. In: Advances in Cartography and GIScience. Volume 2. Springer Berlin Heidelberg, pp. 129-146.
Brovelli, M.A., Minghini, M., Valentini, L., 2011a. Web Services and Historical Cadastral Maps: the first Step in the Implementation of the Web C.A.R.T.E. System. In: Advances in Cartography and GIScience. Volume 2. Springer Berlin Heidelberg, pp. 147-161.
Brovelli, M.A., Valentini, L., Zamboni, G., 2011b. Multi-dimensional and multi-frame web visualization of historical maps. In: Proceedings of the 2nd ISPRS workshop on Pervasive Web Mapping, Geoprocessing and Services, Burnaby, British Columbia, Canada.
Brovelli, M.A., Zamboni, G., 2011. EST-WA: a doxel-based tool for web visualization of environmental variables. In: Geospatial World Forum Dimensions and Directions of Geospatial Industry Conference Proceedings, Hyderabad, India.
Brovelli, M.A., Minghini, M., Giori, G., Beretta, M., 2012 (in press). Web geoservices and ancient cadastral maps: the Web C.A.R.T.E. project. Transactions in GIS.
Buonora, P., 2009. Digitization, online utilization and preservation of cadastral very large format cartography. e-Perimetron 4(3), pp. 192-198.
CNIPA (Centro Nazionale per l’Informatica nella Pubblica Amministrazione), 2006. Repertorio Nazionale dei Dati Territoriali - Linee Guida per l’applicazione dello standard ISO 19115 Geographic Information - Metadata, v. 0.3, Rome.
Contò, F., Fanello, G., Pillon, M., 2009. An information system for historical Cadastre of Venice. e-Perimetron 4(4), pp. 240-246.
Gatta, G., 2010. Valorizzazione di cartografia storica attraverso moderne tecniche geomantiche: recupero metrico, elaborazione e consultazione in ambiente digitale. PhD thesis, Università di Bologna, Italy.
ICCU (Istituto Centrale per il Catalogo Unico delle biblioteche italiane e per le informazioni bibliografiche), 2006a. Linee guida per la digitalizzazione del materiale cartografico, Rome, Italy.
ICCU (Istituto Centrale per il Catalogo Unico delle biblioteche italiane e per le informazioni bibliografiche), 2006b. MAG Metadati Amministrativi e Gestionali - Manuale Utente, Rome, Italy.
Livieratos, E., 2006. On the study of the geometric properties of historical cartographic representation. Cartographica 41(2), pp. 165-175.
Minghini, M., 2010. Trasformazioni cartografiche, geocatalogo e servizio web di visualizzazione dei catasti storici di Como. Graduation thesis, Politecnico di Milano, Italy.
Open Geospatial Consortium, 2007. OpenGIS Catalogue Services Specification.
Oreni, D., Brumana, R., Scaioni, M., Prandi, F., 2010. Navigating on the past, as a bird flight, in the territorial scale of historical topographic maps. WMS on the “Corografie delle Province del Regno Lombardo-Veneto”, for accessing cadastral map catalogue. e-Perimetron 5(4), pp. 194-211.
Schultz, R.B., Kerski, J.J., Patterson, T.C., 2008. The use of virtual globes as a spatial teaching tool with suggestions for metadata standards. Journal of Geography 107(1), pp. 27-34.
Walker, M., Kalberer, P., 2010. Comparison of open source virtual globes. In: FOSS4G 2010 presentations, Barcelona, Spain.
ACKNOWLEDGMENTS
The authors would like to thank the State Archive of Como, particularly Dr. Lucia Ronchetti, for providing the maps used in the study. The research was partially supported by grants of the ‘Fondazione Provinciale della Comunità Comasca Onlus’ in the frame of the Web C.A.R.T.E. project (Web Catalogo e Archivio delle Rappresentazioni del Territorio e delle sue Evoluzioni).