Guidance and
Counselling
G
C
&
Volume
19
Number
2
December
2009
G
C
&
Contents
Editorial________________________________________________________iii Marilyn Campbell
Articles
‘Just Try Harder and You Will Shine’: A Study of 20 Lazy Children ________95
Linda Gilmore and Gillian Boulton-Lewis
To WPPSI or To Binet, That Is the Question. A comparison of __________104
the WPPSI-III and SB5 With Typically Developing Preschoolers
Melinda Garred and Linda Gilmore
Can Implementation of a Resilience Program for Primary School __________116
Children Enhance the Mental Health of Teachers?
Orla Tyson, Clare M. Roberts and Robert Kane
Cognitive training, conflict resolution and exercise: Effects on young ______131
adolescents’ wellbeing
Mark Taylor, Robyn M. Gillies and Adrian F. Ashman
Identifying the Learning Development of Students Who Are Refugees ____150
Donna Tangen
Cultural Factors Relevant to Secondary School Students in Australia, ______161
Singapore, the Philippines and Indonesia: Relative Differences and Congruencies
Gregory Arief D. Liem, Andrew J. Martin, Elizabeth Nair, Allan B.I. Bernardo, and Paulus Hidajat Prasetya
Reducing the Risk of Posttraumatic Stress Disorder in Children __________179
Following Natural Disasters
Heather Mohay and Nicole Forbes
Coping in the Cyberworld: Program Implementation and Evaluation ______196
– A Pilot Project
Cecilia Wing Chi and Erica Frydenberg
Part-Time Work of High School Students and Impact on Educational ______216
Outcomes
Wendy Patton and Erica Smith
161
Address for correspondence:Dr. Gregory Arief D. Liem, Faculty of Education and Social Work, A35 — Education Building, University of Sydney NSW 2006, Australia. E-mail: [email protected]
▲
▲
Secondary School Students in
Australia, Singapore, the Philippines
and Indonesia: Relative Differences
and Congruencies
Gregory Arief D. Liem,1Andrew J. Martin,1Elizabeth Nair,2Allan B.I. Bernardo3
and Paulus Hidajat Prasetya4
1University of Sydney, Australia
2Work and Health Psychologists, Singapore
3De La Salle University, the Philippines
4Maranatha Christian University, Indonesia
W
aldrip and Fisher (2000) proposed seven culturally relevant factors that are salient in the educational setting (gender equity, collaboration, com-petition, deference, modelling, teacher authority, congruence). In relation to these factors, the present study examined differences and congruencies in factor structure (i.e., differences of kind) and mean scores (i.e., differences of degree) among secondary school students in Australia, Singapore, the Philippines and Indonesia. The Cultural Learning Environment Questionnaire (CLEQ; Waldrip & Fisher, 2000) was administered to 920 students (n = 230 for each country, with boys and girls equally represented; mean age = 16 years). Factor analyses showed congruencies across the four samples on five factors. Interestingly, items pertaining to students’ deference to and modelling of teachers and peers grouped into one factor for the Australian sample, but separated into two factors (peers and teacher) for the South-East Asian samples. In terms of mean scores on each factor, Australian students were higher than the Singaporean, Filipino and Indonesian students in their inclination to challenge or disagree with the teacher. On the other hand, the three groups of South-East Asian students scored higher than the Australian stu-dents in their preferences for collaboration and conformity in the classroom. Implications for counselling relevant to multicultural classroom and school contexts were discussed.Multicultural classrooms and schools are increasingly prevalent (Banks, 2009; Gollnick & Chinn, 2009; Gurung & Prieto, 2009; Stanat & Christensen, 2006). In New South Wales (Australia), for example, a recent figure indicated that 215,788 students (or 28.8%) enrolled in government schools were identified as being of language background other than English, or LBOTE (NSW Department of Education and Training [NSW DET], 2009). These LBOTE students were mainly of Arabic, Chinese (Cantonese and Mandarin), Greek, Hindi, Italian, Korean, Samoan, Spanish, Tagalog, and Vietnamese backgrounds, with smaller numbers representing at least 25 other language backgrounds (NSW DET, 2009). As for international enrolments, their number has also gradually increased each year. For example, the number of international students in government schools in NSW underwent a 29.4% increase between 2007 and 2008 (NSW DET, 2008).
Multicultural classrooms are both a challenge and an opportunity for teaching and learning processes and outcomes — and by implication, for counsellors who seek to facilitate student outcomes (Ballard & Clanchy, 1991; Hofstede, 1986; Liem, Nair, Bernardo, & Prasetya, 2008). On the one hand, multicultural educa-tion can be an opportunity for training and developing all students’ intercultural learning, awareness and competence (Heyward, 2002). On the other hand, differ-ences in values, beliefs and social norms reflect the complexity facing teachers and counsellors in fostering learning environments that are pedagogically effective while culturally sensitive to all members of the school (Banks, 2009; Gurung & Prieto, 2009; Liem et al., 2008; Paige, Lange, & Yeshova, 1999).
The present research explores the extent to which there are differences of kind and/or degree on educationally relevant cultural factors among Australian and South-East Asian (Singapore, the Philippines and Indonesia) secondary school stu-dents. Differences of degree would suggest that Australian students score higher or lower than their South-East Asian counterparts on target cultural factors in the classroom, as assessed by examining mean-level effects. Differences of kind would suggest that Australian and South-East Asian students are qualitatively different in their perceptions of target cultural factors in the classroom, as assessed by examin-ing factor structure across the countries. As discussed below, these findexamin-ings hold counselling implications for multicultural classrooms and schools in Australia — and beyond.
Between-Country Differences on Cultural Dimensions
Culture plays an influential role in personality (Hofstede & McCrae, 2004; Triandis & Suh, 2002), social behaviour (Triandis, 1994) and wellbeing (Oishi & Diener, 2003). To understand the influence of culture on these behavioural and psychological outcomes, culture needs to be ‘unpacked’ (Rohner, 1984). One sig-nificant effort towards unpacking culture is that articulated by Hofstede (1980, 1991, 2001), who proposed four core dimensions underpinning culture. First, individualism–collectivism (IC) contrasts cultures in which individuals are more inclined to look after their own wellbeing, enhancement and interests from those in which individuals are more inclined to prioritise the wellbeing, enhancement and interests of the group. Second, power distance (PD) concerns the extent to which
162
members of a culture, especially those less powerful in the society, accept power and status inequalities. Third, uncertainty avoidance (UA) pertains to the extent to which members of a culture are made anxious by situations that are perceived to be unstructured and which they therefore try to avoid. Fourth, masculin-ity–femininity (MF) proposes cultures in which individuals strive for optimal dis-tinction between what men and women should do from those in which the social roles across sexes are expected to be equal.
Hofstede (1980, 1991, 2001) found that many countries differ on each of these four cultural dimensions. Based on Hofstede’s (1991, 2001) analysis, the four countries included in the present study (Australia, Singapore, the Philippines and Indonesia) are found to be variously similar and distinct on different cultural dimensions. For example, Australia (and similar countries such as Canada, New Zealand, the United Kingdom, and the United States) is characterised as individual-ist and low in power dindividual-istance. In contrast, collectivindividual-ist countries are typically those that are large in power distance; the three South-East Asian countries in this study fall into this category. Interestingly, however, these demarcations are not as clear-cut for uncertainty avoidance and masculinity–femininity dimensions (Hofstede &Vunderink, 1994). For example, based on Hofstede’s (1991, 2001) findings, Australia and the Philippines are identified as being moderately masculine, whereas Singapore and Indonesia are found to be moderately feminine. On the uncertainty avoidance continuum, whereas Singapore is characterised as very weak, Australia, the Philippines and Indonesia are moderately weak (Hofstede, 1991, 2001). The present study is an opportunity to examine these issues in the educational context, focusing on core dimensions salient and influential in secondary school. It does so via the administration of the Cultural Learning Environment Questionnaire, or CLEQ (Fisher & Waldrip, 1997, 1999, 2002; Waldrip & Fisher, 2000, 2007).
Operationalising Hofstede’s Cultural Framework
in the Educational Context
For the purposes of operationalising Hofstede’s cultural framework in the teaching and learning context, Fisher and Waldrip (1997, 1999, 2002; Waldrip & Fisher, 2000, 2007) proposed seven educationally relevant factors: gender equity, collabo-ration, competition, deference, modelling, teacher authority, and congruence. These factors are assessed using the CLEQ (Fisher & Waldrip, 1997, 1999, 2002; Waldrip & Fisher, 2000, 2007), which was developed with the intention of measur-ing those cultural factors in the classroom that are the behavioural and perceptual manifestation of Hofstede’s (1986, 1991, 2001) framework. Hence, the CLEQ factors are those pertaining to students’ perceptions of student/student and student/teacher classroom interactions, including the extent to which students per-ceive equality in ability between male and female classroom members; the extent to which students prefer to collaborate or compete with their classmates; the extent to which students are inclined to defer to and model other classroom members (both peers and teachers); and the extent to which students perceive that they should submit to the teacher’s authority in their classroom interactions. Additionally, the CLEQ measures students’ perceptions of the degree to which there is congruence in
the structure of school and home learning environments such that what they learn at the school helps them learn at home, and vice versa.
The Present Study
The overarching purpose of the present investigation is to examine the extent to which secondary school students in Australia, Singapore, the Philippines and Indonesia differ or concur in their perceptions of the cultural factors of the class-room conceptualised in the CLEQ. Two central research questions are posed. First, what are the similarities and differences among Australian, Singaporean, Filipino and Indonesian secondary school students in the way they construe cultural factors relevant to the classroom? In this respect, we aimed to examine the factor structure of the CLEQ for each cultural group, and address the question of whether the four cultural groups are different or similar in the cultural factors they construe (differ-ences of kind). This is assessed using factor analysis. Second, to what extent are the cultural factors endorsed similarly or differently across cultures? In this regard, we examined the extent to which secondary school students in the four countries differ or are similar in their mean scores on cultural factors (differences of degree). This is assessed by comparing mean scores on each CLEQ factor between Australia and each of the three South-East Asian countries.
Based on prior validation of the CLEQ (see Waldrip & Fisher, 2000), we hypoth-esised that students across the four cultures will discriminate between seven cultur-ally sensitive factors of the classroom environment underlying the CLEQ (gender equity, collaboration, competition, deference, modelling, teacher authority, congru-ence). However, based on our review of Hofstede’s (1986, 1991, 2001) work, we anticipated differences and similarities in the degree of endorsement of the seven cultural factors. Specifically, we hypothesised that: (1) Australian students will be higher than Singaporean, Filipino and Indonesian students on their preference for competition; (2) South-East Asian students will be higher than Australian students on their preference for collaboration, inclination to defer to and model classroom members (peers and teachers), inclination to submit to the teacher’s authority in the classroom, and perception of congruence between what they learn at school and at home; and (3) Australian students will be higher than Singaporean and Indonesian counterparts on their perception of gender equity in ability, although we expected no difference between Australian and Filipino students on this factor.
Relevance to Counselling
As described earlier, many Australian schools and classrooms are multiculturally diverse. There is a strong representation of students from minority backgrounds, especially those from Asian backgrounds. This phenomenon is associated with the rise of ‘involuntary’ migration resulting from politically and socially unstable coun-tries (Stanat & Christensen, 2006) and the growth of voluntary migration from many other countries (Ballard & Clanchy, 1991; Liem, 2007). Inevitably, students will bring with them a set of values, beliefs and norms that are rooted in their respective cultural backgrounds and identities. It is important for counsellors who
164
seek to facilitate these students’ academic and non-academic development to understand the cultural context from which these students emanate, and to identify areas of difference and congruence across such cultures in order to accommodate them in the guidance and counselling process. At a broader level, the juxtaposition of Australian and Asian data on the ways students perceive their classroom helps counsellors and counselling researchers better understand the Australian classroom and better shapes their efforts in assisting culturally diverse students to adapt edu-cationally, psychologically and socioculturally.
Method
Participants
Four parallel samples (N = 920) of Year 10 (or its equivalence) students were
drawn from coeducational government secondary schools in Sydney (Australia), Singapore, Manila (the Philippines) and Jakarta (Indonesia). Each sample
com-prised 230 students; boys and girls were equally represented (Nboys = 115; Ngirls =
115). The average age was comparable across the four samples (± 16 years).
Participants were included in the sample only if they were born or had lived in their respective country for at least 10 years, and if they were a citizen of the country where they resided.
Instrument
The CLEQ was developed to examine seven culturally relevant factors in the class-room. The seven five-item CLEQ subscales and their Cronbach’s alpha internal consistency reliability for the Australian, Singaporean, Filipino and Indonesian
stu-dents, respectively, are as follows: (1) gender equity (α= .76, α= .78, α = .72, α =
.50; e.g., ‘I think that both females and males make excellent teachers’); (2)
collab-oration (α = .72, α = .73, α = .61, α = .74; e.g., ‘I like to work with other
stu-dents’); (3) deference (α= .63, α= .47, α= .55, α= .35; e.g., ‘I try to say what the
class thinks rather than give my own opinion’); (4) competition (α= .87, α= .77, α
= .84, α = .78; e.g., ‘I like to compete against the other students’); (5) teacher
authority (α= .79, α= .72, α= .84, α= .57; e.g., ‘It is OK for me to disagree with
teachers’); (6) modelling (α = .59, α = .48, α = .57, α = .61; e.g., ‘I like to have
teachers tell me how to work in class’); and (7) congruence (α= .77, α= .77, α =
.82, α = .79; e.g., ‘What I learn at home helps me to do things at school’). To
respond to the CLEQ items, participants were provided with a 5-point Likert scale
ranging from 1 (Disagree) to 5 (Agree).
Based on Nunnally’s (1967) cut-off value for Cronbach’s alpha coefficients (α >
.60), or even its revised cut-off value (α≥.70; Nunnally, 1978), the alpha estimates
reported above indicated that five out of the seven subscales (gender equity, collab-oration, competition, teacher authority, and congruence) were reasonably reliable
for use with the Australian, Singaporean and Filipino samples (α≥ .72 for the five
subscales across these three cultural groups except one, collaboration, with an αof
.61 for the Filipino sample). For the Indonesian sample, however, two of the five subscales, gender equity and teacher authority, had relatively low internal
consis-tency (α= .50 for gender equity and α = .57 for teacher authority). The other two
subscales (deference and modelling) were not as internally consistent as the other
five subscales (αs ≤ .63 across the four cultural groups). Thus, substantiating one
of the purposes of the present study (i.e., to ascertain the cultural factors construed by students across different cultures), these patchy reliability findings underscore the importance of examining the CLEQ factor structure for each cultural group.
Procedure
The CLEQ was administered along with a set of other measures and questions probing students’ demographic information (e.g., age, gender) in a classroom setting. To ensure that participants’ gave truthful answers, it was emphasised that their responses would be anonymous and would not affect their school grades. Participants were also told that there were no right or wrong answers to any of the questions, and that honest responses were of great importance in the study. The English version of the CLEQ was administered to the Australian, Singaporean and Filipino samples, as English is the medium of instruction at the schools in Singapore and the Philippines. However, because Bahasa Indonesia (BI) is the mother tongue of the Indonesians and the medium of instruction in Indonesian educational settings, the BI version of the CLEQ was developed. The development of the BI-CLEQ was carried out through a rigorous translation and back-transla-tion procedure (see Van de Vijver & Poortinga, 2005), in close consultaback-transla-tion with one of the original authors of the instrument (B. Waldrip, personal communication, December 2001). The very first validation study of the BI measures was carried out with a group of 482 Indonesian Year 10 students prior to the present study (see Liem, 2006).
Statistical Analyses
Principal Component Analysis
To ascertain the cultural factors construed by students in each of the four cultural groups, we performed a series of principal component analyses (PCAs) with each of the four culture-specific data sets. Following Burnett and Dart (1997), the start-ing number of factors or components to be extracted in validatstart-ing the factor struc-ture of an existing scale is one that is originally hypothesised to represent the scale. Following the procedure in validating the CLEQ (Fisher & Waldrip, 1997, 1999, 2002; Waldrip & Fisher, 2000, 2007), a 7-factor PCA with a promax (oblique) rotational method was implemented. Four criteria were set for the inclusion or exclusion of items into or from a factor:
1. Consistent with Stevens (1992), only items with a factor loading > .40 are considered as part of a factor.
2. In a case of ‘cross-loading’ (i.e., if an item loads onto its a priori factor and cross-loads onto another factor with factor loadings of > .40), the content of the item must be examined to determine whether or not it has a secondary meaning.
3. If an item is separated from its hypothesised or a priori co-items and loads > .40 onto another factor, the content of such an item must be examined to consider whether it has a substantive meaning in relation to the new factor. If it is deemed that there is no substantively interpretable meaning, this
166
might suggest unreliability of the item (e.g., inadequacy of the item content) for the sample.
4. If a factor is comprised of items derived from two or more different subscales, the factor will still be retained so long as it is substantively meaningful.
Pan-Cultural Analysis
In the case that the four samples differ in their factor structures, as recommended by Leung and Bond (1989; see also Bond, 1988), we perform a PCA with a pan-cultural dataset comprising students from all the cultures involved in the study. Leung and Bond (1989) maintained that pan-cultural factor structure is a factor solution that is robust and representative across all the samples involved in the analysis. In the pan-cultural analysis, culturally idiosyncratic patterns of relations (emics) are filtered out (Bond, 1988; Leung & Bond, 1989). Thus, the relations that survive the individual-level pan-cultural analysis are claimed to have a univer-sal (etic) dimension across participants involved in the analysis regardless of their cultural memberships (Bond, 1988). As suggested by Bond (1988) and Leung and Bond (1989), the culture-specific data sets in the pan-cultural analysis ideally
con-tribute an equal number of participants. This requirement was met in our study (n
= 230 for each cultural sample).
Leung and Bond (1989) suggested that prior to conducting a pan-cultural analy-sis, the responses of all the participants in the analysis should first be doubly stan-dardised to eliminate the patterning and positioning effects, both of which are the effect of cultures on item endorsement. In the present study, the double standardis-ation procedure began with the usual within-subject standardisstandardis-ation procedure. Here, each participant’s scores were normalised using his or her mean and standard deviation scores (Leung & Bond, 1989). This procedure resulted in the standard-ised scores at the individual level across the 35 CLEQ items. Within-subject stan-dardisation aims only to eliminate the patterning effect. The positioning effect, however, still exists at this stage. To eliminate this effect, within-culture standardis-ation procedure was carried out: for each cultural group, the mean on each item was set to zero and its standard deviation was set to one.
Analysis of Variance
To examine the degree to which students in the Australian and South-East Asian samples endorse the culturally sensitive dimensions of the educational environ-ment, we performed a series of analyses of variance (ANOVAs), comparing Australian students with each of the three groups of South-East Asian students on each of the cultural factors identified in the pan-cultural PCA.
Results
Examination of Factor Structure (Differences of Kind)
Factor Structures of South-East Asian Students
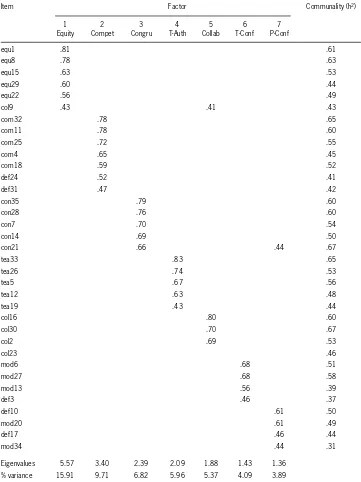
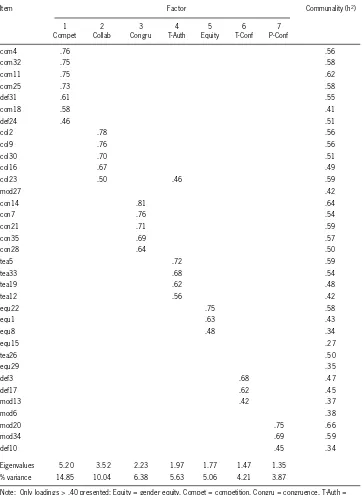
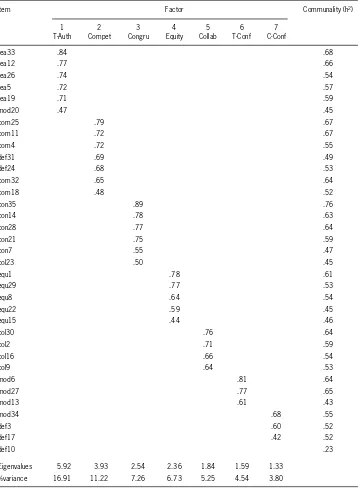
We first report the factor structures of the South-East Asian samples. Tables 1 to 3 present the 7-factor solutions of the 35 CLEQ items for the Singaporean, Indonesian and Filipino samples, respectively. With few exceptions, five cultural
factors were identified across these three samples. These factors are: (1) gender equity as factor 1 for the Singaporean sample, as factor 5 for the Indonesian sample, and as factor 4 for the Filipino sample; (2) competition as factor 2 for the Singaporean and Filipino samples, and as factor 1 for the Indonesian sample; (3) congruence as factor 3 for the three samples; (4) teacher authority as factor 4 for the Singaporean and Indonesian samples, and as factor 1 for the Filipino sample; and (5) collaboration as factor 5 for the Singaporean and Filipino samples, and as factor 2 for the Indonesian sample. Not surprisingly, the two CLEQ factors reported earlier as having low reliabilities (deference and modelling) were not suc-cessfully identified. Rather, we found a general pattern in which deference and modelling items were dispersed across two non-hypothesised factors, factor 6 and factor 7. Factor 6 comprised items that concern the extent to which students defer
to teachers or follow what is instructed by teachers (teacher conformity). Factor 7
comprised items that concern the extent to which students conform to what their
peers in the class do or say (peers conformity).
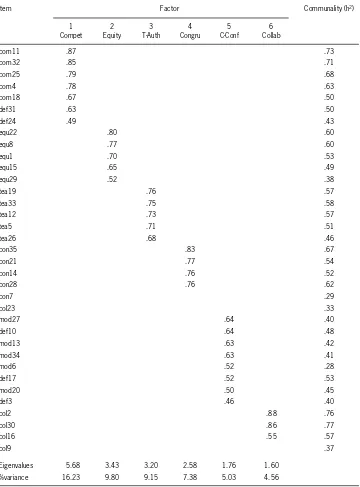
Factor Structure of Australian Students
The Australian dataset was also subjected to a 7-factor solution. Similar to the factor structures of the three South-East Asian datasets, the five hypothesised CLEQ factors identified were competition (factor 1), teacher authority (factor 2), gender equity (factor 3), congruence (factor 5), and collaboration (factor 6). Unlike the factor structures presented in Tables 1 to 3 for the South-East Asian sample, items pertaining to students’ deferential and modelling interactions with their peers and teachers were clustered in factor 4 for the Australian sample. Given that factor 7 comprised only one item (i.e., item mod6), we ran the analysis with a 6-factor extraction (see Table 4). The identified factors were similar to those found in the 7-factor structure solution, except that mod6 was now clustered with 7-factor 5, which comprised items related to deferential and modelling interactions with both peers
and teachers. Factor 5 is therefore named class members conformity.
Pan-Cultural Factor Structure
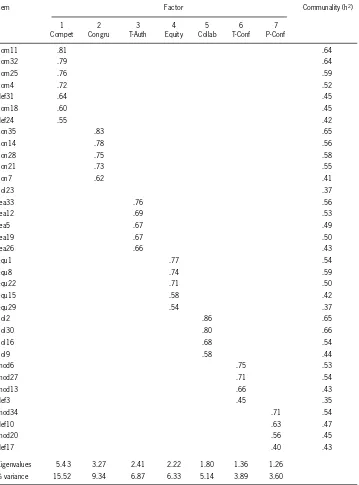
The purpose of the pan-cultural analysis was to identify a set of cultural factors that are robust and representative across the four cultural groups. Table 5 shows the 7-factor structure solution for the pan-cultural dataset. Consistent with most of the above findings, the first five identified factors were the hypothesised CLEQ factors (competition, congruence, teacher authority, gender equity, and collabora-tion). The last two factors — teacher conformity and peers conformity — differed slightly from the originally hypothesised CLEQ sixth and seventh factors.
Examination of Means (Differences of Degree)
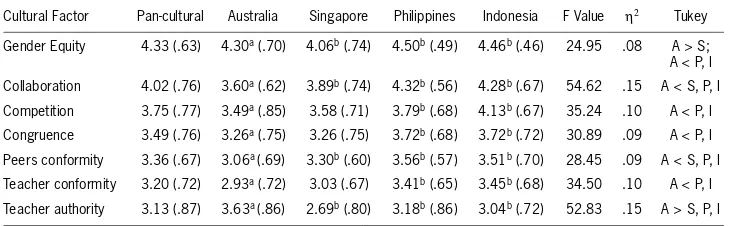
To examine the extent to which Australian students and each of the three groups of South-East Asian students were different or similar in mean-level scores on the cul-tural factors, we performed a series of ANOVAs using country as an independent variable and the seven cultural factors as dependent variables. In this respect, the average scores of the seven cultural factors were computed based on the item com-position derived in the pan-cultural analysis. Table 6 shows the means of the cul-tural factors for each of the four samples, with the pan-culcul-tural sample used as a baseline comparison.
168
169 ▲
TA B L E 1
A Seven-Factor Solution of the 35 CLEQ Items for the Singaporean Sample
Item Factor Communality (h2)
1 2 3 4 5 6 7
Equity Compet Congru T-Auth Collab T-Conf P-Conf
equ1 .81 .61
equ8 .78 .63
equ15 .63 .53
equ29 .60 .44
equ22 .56 .49
col9 .43 .41 .43
com32 .78 .65
com11 .78 .60
com25 .72 .55
com4 .65 .45
com18 .59 .52
def24 .52 .41
def31 .47 .42
con35 .79 .60
con28 .76 .60
con7 .70 .54
con14 .69 .50
con21 .66 .44 .67
tea33 .83 .65
tea26 .74 .53
tea5 .67 .56
tea12 .63 .48
tea19 .43 .44
col16 .80 .60
col30 .70 .67
col2 .69 .53
col23 .46
mod6 .68 .51
mod27 .68 .58
mod13 .56 .39
def3 .46 .37
def10 .61 .50
mod20 .61 .49
def17 .46 .44
mod34 .44 .31
Eigenvalues 5.57 3.40 2.39 2.09 1.88 1.43 1.36
% variance 15.91 9.71 6.82 5.96 5.37 4.09 3.89
170
▲
TA B L E 2
A Seven-Factor Solution of the 35 CLEQ Items for the Indonesian Sample
Item Factor Communality (h2)
1 2 3 4 5 6 7
Compet Collab Congru T-Auth Equity T-Conf P-Conf
com4 .76 .56
com32 .75 .58
com11 .75 .62
com25 .73 .58
def31 .61 .55
com18 .58 .41
def24 .46 .51
col2 .78 .56
col9 .76 .56
col30 .70 .51
col16 .67 .49
col23 .50 .46 .59
mod27 .42
con14 .81 .64
con7 .76 .54
con21 .71 .59
con35 .69 .57
con28 .64 .50
tea5 .72 .59
tea33 .68 .54
tea19 .62 .48
tea12 .56 .42
equ22 .75 .58
equ1 .63 .43
equ8 .48 .34
equ15 .27
tea26 .50
equ29 .35
def3 .68 .47
def17 .62 .45
mod13 .42 .37
mod6 .38
mod20 .75 .66
mod34 .69 .59
def10 .45 .34
Eigenvalues 5.20 3.52 2.23 1.97 1.77 1.47 1.35
% variance 14.85 10.04 6.38 5.63 5.06 4.21 3.87
171 ▲
TA B L E 3
A Seven-Factor Solution of the 35 CLEQ Items for the Filipino Sample
Item Factor Communality (h2)
1 2 3 4 5 6 7
T-Auth Compet Congru Equity Collab T-Conf C-Conf
tea33 .84 .68
tea12 .77 .66
tea26 .74 .54
tea5 .72 .57
tea19 .71 .59
mod20 .47 .45
com25 .79 .67
com11 .72 .67
com4 .72 .55
def31 .69 .49
def24 .68 .53
com32 .65 .64
com18 .48 .52
con35 .89 .76
con14 .78 .63
con28 .77 .64
con21 .75 .59
con7 .55 .47
col23 .50 .45
equ1 .78 .61
equ29 .77 .53
equ8 .64 .54
equ22 .59 .45
equ15 .44 .46
col30 .76 .64
col2 .71 .59
col16 .66 .54
col9 .64 .53
mod6 .81 .64
mod27 .77 .65
mod13 .61 .43
mod34 .68 .55
def3 .60 .52
def17 .42 .52
def10 .23
Eigenvalues 5.92 3.93 2.54 2.36 1.84 1.59 1.33
%variance 16.91 11.22 7.26 6.73 5.25 4.54 3.80
As shown in Table 6, the Australian students (M = 4.30) scored significantly
higher than the Singaporean students (M = 4.06) — but significantly lower than the
Filipino students (M = 4.50) and the Indonesian students (M = 4.46) — in their
perception of gender equity in the classroom. For the collaboration subscale, as
expected, the Australian students (M = 3.60) were significantly lower than the
Singaporean students (M = 3.89), the Filipino students (M = 4.32) and the
Indonesian students (M = 4.28). Similarly, for peers conformity, the Singaporean
students (M = 3.30), the Filipino students (M = 3.56) and the Indonesian students
(M = 3.51) were significantly higher than the Australian students (M = 3.06).
Contrary to our expectation, in terms of competition, the Australian students (M =
3.49) were significantly lower than the Filipino students (M = 3.79) and the
Indonesian students (M = 4.13). In terms of the teacher authority subscale, as
expected, the Australian students (M = 3.63) were significantly higher than the
Singaporean students (M = 2.69), the Filipino students (M = 3.18), and the
Indonesian students (M = 3.04). In contrast, the Australian students (M = 2.93)
were significantly lower than the Filipino students (M = 3.41) and the Indonesian
students (M = 3.45) in their endorsement of the teacher conformity items. Finally,
the Australian students (M = 3.26) were significantly lower than the Filipino and
Indonesian students (M = 3.72 for both) on the congruence subscale.
Discussion
The present study has shown that there is predominant congruence in factor struc-ture across Australian and South-East Asian samples, but there are also some inter-esting factorial differences between Australian students and their South-East Asian counterparts (i.e., providing a more nuanced perspective on between-country differ-ences of kind). Thus, there is a congruence that can be a basis for counselling and guidance through a shared understanding of key factors, but there are some nuances that it is important to recognise as well. One such difference related to items that measured students’ deference to the teacher and to peers. For the Australian sample, these items were found to converge on one factor; whereas for each of the three groups of South-East Asian students, these items were dispersed into two factors that were differentiated according to social reference (peers and teacher). These findings suggest that, unlike their Singaporean, Filipino and Indonesian counter-parts, the Australian secondary school students did not make such a significant dif-ferentiation in their interactions with teachers compared with classmates.
The findings also indicate that the Australian sample was different from the three South-East Asian samples in the degree of endorsement of cultural factors. As expected, the Australian students were higher than the Singaporean, Filipino and Indonesian students on their inclination to challenge or disagree with what the teacher says in the classroom, whereas the three groups of South-East Asian stu-dents were higher than the Australian sample in their preferences for collaboration. Also in line with our predictions, the three groups of South-East Asian students were higher than the Australian students on the two factors identified in our datasets — peers conformity and teacher conformity — providing evidence for the
172
173 ▲
TA B L E 4
A Six-Factor Solution of the 35 CLEQ Items for the Australian Sample
Item Factor Communality (h2)
1 2 3 4 5 6
Compet Equity T-Auth Congru C-Conf Collab
com11 .87 .73
com32 .85 .71
com25 .79 .68
com4 .78 .63
com18 .67 .50
def31 .63 .50
def24 .49 .43
equ22 .80 .60
equ8 .77 .60
equ1 .70 .53
equ15 .65 .49
equ29 .52 .38
tea19 .76 .57
tea33 .75 .58
tea12 .73 .57
tea5 .71 .51
tea26 .68 .46
con35 .83 .67
con21 .77 .54
con14 .76 .52
con28 .76 .62
con7 .29
col23 .33
mod27 .64 .40
def10 .64 .48
mod13 .63 .42
mod34 .63 .41
mod6 .52 .28
def17 .52 .53
mod20 .50 .45
def3 .46 .40
col2 .88 .76
col30 .86 .77
col16 .55 .57
col9 .37
Eigenvalues 5.68 3.43 3.20 2.58 1.76 1.60
%variance 16.23 9.80 9.15 7.38 5.03 4.56
174
▲
TA B L E 5
A Seven-Factor Solution of the 35 CLEQ Items for the Pan-Cultural Sample
Item Factor Communality (h2)
1 2 3 4 5 6 7
Compet Congru T-Auth Equity Collab T-Conf P-Conf
com11 .81 .64
com32 .79 .64
com25 .76 .59
com4 .72 .52
def31 .64 .45
com18 .60 .45
def24 .55 .42
con35 .83 .65
con14 .78 .56
con28 .75 .58
con21 .73 .55
con7 .62 .41
col23 .37
tea33 .76 .56
tea12 .69 .53
tea5 .67 .49
tea19 .67 .50
tea26 .66 .43
equ1 .77 .54
equ8 .74 .59
equ22 .71 .50
equ15 .58 .42
equ29 .54 .37
col2 .86 .65
col30 .80 .66
col16 .68 .54
col9 .58 .44
mod6 .75 .53
mod27 .71 .54
mod13 .66 .43
def3 .45 .35
mod34 .71 .54
def10 .63 .47
mod20 .56 .45
def17 .40 .43
Eigenvalues 5.43 3.27 2.41 2.22 1.80 1.36 1.26
% variance 15.52 9.34 6.87 6.33 5.14 3.89 3.60
South-East Asian students’ greater inclination to conform to what the majority of their classmates say or do and to what their teachers require of them.
Taken together, it seems that these Australian secondary school students tended to practise more egalitarian interactions with their teachers. In contrast, the sec-ondary school students in the Singapore, Philippines, and Indonesian samples tended to practice a more hierarchical pattern of social interactions with their teachers, which are manifested in their inclination to defer to the teacher’s author-ity and to conform to what the teacher says or does. Compared to the Australian students, the South-East Asian students also showed a higher degree of conformity to and preferences for collaboration with their peers. These findings seem to fit nicely with the classification of countries according to Hofstede’s (2001) cultural dimensions; that is, Singapore, the Philippines and Indonesia are among the collec-tivist countries with a large power distance, whereas Australia is one of the individ-ualist countries with a small power distance.
It is also worthwhile to note the findings associated with gender equity, competi-tion and congruence. Interestingly, students in the four cultural groups generally agreed that female and male teachers and classmates are able to make equal contri-butions to the class. This was shown in the finding that among all the cultural factors, gender equity was the factor with the highest endorsement across the four samples. Given the notions that the socialisation of gender roles in many modern countries has declined (Segall, Dasen, Berry, & Poortinga, 1990), and that mas-culinity–femininity has been criticised as a culture-level dimension that overempha-sises conventional gender roles (Hofstede & Vunderink, 1994), this finding may not be surprising.
Contrary to our prediction, the Australian students were found to be less com-petitive than the Filipino and Indonesian students. This finding may have been affected by the fact that our Filipino and Indonesian students were sampled from relatively high-achieving secondary schools in their respective countries, which probably made the classroom climate in these schools more competitive. With respect to congruence, as expected, relative to the Filipino and Indonesian students’
175 ▲
TA B L E 6
Main effects of Cultural Membership on Cultural Factors of the Classroom Learning Environment: a Comparison Between the Australian Sample and Each of the Three South-East Asian Samples
Cultural Factor Pan-cultural Australia Singapore Philippines Indonesia F Value η2 Tukey
Gender Equity 4.33 (.63) 4.30a(.70) 4.06b(.74) 4.50b(.49) 4.46b(.46) 24.95 .08 A > S;
A < P, I
Collaboration 4.02 (.76) 3.60a(.62) 3.89b(.74) 4.32b(.56) 4.28b(.67) 54.62 .15 A < S, P, I
Competition 3.75 (.77) 3.49a(.85) 3.58 (.71) 3.79b(.68) 4.13b(.67) 35.24 .10 A < P, I
Congruence 3.49 (.76) 3.26a(.75) 3.26 (.75) 3.72b(.68) 3.72b(.72) 30.89 .09 A < P, I
Peers conformity 3.36 (.67) 3.06a (.69) 3.30b(.60) 3.56b(.57) 3.51b(.70) 28.45 .09 A < S, P, I
Teacher conformity 3.20 (.72) 2.93a(.72) 3.03 (.67) 3.41b(.65) 3.45b(.68) 34.50 .10 A < P, I
Teacher authority 3.13 (.87) 3.63a (.86) 2.69b(.80) 3.18b(.86) 3.04b(.72) 52.83 .15 A > S, P, I
Note: Values in the parentheses are standard deviations; A = Australia, S = Singapore, P = Philippines, I = Indonesia.
a,bMeans with different superscripts are statistically different from one another (comparisons made between
perceptions, the Australian students perceived that the lessons they learn at the school and at home are less intertwined and related. This may suggest that teachers in the Filipino and Indonesian classrooms seek to more fully align lessons and school with the home. In other words, compared with students in the Australian classroom, students in the Filipino and Indonesian classrooms perceived that lessons are conveyed in a more structured way.
Implications for Counselling
Our findings hold implications for counsellors seeking to foster learning environ-ments that are pedagogically effective while being culturally sensitive and respectful to diverse members of the classroom and school. Indeed, there are a number of instructional and guidance practices and competencies that counsellors can develop to effectively work with culturally diverse learners. For example, counsellors might look to create intraschool interaction patterns that make students — especially those from an ethnic minority — feel comfortable, included, respected, valued and affirmed (Holcomb-McCoy, 2004). It is also important that school counsellors possess appropriate and up-to-date multicultural awareness, knowledge and skills
(Sue, Arrendondo, & McDavis, 1992). The awarenesscomponent involves
counsel-lors’ professional examination of their own values, stereotypes and world views that
might affect the counselling provided to students. The knowledgecomponent entails
gaining factual understanding of the cultural, social and family dynamics of cultur-ally diverse groups, along with knowledge of the critical sociopolitical, historical
and economic contexts from which students emanate. The skillscomponent requires
the development of culturally sensitive and flexible communication and assessment strategies that empower students of all cultural backgrounds. These strategies also include the ability to select and use testing, interviewing and survey instruments that are appropriate for students of culturally diverse backgrounds (Sue et al., 1992).
Conclusion
The present study has shown that on various educationally relevant cultural factors, secondary school students in different cultures are both distinct and con-gruent in their beliefs about interactions with other classroom members, the teacher, and the learning process. Juxtaposing the findings of Australian students’ perceptions with those of students from Singapore, the Philippines and Indonesia has shed light on the differences and congruencies among culturally diverse stu-dents — differences and congruencies that help better inform counsellors as they foster the academic and non-academic development of students from diverse back-grounds. Through greater cross-cultural understanding of students in multicultural secondary classrooms and schools, counsellors are strongly placed to facilitate all students’ educational, psychological and sociocultural pathways.
Acknowledgments
The research reported in this paper was supported by the National University of Singapore and the Singapore Millennium Foundation in the form of doctoral schol-arships given to Dr Liem.
176
References
Ballard, B. & Clanchy, J. (1991). Teaching students from overseas: A brief guide for lectur-ers and supervisors.Melbourne, Australia: Longman Cheshire.
Banks, J.A. (2009). The Routledge international companion to multicultural education.
London & New York: Routledge.
Bond, M.H. (1988). Finding universal dimensions of individual variation in multi-cultural studies of values: The Rokeach and Chinese value surveys. Journal of Personality and Social Psychology, 55,1009–1015.
Burnett, P.C., & Dart, B.C. (1997). Conventional versus confirmatory factor analysis: Methods for validating the structure of existing scales. Journal of Research and Development in Education, 30,126–132.
Fisher, D.L., & Waldrip, B.G. (1997). Assessing culturally sensitive factors in the learning environment of science classrooms. Research in Science Education, 27,41–49.
Fisher, D.L., & Waldrip, B.G. (1999). Cultural factors of science classroom learning envi-ronments, teacher–student interactions and student outcomes.Research in Science and Technological Education, 17, 83–96.
Fisher, D.L., & Waldrip, B.G (2002). Measuring culturally sensitive factors of classroom learning environment with the CLEQ. In S.C. Goh & M.S. Khine (Eds.), Studies in edu-cational learning environments: An international perspective(pp. 27–48). NJ: World Scientific.
Gollnick, D.M., & Chinn, P.C. (2009). Multicultural education in a pluralistic society.
Upper Saddle River, NJ: Pearson.
Gurung, R.A.R., & Prieto, L.R. (2009) Getting culture: Incorporating diversity across the curriculum. Steerling, VA: Stylus.
Heyward, M. (2002). From international to intercultural: Redefining the international school for a globalised world. Journal of Research in International Education, 1, 9–32. Hofstede, G.J. (1980). Culture’s consequences: International differences in work-related
values.Beverly Hills, CA: Sage Publications.
Hofstede, G.J. (1986). Cultural differences in teaching and learning. International Journal of Intercultural Relations, 10, 301–320.
Hofstede, G.J. (1991). Culture and organizations: Software of the mind.London: McGraw-Hill.
Hofstede, G.J. (2001). Culture’s consequences: Comparing values, behaviors, institutions, and organizations across nations(2nd ed.). Thousand Oaks, CA: Sage Publications. Hofstede, G., & McRae, R. (2004). Personality and culture revisited: Linking traits and
dimensions of culture. Cross-Cultural Research, 38,52–88.
Hofstede, G.J., & Vunderink, M. (1994). A case study in masculinity/femininity differences: American students in the Netherlands vs. local students. In A.M. Bouvy, F.J.R. Van de Vijver, P. Boski, & P. Schmitz (Eds.), Journey into cross-cultural psychology(pp. 329–347). Lisse, Netherlands: Swets & Zeitlinger.
Holcomb-McCoy, C. (2004). Assessing the multicultural competence of school counsellors: A checklist. Professional School Counseling, 7,178–186.
Leung, K., & Bond, M.H. (1989). On the empirical identification of dimension for cross-cultural comparisons. Journal of Cross-Cultural Psychology, 20, 133–151.
Liem A.D. (2006). The influence of sociocultural and educational contexts on approaches to learning.Unpublished doctoral dissertation, National University of Singapore.
Liem, A.D. (2007). Triandis Award: Appreciating differences, celebrating similarities — An experience of learning in culturally diverse contexts. Cross-Cultural Psychology Bulletin, 40,31–35.
Liem, A.D., Nair, E., Bernardo, A.B.I., & Prasetya, P.H. (2008). The influence of culture on students’ classroom social interactions: Implications for best teaching and learning
practice in multicultural and international education. In D.M. McInerney & A.D. Liem (Eds.), Teaching and learning: International best practice (pp. 377–404). Greenwich, CT: Information Age Publishing.
New South Wales Department of Education and Training (2008). International students in NSW public schools: Reports and statistics.Sydney, Australia: Department of Education and Training.
New South Wales Department of Education and Training (2009). Language background other than English, 2009.Sydney, Australia: Department of Education and Training. Nunnally, J.C. (1967). Psychometric theory(1st ed.). New York: McGraw-Hill.
Nunnally, J.C. (1978). Psychometric theory(2nd ed.). New York: McGraw-Hill.
Oishi, S., & Diener, E. (2003). Culture and wellbeing: The cycle of action, evaluation and decision. Personality and Social Psychology Bulletin, 29,939–949.
Paige, R.M., Lange, D.L., & Yeshova, Y.A. (Eds.). (1999). Culture as the core: Integrating culture into the language curriculum.Minneapolis: University of Minnesota.
Rohner, R.P. (1984). Toward a conception of culture for cross-cultural psychology. Journal of Cross-Cultural Psychology, 15,111–138.
Segall, M.H., Dasen, P.R., Berry, J.W., & Poortinga, Y.H. (1990). Human behavior in global perspective: An introduction to cross-cultural psychology.New York: Pergamon. Stanat, P., & Christensen, G. (2006). Where immigrant students succeed: A comparative
review of performance and engagement in PISA 2003. Paris: Organisation for Economic Co-operation and Development.
Stevens, J. (1992). Applied multivariate statistics for the social science.New York: Lawrence Erlbaum.
Sue, D.W., Arredondo, P., & McDavis, R.J. (1992). Multicultural counseling competencies and standards: A call to the profession. Journal of Counseling and Development, 70,
477–486.
Triandis, H.C. (1994). Culture and social behavior.New York: McGraw-Hill.
Triandis, H.C., & Suh, E.M. (2002). Cultural influences on personality. Annual Review of Psychology, 53,133–160.
Van de Vijver, F.J.R., & Poortinga, Y.H. (2005). Conceptual and methodological issues in adapting test. In R.K. Hambleton, P.F. Merenda, & C.D. Spielberger (Eds.), Adapting educational tests and psychological tests for cross-cultural assessment(pp. 39–64). Mahwah, NJ: Erlbaum.
Waldrip, B.G., & Fisher, D.L. (2000). The development and validation of a Learning Environment Questionnaire using both quantitative and qualitative methods. Journal of Classroom Interaction, 35,25–37.
Waldrip, B.G., & Fisher, D.L. (2007). Student perceptions of teacher-student interpersonal behavior and cultural factors of learning environment in metropolitan and country schools. Education in Rural Australia, 17,37–54.
▲
178