D12-1
IDENTIFICATION OF
NITROGEN
STATUS IN Brassica juncea L.USING COLORMOMENT, GLCM AND BACKPROPAGATION NEURAL NETWORK
I Putu Gede Budisanjaya1I K. G. Darma Putra2 and I Nyoman Satya Kumara2 1
Faculty of Agricultural Technology, Udayana University E-mail: [email protected]
2
Department of Electronics Engineering, Faculty of Engineering, Udayana University
Abstract
Vegetables cultivation using hydroponic is becoming popular now days because of its irrigation and fertilizer efficiency. One type of vegetable which can be cultivated using hydroponic is green mustard (Brassica juncea L.) tosakan variety. This vegetable is harvested in the vegetative phase, approximately aged of 30 days after planting. In addition, during the vegetative phase, this plant requires more nitrogen for growth of vegetative organs. The lack of nitrogen will lead to slow growth and the leaves turn yellow.
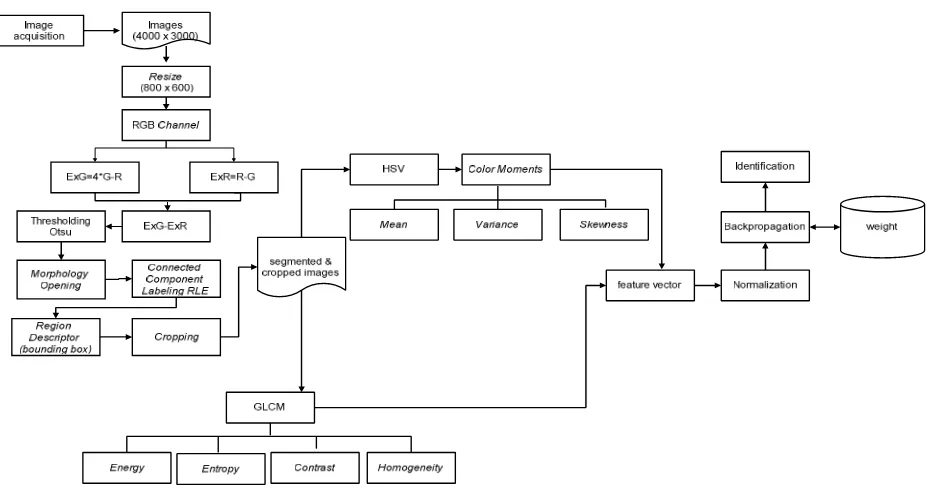
In this study, non-destructive technology was developed to identify nitrogen status through the image of green mustard leaf by using digital image processing and artificial neural network. The image processing method used was the color moment for color feature extraction, gray level co-occurrence matrix (GLCM) for texture feature extraction and back propagation neural network to identify nitrogen status from the image of leaf.
The input image data resulted from acquisition process was RGB color image which was converted to HSV. Prior to the color and texture feature extraction and texture, acquisition image was segmented and cropped to get the leaf image only. Next Step was to conduct training using back propagation neural network with two hidden layer combinations, 20,000 iteration epoch. Accuracy of the test results using those methods was 97.82%. The result indicates those three methods is reliable to identify nitrogen status in the leaf of green mustard.
Keywords: nitrogen, image processing, back propagation Neural Network.
D12-2
network that captured using conventional digital camera. By using vision technology, Nitrogen identification will not requiring direct contact to plant leaf and nondestructively, so will minimize error caused by human visual subjectivity.
Materials and Methods
Materials
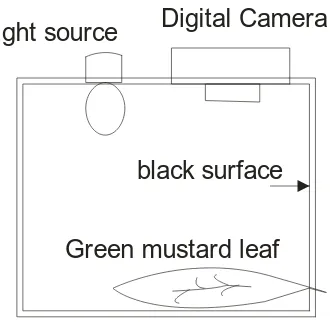
This research was conducted using 249 green mustard (Brassica juncea L.) Tosakan variety. The source of Nitrogen nutrient in this research was ZA fertilizer. The dosage of ZA varied from 0, 1, 2, 3 grams mix in one liter of water. Image acquisition was conducted at green house, to capture leaf images aged 15 days after planting.
Figure 1. Algorithm flow chart
Image Acquisition
Green mustard (Brassica juncea L) Tosakan variety images were acquired using
Canon Digital Camera PowerShot A1200. The images were obtained with 4000 x 3000
D12-3
Figure 2. Image Acquisition box for Green mustard leaves
Pre-processing
The captured images were resized to 800 x 600 pixels to speed up the computation process. The segmentation process were obtained using modified excess green (MExg) of RGB color channel (Woebbecke et al., 1995) then continued using Otsu thresholding, Opening morphology, RLE labeling and bounding box to crop the leaf part.
Figure 3. Image obtained before and after pre-processing
Color Moments Method
Color moments are effective because this method based on dominant feature from color probabilities distribution. Color moments are appropriate for color based image analysis, especially for image that contains plant leaf ( Man, Q-K et al. 2008). The RGB images were converted into Hue Saturation Value (HSV), because Hue color based on human perception (Gonzales, 2002).
Figure 4. RGB and HSV leaf color
Digital Camera
Green mustard leaf light source
D12-4
The three color moments can be defined as :
Mean :
Mean of Hue, Saturation and Value are calculated using following formula :
, , 1 ……… (1)
Standard Deviation :
Standard deviation of Hue, Saturation and Value are calculated using following formula :
, , 1
/
……… (2)
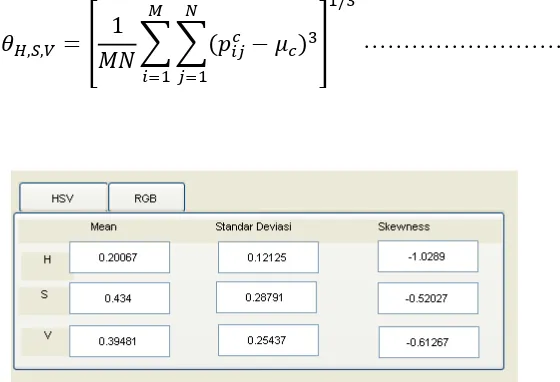
Skewness :
Skewness of Hue, Saturation and Value are calculated using following formula :
, , 1
/
……… (3)
Figure 5. Result of Color moments extraction feature
GLCM Method
Texture feature extraction were obtained using GLCM (Gray Level Co-occurrence
Matrix) from four directions (0o, 45o, 90o, dan135o) with 1 pixel distance. The GLCM method
is suitable for estimating image properties related to second-order statistic (Metre V, 2013). The five GLCM methode can be defined as :
D12-5
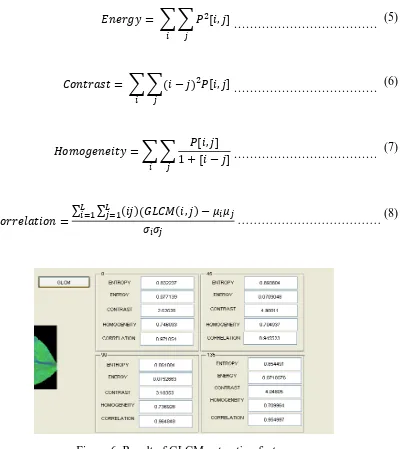
,!-# $ %&, '( ……… (5)
." !/0 & ' $%&, '( ……… (6)
1"2"-, ,& # 1 3 %& '($%&, '( ……… (7)
."!!,4/ &" ∑ ∑8 8 &' 67. &, ' ……… (8)
Figure 6. Result of GLCM extraction feature
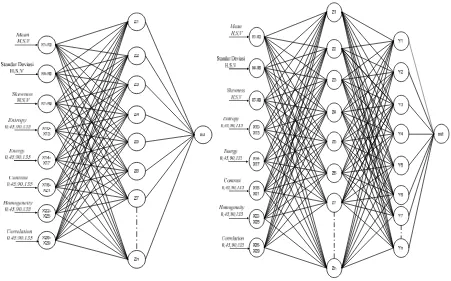
Backpropagation Neural Network Method
D12-6
Figure 7. Architecture of backpropagation neural network
The following parameter that used for the backpropagation training :
net.trainParam.epochs= 20000 net.trainParam.goal=0.000001 net.trainParam.lr=0.001; net.trainParam.show=100 net.trainParam.mc=0.5
Results and discussion
Table 1 illustrate the result of Backpropagation neural network MSE and Accuracy using 2 hidden layers model with 40, 60, 80 and 100 neurons,
Table 1. Result of Backpropagatin neural network testing
Hidden Layer Neuron MSE Accuracy (%)
1
40 0,0000163 93,47 60 0,0000105 90,21 80 0,00000349 93,47 100 0,0000339 85,86
2
D12-7
Figure 8 shows the performance accuracy of different neuron in 1 hidden layer. From the graph the best accuracy is using 40 and 80 neurons.
Figure 8. Accuracy from different neurons with 1 hidden layer
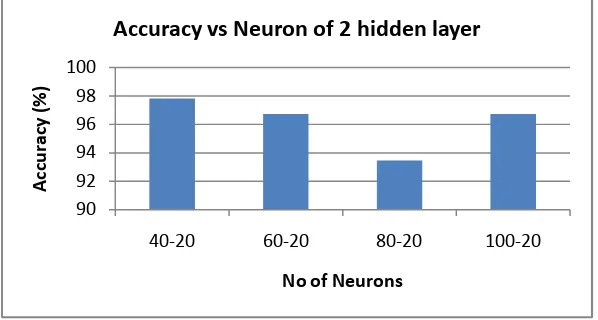
Figure 9 shows the performance accuracy of different neuron in 2 hidden layer. From the graph the best accuracy is using 40-20 neurons
Figure 9. Accuracy from different neurons with 2 hidden layer
Next, from figure 10 shows the MSE result with different number of neurons in 1 hidden layer, the closest MSE to goal setting is 80 neurons.
80
Accuracy vs Neuron of 1 hidden layer
90
Accuracy vs Neuron of 2 hidden layer
D12-8
Figure 10. MSE vs number of neuron in 1 hidden layer
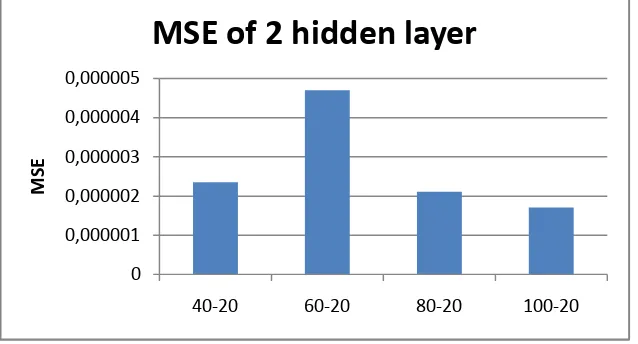
the MSE result with different number of neurons in 2 hidden layer depicted in figure 11, the closest MSE to goal setting is 100-20 neurons
Figure 11. MSE vs number of neuron in 2 hidden layer
Conclusion
In conclusion, image processing and artificial neural network techniques can be utilized to identify Nitrogen nutrient content on green mustard (Brassica juncea L.) Tosakan variety. Result showed that the best configuration was using 29 features vector 2 hidden layers and 40-20 neurons since it obtain the highest accuracy percentage with 97,82%.
References
1. Auearunyawat, P et al. 2012. An Automatic Nitrogen Estimation Method in Sugarcane Leaves Using Image Processing Techniques. International Conference on Agricultural, Environment and Biological Sciences (ICAEBS’2012).
2. Gonzales, R.C., and Woods, R.E. 2002. Digital Image Processing Second edition. New Jersey: Prentice Hall.
3. Man ,Q-K et al. 2008. Recognition of Plant Leave Using Support Vector Machine. ICIC 2008. 192-199.