*Corresponding author.
and Artificial Intelligence
Vol. xx, No. x (20xx) xxxxx (xx pages) © World Scientific Publishing Company DOI:
A MOTION-AUDIO COMBINED SCHOOL BULLYING DETECTION
ALGORITHM
LIANG YE*
1. Department of Information and Communication Engineering, Harbin Institute of Technology No.2 Yikuang Street, Harbin 150080, China
2. Health and Wellness Measurement research group, OPEM unit, University of Oulu Pentti Kaiteran katu 1, Oulu 90014, Finland
PENG WANG
China Electronics Technology Group Corporation No.8 Guorui Road, Nanjing 210012, China
LE WANG
Department of Information and Communication Engineering, Harbin Institute of Technology No.2 Yikuang Street, Harbin 150080, China
HANY FERDINANDO
1. Health and Wellness Measurement research group, OPEM unit, University of Oulu Pentti Kaiteran katu 1, Oulu 90014, Finland
2. Department of Electrical Engineering, Petra Christian University Siwalankerto 121 - 131, Surabaya 60236, Indonesia
TAPIO SEPPANEN
Physiological Signal Analysis Team, University of Oulu Pentti Kaiteran katu 1, Oulu 90014, Finland
ESKO ALASAARELA
Health and Wellness Measurement research group, OPEM unit, University of Oulu Pentti Kaiteran katu 1, Oulu 90014, Finland
xxx-2
School bullying is a common social problem which affects children both mentally and physically, and preventing school bullying is a timeless topic all over the world. This paper proposes a school bullying detection method based on activity recognition and speech emotion recognition. Motion data and voice data are gathered by movement sensors and microphone, and motion features and audio features are extracted to describe bullying events and daily-life events. Motion features include time domain features and frequency domain features. Audio features are the classical MFCCs. Wrapper is used for feature selection. Then motion features and audio features together form combined feature vectors for classification, and LDA is used for further dimension reduction. A BPNN is trained to recognize bullying activities and distinguish them from daily-life ones. An action transition detection method is proposed to reduce computational complex for the purpose of practical use. Only when an action transition event has been detected, the school bullying detection algorithm will run. Simulation results show that the motion-audio combined feature vector outperforms sole motion features and sole acoustic features, with accuracy of 82.4% and precision of 92.2%. Moreover, with the action transition method, the computation can be reduced by half.
Keywords: activity recognition; speech emotion recognition; movement sensors; school bullying; pattern recognition
1. Introduction
School bullying means aggressive behaviors or words, which hurt another person intentionally. It is often applied by the stronger upon the weaker, or by the elder upon the younger. School bullying is a serious social problem among teenagers, especially in high grades of primary schools and junior middle schools. Victims in school bullying suffer from both mental and physical violence. School bullying is considered as one of the main reasons for depression, dropping out of school and adolescent suicide.
School bullying is a common social phenomenon. A survey1 by “USA Today” in 2010 showed that, among the surveyed senior middle school students in their past year, 50% of them had bullied others, whereas 47% and been bullied. Nearly half (44%) of the boys said that they were victims of school bullying, and so did 50% of the girls. A statistical result2 by the MEXT (Ministry of Education, Culture, Sports, Science and Technology) of Japan in 2011 showed that school bullying events were increasing in the past decade, from 28,526 in 1998 to 60,913 in 2010. The increasing speed was worrisome. Moreover, school violence showed a trend of younger age. The statistical result showed that school violence events in primary schools increased from 1,432 in 1998 to 7,115 in 2010. Serious bullying events were often reported on TVs or newspapers in recent years. In 2015, requirement for integrated child protection systems were proposed on the European Forum3.
Preventing school bullying is an important and timeless topic. Study on school bullying first started from the 1960s in Sweden, Finland, and Norway. However, existing methods to prevent school bullying are man-driven. Since bullying will not happen in front of teachers or parents, they could only know it when someone reports the event to them. If there is no eyewitness, the bullying event cannot be discovered in time.
With the popularity of smartphones, some anti-bullying applications have been developed, e.g., Stop Bullies, Campus Safety, ICE BlackBox, TipOff, and Back Off Bully.
• Stop Bullies: When a bullying event happens, the user needs to press a key on the smartphone, and then the smartphone will send phones, videos, or texts together with the GPS message to certain receiver(s). The receiver(s) will be able to know what has happened and where it happened, and go to stop the bullying.
• TipOff: The user operates the smartphone to record the evidence (e.g. photos) and upload it to a secure server. Only the manager of this server has the access to the server, and he/she will decide what to do next.
which may cause more serious bullying. Whereas eyewitness may be afraid of reprisal by the bullies hence dare not operate his/her smartphone to send alarms.
Therefore, there should be an information-driven technique which could detect bullying events automatically. In a bullying event, there is a lot of information generated, such as motion and emotion. By analyzing such information, one is able to recognize a bullying event and distinguish it from daily-life activities or conversations. In view of this, an active bullying-detecting algorithm is possible. Moreover, after a bullying event has been detected, it should be reported to the victim’s teachers or parents automatically. Fortunately, a smartphone with built-in movement sensors and microphone is worthy of this task. It will be able to protect children from bullying where their teachers and parents are absent.
Such bullying detecting algorithm uses the knowledge of pattern recognition, specifically, activity recognition, speech emotion recognition and mental stress recognition to detect school bullying events. However, existing algorithms of the above-mentioned pattern recognition techniques cannot be applied directly on school bullying detection. The reasons are given as follows:
(1) Existing activity recognition techniques are mainly on daily-life activities, e.g., standing, walking, sitting down, lying down, falling down, and taking vehicles4-9. Such motions have regular patterns, and the forces are applied directly upon oneself, so the recognition algorithms are not affected by individual factors (e.g. strength and weight) too much, thus have relatively high accuracies. However, in physical violence environment, the power of force depends on the bullies, and the movement of the victim is irregular and has much randomness, i.e. beats can come from any direction with different power. Moreover, physical violence can be confused with competitive games or sports, which increases the difficulty for classification. On one hand, classical motion features (single axis acceleration, incline angle, standard deviation, signal magnitude area, etc.10) cannot tell the differences between physical violence and daily-life activities. On the other hand, bullying actions may be mixed with daily-life actions (e.g. being pushed when walking), so traditional classifiers are not suitable for bullying detection.
(2) Existing speech emotion recognition techniques are mainly based on pure emotion from single person11-16, e.g., EMO-DB (Berlin Emotional Speech Database)17. Emotions are normally divided into six classes, namely anger, joy, sadness, fear, surprise, and disgust18. Besides, neutral is another common used emotion which together with the above-mentioned six forms seven basic pure emotions for speech emotion recognition. However, school bullying is a group event thus has a complex acoustic environment which includes various emotions, e.g., taunt and vituperation from the bullies, and fear and sorrow from the bullied. Classifiers for pure emotion recognition are not suitable, and new classifiers for mixed speech emotion recognition are needed.
(3) Existing mental stress recognition techniques are mainly based on physiological parameters such as EEG (Electroence-phalography), PPG (Photoplethysmogram), ECG (Electrocardiography), EMG (Electromyography), HR (Heart Rate)19-22. These parameters need special sensors which are not contained in normal smartphones, so they are not suitable for this thesis, i.e. school bullying detection with smartphones.
xxx-4
signal only to detect violence events and achieved 62%-70% accuracies. Later in 2017, they27 improved this ECG-based method to 73%-88% accuracies.
This paper proposes a motion-audio combined school bullying detection algorithm. It uses motion and audio features to recognize school bullying events, and distinguish them from daily-life ones. Data were gathered by role playing, and unreal activities are excluded by watching the video records. For activity recognition, time domain features and frequency domain features are extracted, whereas for speech emotion recognition, MFCC features are extracted. Then the Wrapper feature selection method and the LDA (Linear Discriminant Analysis) method are applied to reduce the feature dimension. A BPNN (Back Propagation Neural Network) trained with the Lenvenberg-Marquardt method is used for classification. Furthermore, in order to reduce the computational complexity for the purpose of future practical use, an action transition detection algorithm is developed. Simulation results show that the proposed school bullying detection algorithm provides higher average recognition performance (precision=92.2%, accuracy=82.4%,
recall=85.8%, and F1=88.5%) than the authors’ previous work, and the action transition detection algorithm can averagely save half of the computation cost.
The remainder of this paper is organized as follows: Section 2 describes the school bullying experiments from which the data were collected; Section 3 describes the features extraction and selection methods; Section 4 describes the classifier design; Section 5 shows the simulation results; and finally Section 6 draws a conclusion.
2. School Bullying Experiments
Experiment data were collected by role playing of school bullying and daily-life activities. The experiments were carried out by the authors’ research group and volunteers.
2.1. Physical violence experiments
The movement sensor (integrated accelerometer and gyroscope) was fixed on the subject’s waist, which has been proved to be the best place for activity recognition with a single movement sensor28, to collect 3D accelerations and 3D gyros at 50Hz. The y-axis is the vertical vector, whereas the x-axis and the z-axis are horizontal vectors. The experiments were video-recorded for the purpose of data synchronization. Sponge mats and protective gears were used to protect the subjects.
Physical violence experiments included nine types of activities,i.e., walking, running, jumping, falling down, playing, standing, hitting, pushing, and pushing down. Walking, running, jumping, falling down, playing, and standing were daily-life activities. Walking, running, jumping, falling down, and standing were acted by individual, whereas playing was acted in pairs or groups. Playing included several types of competitive games and sports which contained physical confrontation. Hitting, pushing, and pushing down were bullying activities, and were acted in pairs. Each activity was repeated several times by different subjects. Instantaneous actions such as pushing and pushing down were repeated more times than continuous actions such as walking and hitting. There were 1160 sections of activities recorded including transitional activities.
2.2. Verbal bullying experiments
3. Feature Extraction
3.1. Motion features
3.1.1. Motion Feature Extraction
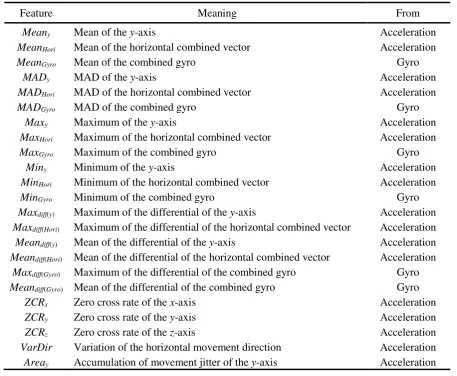
As mentioned above, motion data include acceleration and gyro, from which time domain features and frequency domain features are extracted. Features are extracted according to the data curves, i.e., find out the differences between two types of motions by comparing the curves, e.g., peak amplitudes, curve slopes. The extracted time domain features together with their meanings are given in Table 1.
Table 1. Time domain motion features.
Feature Meaning From
Meany Mean of the y-axis Acceleration
MeanHori Mean of the horizontal combined vector Acceleration
MeanGyro Mean of the combined gyro Gyro
MADy MAD of the y-axis Acceleration
MADHori MAD of the horizontal combined vector Acceleration
MADGyro MAD of the combined gyro Gyro
Maxy Maximum of the y-axis Acceleration
MaxHori Maximum of the horizontal combined vector Acceleration
MaxGyro Maximum of the combined gyro Gyro
Miny Minimum of the y-axis Acceleration
MinHori Minimum of the horizontal combined vector Acceleration
MinGyro Minimum of the combined gyro Gyro
Maxdiff(y) Maximum of the differential of the y-axis Acceleration
Maxdiff(Hori) Maximum of the differential of the horizontal combined vector Acceleration
Meandiff(y) Mean of the differential of the y-axis Acceleration
Meandiff(Hori) Mean of the differential of the horizontal combined vector Acceleration
Maxdiff(Gyro) Maximum of the differential of the combined gyro Gyro
Meandiff(Gyro) Mean of the differential of the combined gyro Gyro
ZCRx Zero cross rate of the x-axis Acceleration
ZCRy Zero cross rate of the y-axis Acceleration
ZCRz Zero cross rate of the z-axis Acceleration
VarDir Variation of the horizontal movement direction Acceleration Areay Accumulation of movement jitter of the y-axis Acceleration
In Table 1, the horizontal combined vector is the combination of the two horizontal vectors, i.e., the x-axis and the z-axis of the movement sensor. The combined gyro is the combination of gyro of the three axes. The maximum of the movement data is the absolute value of the max peak amplitude during the sampling period which represents the strength of the force. The differential of the movement data describes the slope of the movement curve which represents the sudden of the movement. Given a set of data X={x1, x2, …, xn}, the MAD (Median Absolute Deviation) calculated
as,
MAD = median(|xi-median(X)|), (1)
xxx-6
The VarDir is the variation of the horizontal movement direction. Assume that MaxHori happens
at T in the sampling window, and the corresponding horizontal movement direction is Dir(T). The
If VarDir > 180°, VarDir = 360°- VarDir. The feature can detect irregular movements to some extent.
where gravity is local gravity, and Accy is the vertical vector of the acceleration. Accy can distinguish
movements of which the horizontal vectors do not differ much.
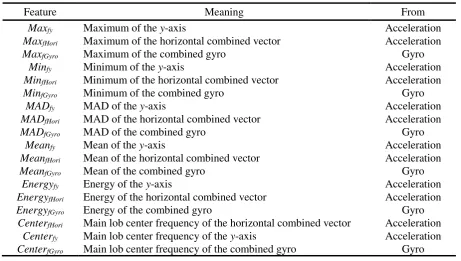
Besides time domain features, frequency domain features can also represent some characteristics of movements. Frequency features are extracted by FFT (Fast Fourier Transform) after Butterworth filters which removes high frequency noise. The extracted frequency domain features are given in Table 2.
Table 2. Frequency domain motion features.
Feature Meaning From
Maxfy Maximum of the y-axis Acceleration
MaxfHori Maximum of the horizontal combined vector Acceleration
MaxfGyro Maximum of the combined gyro Gyro
Minfy Minimum of the y-axis Acceleration
MinfHori Minimum of the horizontal combined vector Acceleration
MinfGyro Minimum of the combined gyro Gyro
MADfy MAD of the y-axis Acceleration
MADfHori MAD of the horizontal combined vector Acceleration
MADfGyro MAD of the combined gyro Gyro
Meanfy Mean of the y-axis Acceleration
MeanfHori Mean of the horizontal combined vector Acceleration
MeanfGyro Mean of the combined gyro Gyro
Energyfy Energy of the y-axis Acceleration
EnergyfHori Energy of the horizontal combined vector Acceleration
EnergyfGyro Energy of the combined gyro Gyro
CenterfHori Main lob center frequency of the horizontal combined vector Acceleration Centerfy Main lob center frequency of the y-axis Acceleration CenterfGyro Main lob center frequency of the combined gyro Gyro
3.1.2. Motion Feature Selection
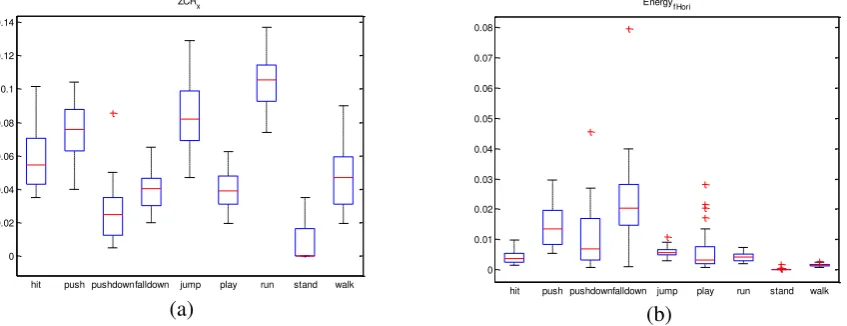
Indeed, the sum of the time domain features and the frequency domain ones is a little too large for classification. As the goal of this research work is to perform a school bullying detecting algorithm on portable devices such as smartphones of which the resources are limited, the computational cost should be as little as possible. Moreover, some features are useless, or even may be harmful for classification, i.e., they may decline the recognition accuracy, as is called overfitting. Fig. 1 shows two examples of motion features by the quartile box plot. Fig. 1 (a) shows an effective feature which can distinguish different types of activities well, whereas Fig. 1 (b) shows an ineffective feature which cannot. Features like Fig. 1 (b) should be excluded for classification. So feature selection is essential before putting the features into the classifier.
(a) (b)
Fig. 1. Examples of quartile box plots of motion features: (a) An effective feature which can distinguish different types of activities well; (b) An ineffective feature which cannot distinguish different types of activities.
Feature selection by quartile box plot is obvious, but not precise enough, so a more proper feature selection method should be used. Commonly used feature selection methods include Filter and Wrapper.
• Filter: This method estimates the correlation among the candidate features, and drops features with low correlation. It estimates the classification results without a pre-designed classifier. However, correlation is only one of the aspects which affect the classification accuracy. Moreover, different classifiers may have different results with the same features, so the adaptability between the classifier and the feature(s) should be taken into consideration. For this reason, Filter usually does not perform as well as Wrapper.
• Wrapper: This method needs a pre-designed entire classification system, i.e. from data pre-processing to classifier. In each traversal step, features added or removed, and the contributions of the features to classification are estimated according to the classification results. Wrapper has a relatively high computational complexity, and is time consuming. However, since Wrapper has tested the features with the classifier, it is able to pick out the best feature set for this dedicated classifier.
Therefore, this paper uses Wrapper for feature selection. BPNN (Back Propagation Neural Network) is chosen as the classifier for Wrapper to select features. Finally 11 motion features are selected, namely Energyfy, MADfGyro, MADfHori, Maxdiff(Gyro), Maxdiff(y), MaxGyro, MeanfHori, MeanGyro,
VarDir, ZCRx, and ZCRy.
0 0.02 0.04 0.06 0.08 0.1 0.12 0.14
hit push pushdownfalldown jump play run stand walk ZCR
x
0 0.01 0.02 0.03 0.04 0.05 0.06 0.07 0.08
xxx-8
3.2. Audio Features
For speech emotion recognition, the pitch and the MFCCs (Mel Frequency Cepstral Coefficients) are considered to be the most popular and most effective acoustic features29, 30. However, the pitch is affected by individual’s differences too much31, so this paper chooses the MFCCs for emotion recognition.
Besides MFCCs, the short time energy which indicates the volume of a voice is another important feature for bullying detection. When a bullying event happens, the volume of the voice is usually high, so this is obvious difference between bullying and daily-life conversation. However, there are some emotions which can have high energy, e.g., excitement. So short time energy cannot be used alone, but to assist the MFCCs and differential MFCCs.
Altogether 37 features are extracted for emotion recognition, i.e. 12 MFCCs, mfcc1, mfcc2, …, mfcc12, 12 first-order differential MFCCs, dmfcc1, dmfcc2, …, dmfcc12, 12 second-order differential MFCCs, ddmfcc1, ddmfcc2, …, ddmfcc12, and short time energy. Again the Wrapper is used for feature selection, and finally 16 features are selected, i.e. mfcc1, mfcc2, mfcc4, mfcc5, mfcc9, mfcc10, mfcc11, dmfcc3, dmfcc4, dmfcc6, dmfcc7, dmfcc11, ddmfcc4, ddmfcc5, ddmfcc12, and short time energy.
3.3. Combination of Motion and Audio Features
A physical bullying event is usually accompanied with verbal bullying or curses. Therefore, speech emotions can be used to assist physical bullying detection. In this section, motion features and audio features are combined to form a new classifier input vector.
In previous subsections, 11 motion features and 16 audio features have been selected, i.e., totally 27 features are selected for physical bullying detection. This amount is also too large for classification. However, both the motion features and the audio features are already the best selection, so feature selection methods should not be used again to reduce the feature dimension. Instead, dimensionality reduction methods are applied. PCA (Principal Component Analysis) and LDA (Linear Discriminant Analysis) are two commonly used dimensionality reduction methods. Section 5 will compare the effects of the two methods by simulation.
4. Classifier Design
During the data gathering phase, the labels of the samples are known, so supervised learning is used. Since the ultimate goal of this research work is to apply the bullying detecting algorithm on portable terminals such as smartphones which are resource-limited, the computational cost of the algorithm should be as little as possible. Therefore, off-line learning is used. Commonly used off-line supervised learning classifiers include Bayesian classifier, SVM (Support Vector Machine), BPNN,
etc.
• Bayesian classifier: Bayesian classifier relies on the priori probabilities of different activity types which are difficult to acquire for the unforeseen school bullying case, so Bayesian classifier does not fit this paper.
• SVM: SVM solves support vectors with quadratic programming, and quadratic programming
involves computation of mth order matrices where m is the number of samples. When m is large, matrix storage and computational cost are large, which is a challenge to future practical use.
In fact, there are other classifiers which can also be used for this paper’s situation. However, this paper focuses on the effect of motion-audio combined features versus merely motion features or audio ones upon classification, so the authors are not going to test all available classifiers, but just to choose one that has been proved to be effective.
4.1. Back Propagation Neural Network
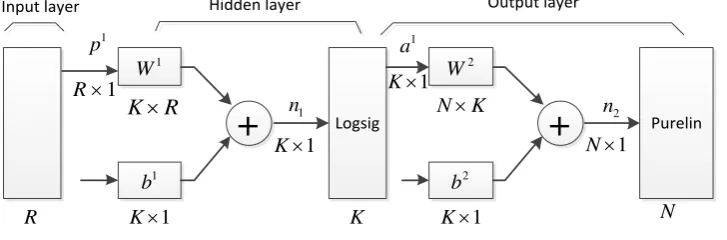
The BPNN models the input into non-linear combinations for class prediction. Common used transfer functions in BPNN include logsig, tansig, and purelin. If the output layer uses logsig, the output range is [0, 1]; if the output layer uses purelin, the output range is not limited. BPNN can have one or more hidden layers. The hidden layer neuron usually uses an S-type transfer function, whereas the output layer neuron usually uses a linear transfer function.
4.1.1. Parameter Setting of BPNN
When using BPNN for classification, parameters should be set first according to the specific task. The number of inputs of the network equals to the dimension of the input feature vector, and the number of neurons in the output layer equals to the number of classes. The number of neurons in the hidden layer is usually set to be larger than the extraction of a root of the sum of the input dimension and the output dimension empirically.
For the setup of the hidden layer, on one hand, the characteristics of different types of activities should be highlighted; on the other hand, overfitting should be avoided. Empirically, this paper chooses to set up one hidden layer in which logsig is used, and purelin is used in the output layer. Fig. 2 shows the structure of the constructed BPNN model.
Logsig
Fig. 2. Constructed BPNN model.
4.1.2. Training of BPNN
There are three methods for training BPNN, namely Gradient Descent, Newton Method, and Lenvenberg-Marquardt (L-M).
xxx-10
For the purpose of practical use, computational complexity and energy consumption should be taken into consideration besides accuracy. If one’s action keeps unchanged for a long time, bullying detection is not always necessary during this period. Therefore, this paper proposed an action transition detection algorithm. Only when an action transition event is detected, bullying detection algorithm is executed, which can save a number of computation.
As a computational complexity reducing algorithm, its own computational complexity should be as little as possible. By watching the curves of acceleration and gyro during different action transitions, it is found that the variation of the vertical acceleration can best describe an action transition. Set the length of the sliding window which detects action transition points to be 40, and each time it slides 20 samples, i.e., the overlap ratio is 50%. Measure the variation of the vertical
detection algorithm runs. The length of bullying detection sliding window is 256 of which the center is the action transition point, and each time it slides 128 samples. If a different action has not been
detected after two slides, the bullying detection stops and action transition detection continues. Numerical results will be given in Section 5.5.
5. Simulations
5.1. Bullying Detection with Motion Features
The authors firstly tried to recognize bullying events with motion features only as they did in their previous work23, 24. The BPNN is trained by the L-M method, and parameters are set experimentally. The number of neurons in the hidden layer is set to be 6. The transfer function of the hidden layer is
logsig, whereas that of the output layer is purelin. Ten-fold cross validation is used. The involved motion features are the 11 features selected by Wrapper in Section 3.1.2, and the confusion matrix is given in Table 3.
Table 3.Confusion matrix of school bullying detection with motion features (%).
Classified
as Hit Push
Push
down Walk Run Jump
Fall
down Play
1 Stand 2
Hit 50.0 10.0 13.3 0.0 3.3 0.0 3.3 20.0 0.0
Push 8.3 68.3 9.3 0.0 1.7 6.7 6.7 0.0 0.0
Push down 0.0 3.3 40.0 10.0 0.0 3.3 10.0 23.3 10.0
Walk 2.5 1.3 7.5 43.8 0.0 0.0 0.0 42.5 2.5
Run 0.0 1.4 0.0 0.0 91.4 5.7 0.0 0.0 1.4
Jump 0.0 0.0 0.0 0.0 12.5 87.5 0.0 0.0 0.0
Fall down 0.0 20.0 6.7 0.0 0.0 0.0 66.7 6.7 0.0
Play 4.2 5.0 15.0 5.8 0.0 2.5 4.2 60.8 2.5
Stand 0.0 0.0 1.1 1.1 0.0 0.0 0.0 3.3 94.4
1“Play” includes several types of games or sports, e.g. playing balls such as Ping-Pong. Games and sports
with lots of run are listed in “Run”.
2“Stand” does not mean standing straight, but with slight body movement as people do in real life.
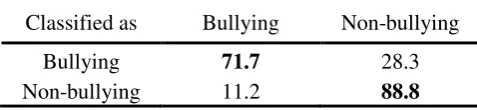
Since the purpose of this work is to identify bullying events and distinguish them from non-bullying ones, classify the activities only as “bullying” or “non-bullying”. “Hit”, “Push”, and “Push down” are “bullying”, whereas “Walk”, “Run”, “Jump”, “Fall down”, “Play”, and “Stand” are “non-bullying”. The confusion matrix is given in Table 4.
Table 4. Confusion matrix of school bullying detection with motion features (%).
Classified as Bullying Non-bullying
Bullying 71.7 28.3
Non-bullying 11.2 88.8
xxx-12
not involved in [24] are easily confused with other activities. The classifier in [23] is not comparable because it cannot classify so many types of activities due to thresholds determination problem.
5.2 Bullying Detection with Audio Features
Then the authors test the effect of audio features upon bullying detection. Here the emotions are not classified as specific emotions, e.g. joy and sorrow, but into bullying and non-bullying, as the authors did in Section 5.1.
In the BPNN, the number of neurons in the hidden layer is set to be 5 experimentally. The transfer function of the hidden layer is logsig, whereas that of the output layer is purelin. The confusion matrix is given in Table 5.
Table 5. Confusion matrix of school bullying detection with audio features (%).
Classified as Bullying Non-bullying
Bullying 66.8 33.2
Non-bullying 25.4 74.6
Precision=70.7%, accuracy=73.6%, recall=66.8%, and F1=68.0%. It is clear that audio features can be used for school bullying detection, but the result is not as good as that of motion features. This is possibly because that the voice signals contain multiple emotions, and the recognition of mixed emotions is more difficult than that of single emotion.
5.3 Bullying Detection with Motion-audio Combined Features
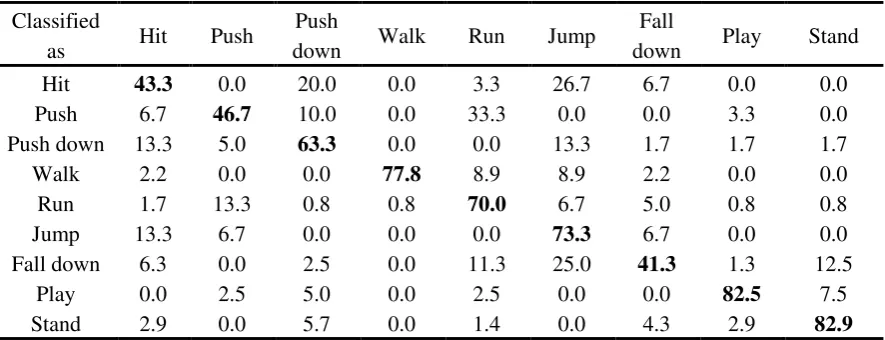
In this section, audio features are used to assist motion features for school bullying detection. Speeches are connected with corresponding activities, i.e. bullying speeches are connected with bullying activities, and non-bullying speeches with non-bullying activities. The hidden layer of BPNN is still single-layered with the transfer function logsig, and the number of neurons in the hidden layer is set to be 9 experimentally. The transfer function of the output layer is purelin. The 11 motion features elected in Section 3.1.2 and the 16 audio features elected in Section 3.2 are joined together and put into BPNN. The confusion matrix with 10-fold cross validation is given in Table 6.
Table 6. Confusion matrix of school bullying detection with motion-audio combined features (%).
Classified
as Hit Push
Push
down Walk Run Jump
Fall
down Play Stand Hit 43.3 0.0 20.0 0.0 3.3 26.7 6.7 0.0 0.0
Push 6.7 46.7 10.0 0.0 33.3 0.0 0.0 3.3 0.0
Push down 13.3 5.0 63.3 0.0 0.0 13.3 1.7 1.7 1.7
Walk 2.2 0.0 0.0 77.8 8.9 8.9 2.2 0.0 0.0
Run 1.7 13.3 0.8 0.8 70.0 6.7 5.0 0.8 0.8
Jump 13.3 6.7 0.0 0.0 0.0 73.3 6.7 0.0 0.0
Fall down 6.3 0.0 2.5 0.0 11.3 25.0 41.3 1.3 12.5
Play 0.0 2.5 5.0 0.0 2.5 0.0 0.0 82.5 7.5
Stand 2.9 0.0 5.7 0.0 1.4 0.0 4.3 2.9 82.9
The confusion matrix of 2-class classification result is given in Table 7. Precision=86.6%,
comparing Table 4, Table 5 and Table 7, it can be found that both miss alarm ratio (FN) and false alarm ratio (FP) decline.
Table 7. Confusion matrix of school bullying detection with motion-audio combined features (%).
Classified as Bullying Non-bullying
Bullying 85.8 14.2
Non-bullying 10.8 89.2
5.4. Bullying Detection with Dimension-reduced Motion-audio Combined Features
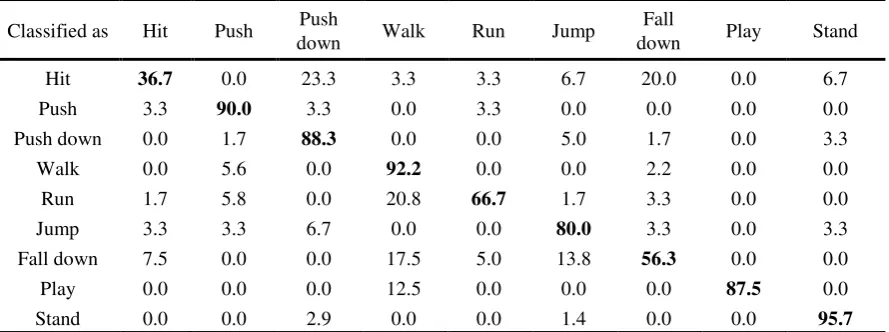
In this subsection, PCA and LDA are tested to find out the better dimensionality reduction method. Parameters of BPNN are the same with those in Section 5.3. Classification results with PCA and LDA are given in Table 8 and Table 9, respectively.
Table 8. Confusion matrix of school bullying detection with PCA (%).
Classified
as Hit Push
Push
down Walk Run Jump
Fall
down Play Stand Hit 46.7 20.0 3.3 20.0 10.0 0.0 0.0 0.0 0.0
Push 6.7 66.7 5.0 3.3 6.7 0.0 10.0 1.7 0.0
Push down 6.7 0.0 33.3 30.0 3.3 0.0 10.0 6.7 10.0
Walk 11.3 2.5 2.5 50.0 12.5 0.0 1.3 7.5 12.5
Run 1.4 1.4 0.0 1.4 91.4 2.9 0.0 1.4 0.0
Jump 0.0 2.5 0.0 0.0 2.5 87.5 7.5 0.0 0.0
Fall down 0.0 10.0 0.0 0.0 0.0 10.0 73.3 6.7 0.0
Play 3.3 2.5 0.8 15.8 4.2 0.0 5.8 60.8 6.7
Stand 0.0 0.0 1.1 6.7 0.0 0.0 7.8 2.2 82.2
Table 9. Confusion matrix of school bullying detection with LDA (%).
Classified as Hit Push Push
down Walk Run Jump
Fall
down Play Stand
Hit 36.7 0.0 23.3 3.3 3.3 6.7 20.0 0.0 6.7
Push 3.3 90.0 3.3 0.0 3.3 0.0 0.0 0.0 0.0
Push down 0.0 1.7 88.3 0.0 0.0 5.0 1.7 0.0 3.3
Walk 0.0 5.6 0.0 92.2 0.0 0.0 2.2 0.0 0.0
Run 1.7 5.8 0.0 20.8 66.7 1.7 3.3 0.0 0.0
Jump 3.3 3.3 6.7 0.0 0.0 80.0 3.3 0.0 3.3
Fall down 7.5 0.0 0.0 17.5 5.0 13.8 56.3 0.0 0.0
Play 0.0 0.0 0.0 12.5 0.0 0.0 0.0 87.5 0.0
Stand 0.0 0.0 2.9 0.0 0.0 1.4 0.0 0.0 95.7
The confusion matrices of 2-class classification with PCA and LDA are given in Table 10 and Table 11, respectively.
xxx-14
Table 10. Confusion matrix of bullying detection with PCA on motion-audio features (%).
Classified as Bullying Non-bullying
Bullying 93.5 6.5
Non-bullying 33.3 66.7
Table 11. Confusion matrix of bullying detection with LDA on motion-audio features (%).
Classified as Bullying Non-bullying
Bullying 94.0 6.0
Non-bullying 14.2 85.8
In the authors’ previous work24, precision=93.3%, accuracy=78.4%, recall=72.8%, F
1=81.8%. In this work, precision=92.2%, accuracy=82.4%, recall=85.8%, F1=88.5%. It can be seen that the average recognition performance has been improved. Moreover, it should be noted that in their previous work24, “push down” and “fall down” were not involved which can have high misclassification ratios according to [23]. As mentioned before, the classifier in [23] is not comparable because it cannot classify so many activity types.
The average recognition performance with LDA is better than that without any dimensionality reduction method. This is possibly because that not all the selected features are helpful for classification, on the contrary, some features are even harmful.
5.5. Computational Cost Comparison with Action Transition Detecting Algorithm
Since the purpose of this study is school bullying detection, so the authors do not care about action transitions from one type of daily-life activity to another, but those from daily-life activities to bullying ones. Moreover, action transitions from bullying activities to any are ignored, because bullying events have already been detected, and it does not matter what follows. In this action transition experiment, the victims firstly acted a certain daily-life activity for 10 seconds, and then bullies bullied them. Table 12 gives a comprehensive numerical result of how computational complexity can be reduced with the proposed action transition detection method.
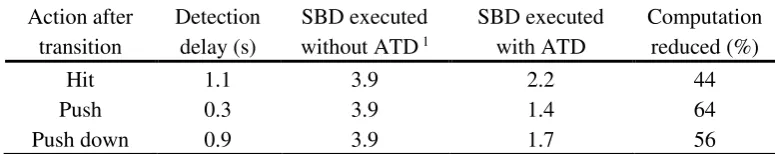
Table 12. Average performance of action transition detecting algorithm.
Action after transition
Detection delay (s)
SBD executed without ATD 1
SBD executed with ATD
Computation reduced (%)
Hit 1.1 3.9 2.2 44
Push 0.3 3.9 1.4 64
Push down 0.9 3.9 1.7 56
1 “SBD” is short for school bullying detection algorithm, and ATD is short for action transition detection
algorithm.
Although ATD is executed 6.4 times as frequent as SBD, the computational cost of ATD is far less than that of SBD. In a SBD procedure, firstly 11 motion features and 16 audio features are extracted, and then LDA is executed, followed by BPNN classification. Whereas in an ATD procedure, only one sum of squares and one comparison are calculated, which can be ignored compared with SBD.
is not likely to happen whereas “play -> hit” is possible. Therefore, the reduced computations are different.
It should be mentioned that in this experiment, all the action transition points have been detected. Although the transition from daily-life activities to hit has a longer response time than the other two, the transition point can still be detected as long as the hit action lasts for more than 1.1s.
6. Conclusions
This paper proposed a school bullying detection method with motion-audio combined features. For motion features, time-domain features and frequency-domain features were extracted, and for audio features, classical MFCCs were extracted. Then Wrapper was used for feature selection on motion features and audio features respectively. After combining motion features and audio features together, LDA was applied for further dimensionality reduction. A BPNN trained with L-M was used for classification. On the other hand, an action transition detection algorithm was proposed to reduce computational complexity for the purpose of practical use. Simulation results showed that the proposed school bullying detection method achieved higher recognition performance than the authors’ previous work, and the proposed action transition method saved averagely half of the computations.
Acknowledgments: This work was supported by the National Natural Science Foundation of China
(61602127), and partly supported by the Directorate General of Higher Education, Indonesia (2142/E4.4/K/2013), and the Finnish Cultural Foundation, North Ostrobothnia Regional Fund.
The authors would like to thank Tuija Huuki and Vappu Sunnari (University of Oulu, Finland) for educational and psychological guidance in the school bullying experiments, teachers Taina Aalto and Pekka Kurttila and principal Maija Laukka (Oulunlahti School, Finland) for arranging the experiments, pupils from 2nd and 6th grades of Oulunlahti School for acting the experiments, Seppo Laukka and Antti Siipo (University of Oulu, Finland) for hardware and technical support during the experiments, Tian Han, Zhu Zhang (Harbin University of Science and Technology, China) for assisting the experiments, and Yubo Zhang, Jifu Shi and Zhi Xun (Harbin Institute of Technology, China) for discussion about feature selection.
References
1. J. Sharon, Bullying survey: most teens have hit someone out of anger, USA Today, Oct. 26, (2010).
2. L. Wanyu and S. Dandan, Analysis of school violence in Japan, Heihe Journal, 6 (2011) 204-205.
3. The ninth European Forum on the rights of the child, Coordination and cooperation in integrated child protection systems, Apr. 30 (2015).
4. R. Lun and W. Zhao, A survey of applications and human motion recognition with Microsoft Kinect, International Journal of Pattern Recognition and Artificial Intelligence, 29(5) (2015) 1-49.
5. L. Qiang, H. Qi and S. Limin, Collaborative recognition of queuing behavior on mobile phones,
IEEE Trans. Mobile Computing, 15(1) (2016) 60-73.
6. G.-C. Enrique and F.B. Ramon, An improved three-stage classifier for activity recognition,
International Journal of Pattern Recognition and Artificial Intelligence, 32(1) (2018).
7. Y. Xizhe, S. Weiming, J. Samarabandu, et al., Human activity detection based on multiple smart phone sensors and machine learning algorithms, IEEE 19th International Conference on Computer Supported Cooperative Work in Design (CSCWD), (2015) 582-587.
xxx-16
9. S. Aino, A. Esko, S. Hannu, et al., A two-threshold fall detection algorithm for reducing false alarms, 2012 6th International Symposium on Medical Information and Communication Technology, (2012) 1-4.
10. G. Hache, E.D. Lemaire and N. Baddour, Wearable mobility monitoring using a multimedia smartphone platform, IEEE Trans. Instrum. Meas., 60(9) (2011) 3153-3161.
11. W. Chung-Hsien and L. Wei-Bin, Emotion recognition of affective speech based on multiple classifiers using acoustic-prosodic information and semantic labels, IEEE Trans. Affective Computing, 2(1) (2011) 10-21.
12. P. Song and W. Zheng, Feature selection based transfer subspace learning for speech emotion recognition, IEEE Trans. Affective Computing, (2018) 1-11.
13. H. Yongming, W. Ao, Z. Guobao, et al., Extraction of adaptive wavelet packet filter-bank- based acoustic feature for speech emotion recognition, IET Signal Processing, 9(4) (2015) 341-348.
14. J. Deng, X. Xu, Z. Zhang, et al., Semisupervised autoencoders for speech emotion recognition,
IEEE/ACM Transactions on Audio, Speech, and Language Processing, 26(1) (2018) 31-43. 15. A.D. Dileep, C.C. Sekhar, GMM-based intermediate matching kernel for classification of
varying length patterns of long duration speech using Support Vector Machines, IEEE Trans. Neural Networks & Learning Systems, 25(8) (2014) 1421-1432.
16. W. Kunxia, A. Ning, L. Bing Nan, et al., Speech emotion recognition using Fourier parameters.
IEEE Trans. Affective Computing, 6(1) (2015) 69-75.
17. D.Z. Marius, M.F. Silvia, A study about the automatic recognition of the anxiety emotional state using Emo-DB, 2015 E-Health and Bioengineering Conference (EHB), (2015) 1-4.
18. K. Scherer, Vocal communication of emotion: a review of research paradigms. Speech communication, 40(1-2) (2003) 227-256.
19. Y. Liu, S.C.H. Subramaniam, O. Sourina, et al., EEG-based mental workload and stress recognition of crew members in maritime virtual simulator: a case study, 2017 International Conference on Cyberworlds (CW), (2017) 64-71.
20. L. Vanitha and G.R. Suresh, Hybrid SVM classification technique to detect mental stress in human beings using ECG signals, 2013 International Conference on Advanced Computing and Communication Systems, (2013) 1-6.
21. Y. Sung-Nien and C. Shu-Feng, Emotion state identification based on heart rate variability and genetic algorithm, Engineering in Medicine and Biology Society (EMBC). 2015 37th Annual International Conference of the IEEE, (2015) 538-541.
22. G. Yongbin, L. Hyo Jong and R.M. Mehmood, Deep learning of EEG signals for emotion recognition, 2015 IEEE International Conference on Multimedia & Expo Workshops (ICMEW), (2015) 1-5.
23. L. Ye, H. Ferdinando, T. Seppänen, et al., Physical violence detection for preventing school bullying. Advances in Artificial Intelligence, 2014 (2014) 1-9.
24. L. Ye, H. Ferdinando, T. Seppänen, et al., An instance-based physical violence detection algorithm for school bullying prevention. 2015 International Wireless Communications and Mobile Computing Conference (IWCMC), (2015) 1384-1388.
25. H. Ferdinando, L. Ye, T. Seppänen, et al., Emotion recognition by heart rate variability,
Australian Journal of Basic and Applied Sciences, Special 8(14) (2014) 50-55.
26. H. Ferdinando, T. Seppänen and E. Alasaarela, Enhancing emotion recognition from ECG signals using supervised dimensionality reduction, Proceeding of 6th International Conference on Pattern Recognition Applications and Methods (ICPRAM) (2017) 112-118.
27. H. Ferdinando, L. Ye, T. Han, et al., Violence detection from ECG signals: a preliminary study.
Journal of Pattern Recognition Research, 12(1) (2017) 7-18.
29. P.D. Prajakta, S. Kailash and P. Malathi, Speaker dependent speech emotion recognition using MFCC and Support Vector Machine. 2016 International Conference on Automatic Control and Dynamic Optimization Techniques (ICACDOT), (2016) 1080-1084.
30. A. Mohanta, V. K. Mittal, Classifying emotional states using pitch and formants in vowel regions. 2016 International Conference on Signal Processing and Communication (ICSC), (2016) 458-463. Engineering at Harbin Institute of Technology, Harbin, China in 2004, 2007, and 2010, respectively. His research area includes wireless sensor networks, ad hoc networks, body area networks and pattern recognition. He is an assistant researcher and master tutor in the Department of Information and Communication Engineering, Harbin Institute of Technology, Harbin, China. He is also a visiting scholar and doctoral at the Health and Wellness Measurement research group, OPEM unit, University of Oulu, Oulu, Finland.
Peng Wang recevied his B.E. and M.E. degrees from the Department of Information and Communication Engineering at Harbin Institute of Technology, Harbin, China in 2015 and 2017, respectively. His main research area includes pattern recognition, artificial intelligence, and radio communication network. He is now with China Electronics Technology Group Corporation.
Le Wang received her B.E. from the Department of Information and Communication Engineering at Harbin Institute of Technology, Harbin, China in 2017. She is now a master graduate student at Harbin Institute of Technology. Her research area includes computer vision, computer graphics and FPGA.
Hany Ferdinando received his M.Sc. degree in Electrical Engineering from the University of Twente, Enschede, Netherlands in 2004. His research area covers the application of signal processing for sensory and control systems. Currently, he is a lecturer at the Department of Electrical Engineering, Petra Christian University, Surabaya, Indonesia. He is also a doctoral at the Health and Wellness Measurement research group, OPEM unit, University of Oulu, Oulu, Finland.