CASCADE DATA USE MANUAL
TO IDENTIFY
GAPS IN HIV AND
HEALTH SERVICES
FOR PROGRAMME
IMPROVEMENT
JUNE 2018
HIV STRATEGIC INFORMATION FOR IMPACT
CASCADE DATA USE MANUAL
TO IDENTIFY
GAPS IN HIV AND
HEALTH SERVICES
FOR PROGRAMME
IMPROVEMENT
JUNE 2018
Cascade data use manual: to identify gaps in HIV and health services for programme improvement
ISBN 978-92-4-151441-5
© World Health Organization 2018
Some rights reserved. This work is available under the Creative Commons Attribution-NonCommercial-ShareAlike 3.0 IGO licence (CC BY-NC-SA 3.0 IGO; https://creativecommons.org/licenses/by-nc-sa/3.0/igo).
Under the terms of this licence, you may copy, redistribute and adapt the work for noncommercial purposes, provided the work is appropriately cited, as indicated below. In any use of this work, there should be no suggestion that WHO endorses any specific organization, products or services. The use of the WHO logo is not permitted. If you adapt the work, then you must license your work under the same or equivalent Creative Commons licence. If you create a translation of this work, you should add the following disclaimer along with the suggested citation: “This translation was not created by the World Health Organization (WHO). WHO is not responsible for the content or accuracy of this translation. The original English edition shall be the binding and authentic edition”.
Any mediation relating to disputes arising under the licence shall be conducted in accordance with the mediation rules of the World Intellectual Property Organization.
Suggested citation. Cascade data use manual: to identify gaps in HIV and health services for programme improvement. Geneva: World Health Organization; 2018. Licence: CC BY-NC-SA 3.0 IGO.
Cataloguing-in-Publication (CIP) data. CIP data are available at http://apps.who.int/iris.
Sales, rights and licensing. To purchase WHO publications, see http://apps.who.int/bookorders. To submit requests for commercial use and queries on rights and licensing, see http://www.who.int/about/licensing.
Third-party materials. If you wish to reuse material from this work that is attributed to a third party, such as tables, figures or images, it is your responsibility to determine whether permission is needed for that reuse and to obtain permission from the copyright holder. The risk of claims resulting from infringement of any third-party-owned component in the work rests solely with the user.
General disclaimers. The designations employed and the presentation of the material in this publication do not imply the expression of any opinion whatsoever on the part of WHO concerning the legal status of any country, territory, city or area or of its authorities, or concerning the delimitation of its frontiers or boundaries. Dotted and dashed lines on maps represent approximate border lines for which there may not yet be full agreement.
The mention of specific companies or of certain manufacturers’ products does not imply that they are endorsed or
recommended by WHO in preference to others of a similar nature that are not mentioned. Errors and omissions expected, the names of proprietary products are distinguished by initial capital letters.
All reasonable precautions have been taken by WHO to verify the information contained in this publication. However, the published material is being distributed without warranty of any kind, either expressed or implied. The responsibility for the interpretation and use of the material lies with the reader. In no event shall WHO be liable for damages arising from its use.
ACKNOWLEDGEMENTS ... vi
ABBREVIATIONS AND ACRONYMS ... vii
EXECUTIVE SUMMARY ... 1
1. BACKGROUND ... 2
2. HIV CARE AND TREATMENT CASCADES ... 17
3. DISAGGREGATED HIV CASCADE ANALYSIS ... 22
3.1 Cascades for subnational units ... 22
3.2 Cascades for key populations ... 22
3.3 Example of a key population cascade ... 26
4. PREVENTION, CARE AND TREATMENT CASCADE FOR PREVENTION OF MOTHER-TO-CHILD TRANSMISSIONS .. 27
4.1 Core indicators and data sources ... 28
4.2 Examples of prevention, care and treatment cascades for maternal-child transmission ... 30
5. CARE AND TREATMENT CASCADES FOR HIV CO-MORBIDITIES ... 32
5.1 HIV-hepatitis B virus co-infection ... 32
5.2 HIV-hepatitis C virus co-infection ... 34
5.3 HIV-associated tuberculosis ... 37
6. INDIVIDUAL-LEVEL LONGITUDINAL CASCADES ... 43
6.1 Longitudinal care cascade among persons newly diagnosed with HIV ... 44
6.2 Longitudinal care cascade among persons newly diagnosed with HIV ... 46
6.3 Longitudinal care cascades among persons newly initiating ART ... 47
6.4 Examples of longitudinal cascades ... 48
7. WORKING WITH IMPERFECT DATA ... 49
7.1 Strengths and limitations of commonly used data sources ... 49
7.2 Common biases and limitations in data used for cascade analysis ... 50
7.3 Multiple data sources ... 50
7.4 Assessing data quality ... 51
8. INTERVENTIONS TO IMPROVE DATA QUALITY FOR CASCADE ANALYSIS ... 52
9. INTERPRETING AND USING DATA FROM CASCADE ANALYSES ... 53
9.1 Analysing cascade data ... 53
9.2 Addressing gaps in the cascade ... 53
10. ADDITIONAL BIBLIOGRAPHY ... 56
ANNEX: SUPPLEMENTAL INDICATORS ... 57
ACKNOWLEDGEMENTS
The concepts and material presented in this publication were informed by three workshops organised with several countries and held in 2015, 2016 and 2017 around HIV cascade analysis. WHO would like to acknowledge the contributions of the participants of these meetings, including staff of national AIDS programmes and experts in various fields related to HIV surveillance, patient monitoring and unique identifiers .
WHO would like to thank the individuals who contributed to this document, including George Rutherford and Ivana Bozicevic for preparing this document.
WHO would like also to extend special thanks to UNAIDS and United States Centers for Disease Control and Prevention staff, Sadna Patel, John Aberle-Grasse, Annabel Baddely and Avinash Kanchar, WHO staff that contribute in meetings and technical revisions to this document.
Jesus M Garcia-Calleja and Daniel Low Beer (WHO) coordinated the overall process of the development of this tool.
Financial acknowledgement
Funding to support this work come from the United States President’s Emergency Plan for AIDS Relief (PEPFAR) and the Bill and Melinda Gates Foundation
ABBREVIATIONS
ALT Alanine aminotransferase
APRI Aspartate aminotransferase-to-platelet ratio index
ART Antiretroviral therapy
ARV Antiretrovirals
DAA Direct-acting antivirals
HBV Hepatitis B virus
HBeAg Hepatitis E antigen
HBsAg Hepatitis B surface antigen
HCV Hepatitis C virus
HTC HIV testing and counselling
IBBS Integrated bio-behavioural survey
KP Key population
KPLHIV Key population member living with HIV
MSM Men who have sex with men
NAT Nucleic acid test
NGO Non-governmental organization
PEPFAR President’s Emergency Plan for AIDS Relief
PLHIV People living with HIV
PMTCT Prevention of mother-to-child transmission
PrEP Pre-exposure prophylaxis
PW Pregnant women
PWID People who inject drugs
STI Sexually transmitted infection
TB Tuberculosis
UNAIDS United Nations Joint Programme on HIV/AIDS
VMMC Voluntary medical male circumcision
EXECUTIVE SUMMARY
Purpose
This guide supports the use of data to identify and fill gaps in services in order to improve HIV and health programmes. Following from the Consolidated Strategic Information Guidelines, high-level indicators are organized along a cascade of services which are linked to achieve outcomes. The guide supports the ways in which these cascade data are analysed and used to identify gaps and better link services. Countries, programme managers, health workers and other stakeholders have indicated the importance of consolidating World Health
Organization (WHO) guidance for constructing HIV cascades into a single document. This manual addresses not only the HIV care and treatment cascade but also cascades for HIV prevention interventions, such as prevention of mother-to-child transmission, and for co-infections with hepatitis B virus (HBV), hepatitis C virus (HCV) and tuberculosis (TB). The use of cascades is integral to achieving the 90-90-90 global HIV targets (1) and represents one of the key monitoring strategies for supporting expansion and linkage of HIV care, treatment and prevention services (2).
This manual provides guidance on:
1. Constructing various HIV cascades, and identifying and interpreting reasons for gaps and linkages along the cascade.
2. Understanding how cascades can be used to assess whether interventions have been effective and are well linked to each other along a results chain in order to achieve outcomes.
3. Understanding how biases in the data used to construct the cascades can affect interpretation of the findings.
4. A step-by-step approach to developing and interpreting findings from cascades for HIV care and treatment, HIV prevention and HIV co-infections with HBV, HCV and TB.
5. Disaggregating cascades for key and other populations and subnational geographical areas for local planning.
6. Aligning definitions and use of cascades and indicators so they can be used between national programmes, partners (e.g. the Global Fund, PEPFAR), and at national, district and facility levels.
1. BACKGROUND
The widespread scale-up of HIV prevention, care and treatment worldwide has led to the possibility of ending the AIDS epidemic as a public health threat by 2030 (1). In particular, the Joint United Nations Programme on HIV/AIDS (UNAIDS) estimates that this can be achieved if by 2020 90% of all persons living with HIV (PLHIV) are aware of their HIV status, 90% of all people who know their status are receiving antiretroviral therapy (ART), and 90% of those on ART are virally suppressed (2). There are parallel global goals to
reduce HIV incidence to less than 500 000 new infections in 2020 and to fewer than 200 000 in 2030 (2) and to eliminate mother-to-child transmission to ≤50 new paediatric infections per 100 000 live births (3).1
Reaching these goals requires using data more actively to identify gaps and strengthen linkages in a cascade of indicators of HIV prevention, care and treatment to improve programmes (Box 1.1).
1.1
Cascades – focusing data on gaps
and linkages in services
Box 1.1
What is a cascade?
Cascades are frameworks for monitoring gaps in programme services needed to achieve goals and health outcomes. Cascades consist of a results chain or a series of sequential events in which each event is linked to achieve a health outcome. Cascades are usually depicted as vertical bar graphs where the total affected population is in the left-hand column. The ultimate goal is depicted in the right-hand column. The height of the columns in-between show the number of people reached by the sequence of actions needed to achieve the goal. Comparing the columns highlights the gaps and linkages at each step (e.g. between testing and treatment or between treatment and viral suppression). The height of the columns can be represented either as a number or as a proportion of the left-hand column (i.e. the total affected population). The analysis of data in a cascade framework can then be used to assess the gaps and linkages needed at each stage to achieve an outcome (e.g. between testing, treatment and viral suppression). Indicators are not analysed in isolation, but as part of an overall framework or results chain, to describe and improve a health programme.
Cascades are frameworks for quantifying the magnitude of the gaps in HIV diagnosis, treatment, care and prevention among persons with, or at risk of, HIV infection. The purpose of cascades is:
• to quantify the magnitude of the gaps along the continuum of HIV prevention, diagnosis, care and treatment;
• to identify where, along the steps of the continuum, programmes can improve linkage and retention of people in HIV prevention, care and treatment; • to identify and analyse causes of the gaps and
priorities to fill them;
• to link programme services to their goals and outcomes (e.g. the 90-90-90 targets2 to achieve reductions in mortality and incidence);
• to provide information for planning, prioritizing and designing targeted interventions and for improving the existing monitoring and evauation system; and • to improve the quality of prevention, diagnosis,
care and treatment focused on the package of services a person requires.
Cascades consist of a series of sequential events in which each event is contingent on having achieved the preceding event until the final outcome is reached (Figure 1.1). HIV cascades have been constructed so that the final outcome is one that will have a positive effect on reducing HIV incidence, morbidity and mortality.
1 The definition for elimination of mother-to-child transmission of HIV is ≤50 new paediatric infections per 100 000 live births and a transmission rates of <5% in breastfeeding populations or <2% in non-breastfeeding populations.
Figure 1.1
Using the cascade to highlight gaps and linkages in HIV services - Philippines
The events included in cascades are referred to as indicators. The indicators are defined and prioritized in the WHO Consolidated Strategic Information Guidelines. This cascade data use manual supports how to analyse them and use them to improve programmes.
1.1.1 Using data to identify programme gaps at national
and sub national levels
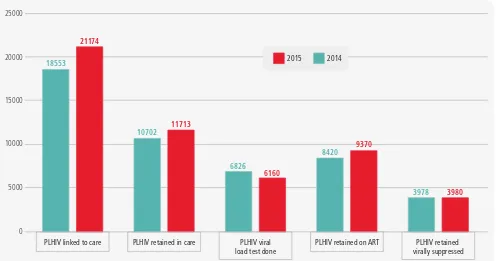
The value of calculating the cascade indicators is that they can offer an efficient way to visualize and identify programmatic gaps in need of intervention in order to achieve the final goal. Monitoring care cascade indicators over time is a useful way to judge the impact of new or additional efforts to increase programme impact (Figure 1.2).
Figure 1.2
Using the cascade to show how programme gaps are closed over time - Jamaica
45 000
40 000
35 000
30 000
25 000
20 000
15 000
10 000
5 000
0
Retained on ART (12m) 3 094 On ART
12 533 In HIV care
13 641 Diagnosed with HIV
28 826 PLHIV
42 389
Viral Load Suppressed 2 761 68%
32% 30%
PLHIV Diagnosed with HIV In HIV care On ART Retained on ART (12m) Viral Load Suppressed
0 5000 10000 15000 20000 25000
2014 2015
PLHIV linked to care PLHIV retained in care PLHIV viral load test done
PLHIV retained on ART PLHIV retained virally suppressed 18553
21174
10702
6826
6160
8420
9370
3980
3978
HIV cascades have been used most commonly for measuring and monitoring indicators along the HIV care continuum (4) although they are increasingly applied to HIV co-infections such as chronic hepatitis B virus (HBV) infection, hepatitis C virus (HCV) infection and tuberculosis and to HIV-infected pregnant women, as well as to HIV prevention programmes that go beyond the prevention of perinatal transmission.
HIV cascades can be constructed for the general population or for key populations (KP). Cascades can use national or subnational data and can be disaggregated by sex, age, KP, geographical region and even at the individual clinic level. A beneficial by-product of constructing cascades is that the analytic process may also identify areas where the quality and availability of data to monitor HIV care, treatment and prevention can be improved (Figures 1.3, 1.4).
Figure 1.3
Using standard cascades to highlight subnational gaps, Thailand
Figure 1.4
County-level cascade analysis to identify and fill programme gaps in the 90-90-90
targets, Kenya
County 1st 90 2nd 90 3rd 90
In general, cascade indicators represent the targets that we want to achieve. An ideal cascade is flat: 100% of people with HIV have been diagnosed, treated and achieved virological suppression. For this reason, indicators that may appear reasonable for inclusion in a cascade may be omitted. For instance, for prevention of
mother-to-child transmission (PMTCT), indicators such as the proportion of pregnant women offered HIV testing have been omitted before the number of pregnant women with HIV infection because there will be a large drop-off in the cascade from the number testing negative.
1.2
Types of cascades
This section provides an introduction to the cascades which can be used to highlight different programme gaps. It shows the basic indicators that are used (usually 3-5) which can be standardized and disaggregated. The following chapters provide more detail, which should be used when there are programme benefits. Limiting the number of indicators in cascade analysis is recommended to simplify data collection so long as it allows greater disaggregation and use of routine data for programme improvement.
1.2.1 Cascades for HIV care and treatment
Cascades for HIV care and treatment were first used in 2005 (7,8) and later came into general use (9,10) and have become ubiquitous in HIV care and treatment monitoring programmes. Excellent early guidance came from WHO’s Western Pacific Regional Office and Eastern Mediterranean Regional Office (11,12). These cascades are based on the linked sequence of steps for care and treatment to achieve outcomes of reduced mortality and incidence:
• They typically start with the estimated number of PLHIV in a given country or subnational region. This should be disaggregated by gender (and where possible age), geographical region, HIV-TB, and KP, so that the cascade indicates which populations should be reached and which can link effectively to outreach and prevention; • This is followed by the number of people who have
been diagnosed, including additional analysis of positivity yield3 in different areas;
• Next comes the number of persons who have been started on antiretroviral therapy (ART), with supporting analysis of adherence rates and retention;
• The final bar of the cascade shows the number of persons who are virologically suppressed (Figure 1.1), with additional analysis of the coverage of viral load testing.
An additional bar may be added for the number of persons who have been linked to care.
These four steps are sufficient for overall cascade analysis. To understand the gaps at each stage and to improve programmes, the steps require additional analysis– of the stage the epidemic is at, the testing strategies to increase diagnosis, where losses to follow-up are occurring and for which population group, and the coverage and representativeness of viral load suppression data. Cascade analysis is about data analysis to improve the programme, and not just about reporting the numbers.
A simple cascade framework of a few well defined steps supports this data analysis and allows the same framework to be used at national, district and facility levels and among different populations. The major value of a consistent cascade framework is to promote data use, comparison by time, person and place, and actions to improve the programme.
Percentages can also be used on cascades to indicate the proportion of persons who have achieved the goal divided by the total number affected and, for instance, to assess progress towards the 90-90-90 targets (Figures 1.5 and 1.6).
Figure 1.5
Cascade analysis to quantify progress and gaps towards the 90-90-90 targets
Figure 1.6
Surveys also provide population-level data for cascades, used by PEPFAR and
Global Fund to identify gaps for funding, ZIMPHIA, Zimbabwe
(1) PLHIV population (3) Linkage to care (4) Currently on ART (5) Viral suppression (VL <40 copies) (2) Knowing HIV status
(Diagnosed)
228 582 126 604
205 724
185 151
166 636
98 325 60 753 47 205
55% 90%
90%
90%
43%
27%
21%
0 100
Diagnosed On treatment* Virally suppressed*
Female Male Total
PLHIV (%)
77.1%
87.3%
87.9%
74.2%
86.8%
86.5% 69.7%
86.0%
84.1%
1.2.2 Cascades for HIV prevention
Cascades can also be used to depict HIV prevention efforts, where a sequence of actions is particularly important in achieving outcomes. There is increasing work on prevention cascades (12-18), yet these have not yet been standardized and at this stage are not specifically included in this manual. However, in analysing the health sector cascade, it is important to include prevention and to ensure balanced priority-setting of actions to fill gaps in both prevention and treatment. Three areas are included in this manual:
• The cascade for care and treatment offers opportunities for linking to prevention
interventions. Links to prevention should be assessed at each stage, particularly when testing (i.e. for persons testing negative or positive) and when providing community adherence to people on treatment and their partners;
• In general, the start of the cascade for care and treatment should disaggregate data on PLHIV
and should develop differentiated strategies that reach key and at-risk populations, combining outreach prevention and treatment. This link is critical for prevention and for generating the flow of diagnoses for the treatment cascade;
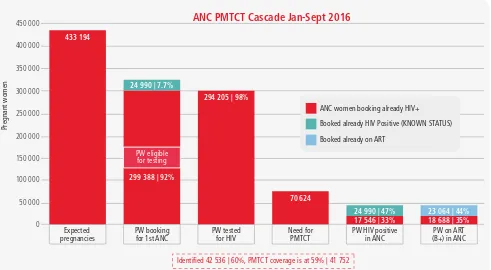
• Cascades to monitor PMTCT of HIV are a special subset of prevention cascades. PMTCT cascades incorporate both treatment (of mothers) and prevention (in infants) with the goals of both prevention of HIV transmission to the baby and enrolment of infected mothers and babies into care and treatment. However, as a prevention cascade, its primary endpoint is the number of uninfected infants (Figure 1.7). PMTCT cascades are described in detail in Chapter 4.
Figure 1.7
PMTCT cascade used on a quarterly basis to identify and fill gaps in the
programme, Zimbabwe
The primary aim of prevention is to prevent people from becoming infected. In contrast to the HIV care and treatment cascade that starts with the number of PLHIV, prevention cascades generally start with the number of uninfected people at risk for HIV infection; people can then be followed across various prevention programmes with an endpoint of not becoming infected.
450 000
ANC women booking already HIV+
Booked already HIV Positive (KNOWN STATUS)
Booked already on ART
Pregnant women
ANC PMTCT Cascade Jan-Sept 2016
Expected
1.2.2.1 Combination of prevention and care: linking prevention to care at each stage of the health sector cascade
Every step of the care and treatment cascade offers an opportunity to provide prevention interventions. For instance, the sexual and needle-sharing partners of PLHIV are at an especially high risk of infection and they would be part of the group at risk for HIV infection. Risk is greatest in the early stage of in infection, during the earliest period of ART before viral load falls and during periods of ART failure when viral load rises again (19). In particular:
• Strategies for diagnosis should provide both prevention and linkage to care services.
• Testing positive provides opportunities for prevention for index cases and their partners.
• Programmes for retention on treatment and
maintainenance of viral suppression (including gaps in viral suppression) also provide opportunities for delivery of prevention to individuals and communities.
• The importance of prevention should be emphasized at each clinical encounter with PLHIV who need access to prevention commodities, and their partners should be referred for outreach prevention interventions.
1.2.2.2 The first 904 – an opportunity for linkage to care and to prevention
The first step of the care and treatment cascade – HIV testing services – offers opportunities:
• for persons diagnosed with HIV to enter into care and achieve viral suppression;
• for persons who test negative but are at risk to be referred to prevention services.
In this cascade, testing has three stages (to which additional steps can be added if they have programmatic value):
1. Risk yield – number and proportion of uninfected people at elevated risk of infection that are identified and differentiated by age, sex and KP;
2. Referral to relevant prevention services – number and proportion of those at risk referred to relevant prevention services. This should be based on differentiation of, for instance, pre-exposure prophylaxis (PrEP), voluntary medical male circumcision (VMMC) and KP programmes;
3. Retesting (and retention) – number and proportion of people retained in the prevention intervention and retested for HIV after a defined period (e.g. after 3, 6 or 12 months). This provides the outcome in terms of keeping at-risk persons free from infection, and also gives insight into HIV incidence rates.
HIV testing can be focused on the positivity yield – the proportion of people diagnosed per total tested. Similarly, prevention can be focused on the proportion of uninfected people at elevated risk of infection who are identified. This risk yield
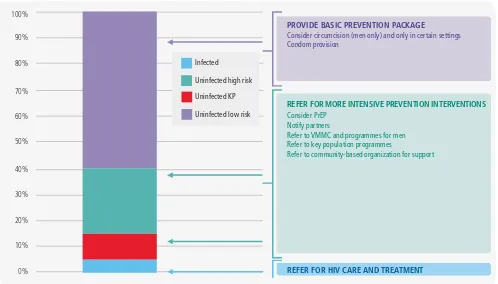
is analogous to positivity yield and can help focus on and differentiate between prevention programmes on individuals and population groups at the highest risk of incident infection. Assessing level of risk can be approached by a series of screening questions (Box 1.2). If the answer to any of the questions is yes, the person should be considered at high risk of HIV infection. This can be presented as a stacked bar graph, where those who are found to be infected move into care and treatment, those at high risk of infection or who are members of key or priority populations receive intensive prevention follow-up, those at some risk receive more modest interventions and those with little or no risk receive counselling and condoms (Figure 1.8).
Training is required so that persons in testing services can engage with prevention and risk among persons testing negative, to refer those in need to differentiated prevention services. This requires programmes to reduce stigma and ensure sensitive conversations, which do not provide a significant burden to the services. In practice, the screening questions should be provided both sensitively and confidentially and it should not take more than two minutes to assess differentiated prevention referral opportunities).
Box 1.2
Examples of questions for
establishing level of risk for persons found
to be uninfected at HIV testing services
• Do you have an HIV-infected sexual partner?
• Have you had ≥2 sexual partners within the last 12 months?
• Have you had sex with a sex worker in the last 12 months?
• Have you had a sexually transmitted infection (STI) in the last 12 months?
• Behaviour questions for KPs or priority populations: have you injected drugs, had sex with other men (for men only), had sex for money, or had an STI in the last 12 months, are you a transgendered person, or have you been a prisoner?
The second stage is referral to relevant prevention
services for those at risk (in particular KP services, PrEP, VMMC, and referral to community-based prevention in local areas of high risk). Prevention should be differentiated on the basis of risk, geographical and individual, to provide the necessary focus to prevention programmes. Differentiation of outreach and prevention should occur before testing, in determining the appropriate strategy, sites and populations for outreach prevention. It should also inform testing strategies on the basis of both positivity and risk yields. The key indicator is the number and proportion of those at risk referred to relevant prevention services. Differentiated prevention linkages should be measured and built into programmes at this stage:
• Consider PrEP. • Notifiy partners.
• Refer men to VMMC and other prevention programmes for men.
• Refer to KP programmes.
• Refer to STI or HCV treatment, or HBV and HPV care. • Referral to a community prevention organization
for support.
For self-testing, the key stage will the confirmation of the test, where linkages to prevention will be of greatest programmatic relevance. At every other level of the care and treatment cascade, the prevention
focus should be on viral suppression – starting ART, retaining PLHIV in care and ensuring that viral replication is suppressed.
Additional data that can be collected, which will allow for further differentiation of risk and provide estimates to prevention programmes of the numbers of persons requiring follow-up, can include age group, circumcision status (men only), condom use, PrEP use, sex and geographical area (Box 1.3).
Box 1.3
Additional question topics to further
characterize risk among persons found to
be uninfected in HIV testing services
• Perception of risk of infection (this is often the best entry question to the assessment, and allows you to listen to the client; it also has value in client-centred prevention cascades)
• Engagement in risk behavious, such as injecting drug use, male to male sex, tattooing
• Age group
• Circumcision status
• Condom use (always, sometimes, never)
• Pre-exposure prophylaxis use
• Sex
• Geographical area
Figure 1.8
Prevention differentiation by risk at HIV testing services
0%
Consider circumcision (men only) and only in certain settings Condom provision
REFER FOR MORE INTENSIVE PREVENTION INTERVENTIONS
Consider PrEP Notify partners
Refer to VMMC and programmes for men Refer to key population programmes
Refer to community-based organization for support
REFER FOR HIV CARE AND TREATMENT
Infected
Uninfected high risk
Uninfected KP
The final stage is retention in quality prevention services and retesting after the recommended period (3, 6 or 12 months) to measure that the person remains uninfected as the outcome. The quality of the prevention package should be defined according to agreed standards, but the outcome of prevention should be retesting and remaining uninfected. The indicator at this stage is:
• retention in the prevention programme and retesting (at a defined time of 3, 6 or 12 months depending on the programme).
This stage will require a separate monitoring system in the prevention or KP programmes, which is not always linked to the testing service. The information on the initial test should be referred to the prevention service, along with subsequent HIV tests. This provides a basic but important prevention link to the core health sector cascade for referring priority populations of young men or women or KPs to differentiated prevention services. The risk yield should also be monitored across different sites to help differentiate, advocate for and focus evidence-based prevention efforts.
1.2.2.3 Linking to separate cascades for individual prevention services
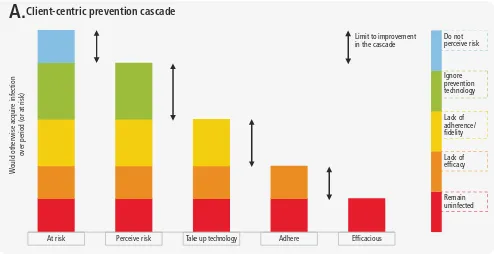
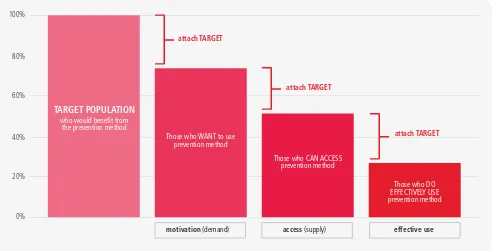
As the prevention cascades are developed for separate services they can further fill in the stages between the three Rs of risk yield, referral and retesting (with retention in the prevention programme). This cascade data use manual focuses on the health sector cascade, stressing the importance of linkage to separate prevention cascades. Such prevention cascades are being developed with a client-centric or an intervention-centric focus, with some key steps, which, as they are standardized, will be further referred to in this manual. The challenge is to keep them practical with some standardized steps so they can be used routinely for programme improvement. The client-centric prevention cascade highlights the gaps in using prevention interventions from the number of persons at risk, the number who perceive they are at risk, the number who take up intervention, the number who adhere to the intervention and the number who achieve the outcome (Figure 1.9).
Figure 1.9
Gaps in client uptake and effective use of prevention
The intervention-centric cascade focuses on risk and the need for an intervention, a linkage to the service, retention in the service and outcomes relating to no infection. The three Rs for testing presented above – i.e. risk yield, referral, retesting (with retention) – also fit into the intervention-centric framework.
This manual stresses the importance of linking clinical care to prevention. Prevention cascades are also delivered as a sequence of steps towards a health outcome. Prevention, as much as treatment, needs data to identify the gaps in delivery and to focus and retain people in its programmes.
The cascades should be simple, with few standard steps with general relevance (additional data can always be provided for each step) and additional complexity added only if it has programmatic benefits. A simple framework from a consultation on prevention cascades is shown in Figure 1.10 which highlights the steps and gaps in delivering effective prevention services. Figure 1.11 provides a practical example from Zimbabwe.
Adhere Perceive risk
At risk Take up technology Efficacious
Client-centric prevention cascade
W
ould otherwise acquire infection
over period (or at risk)
Figure 1.10
Simple framework highlighting steps in delivering prevention
Figure 1.11
A VMMC cascade used to monitor gaps in the delivery of individual prevention
services, Zimbabwe
100%
80%
60%
40%
20%
0%
TARGET POPULATION
who would benefit from the prevention method
access (supply)
attach TARGET
Those who CAN ACCESS prevention method
effective use
attach TARGET
Those who DO EFFECTIVELY USE prevention method
motivation (demand)
attach TARGET
Those who WANT to use prevention method
Target MCs done Follow ups Adverse events (AE)
250 000
150 000 200 000
100 000
0 50 000
218 883
143 389 | 65.5%
10%
128 838 | 90%
341 | 0,24%
1.2.2.4 PMTCT cascades
The prevention of mother to child transmission cascades have both treatment (of mothers) and prevention (in infants) as their goals. The first stage should be assessed with the core health-sector care cascade, using the following indicators:
1. Number of pregnant women living with HIV. 2. Number and proportion of HIV-infected pregnant
women attending at least 1 antenatal care visit. 3. Number and proportion of HIV-infected pregnant
women receiving ART.
4. Number of live infants born to HIV-infected women.
The PMTCT cascade shows the importance of addressing links to prevention as part of the core care cascade, and of ensuring necessary disaggregations. It also shows the need for additional cascade indicators to link services to outcomes for specific prevention components, as described in detail in Chapter 4. Kenya has used the first four indicators of the PMTCT cascade with routine data at county level to identify women missing from PMTCT programmes, to provide differentiated support to sub-counties in need, and to rapidly close programme gaps. In this case, the use of cascade data was a major intervention in itself in closing the initial PMTCT gaps and linking missing women to the programme.
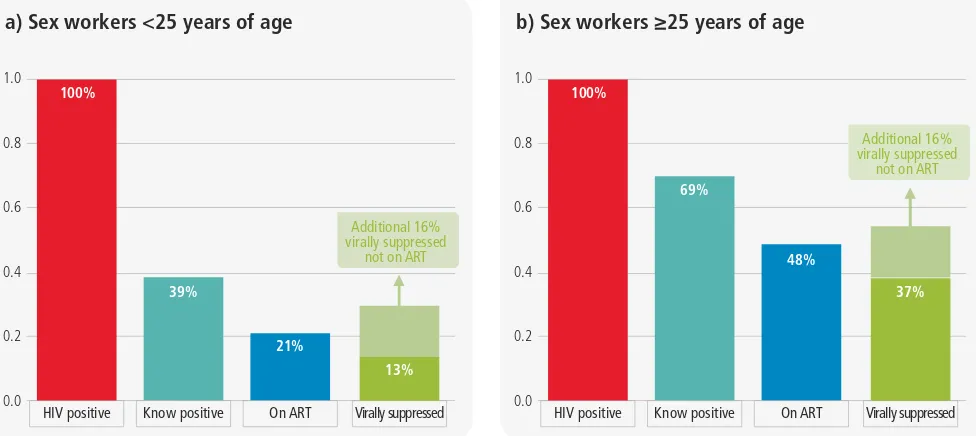
1.2.3 Cascades for key populations
Treatment and prevention cascades should be differentiated and disaggregated. Disaggregation can be done geographically from subnational units down to facility levels. Cascades can also be disaggregated by KPs so that individual cascades can be constructed separately for each defined population. These cascades can be national, subnational or facility-based and are described in detail in Chapter 3.
The cascade data use manual puts an important priority on KP cascades because there are often important gaps in access and services in such populations (Figures 1.12 and 1.13). Cascades can be developed using programme data (e.g. subnationally for implementing programmes), as well as linked to and as part of the national programme). Some programmes use referral slips to ensure that links between outreach and clinical services can be monitored, while data are kept separately for reasons of data security and confidentiality. KP cascades present challenges, but the data are important for promoting access for these populations. In addition, the retention and adherence of mothers to treatment
for the years after birth are key measures for follow-up and disaggregation in the core cascade data. The following indicators also focus on infants, ensuring that a cascade of services are delivered to achieve health outcomes:
1. Number and proportion of HIV-exposed infants receiving antiretroviral prophylaxis.
2. Number and proportion of HIV-exposed infants evaluated for HIV infection using an HIV DNA test by 2 months of age.
3. Number and proportion of HIV-exposed infants who test negative by 2 months of age.
4. Number and proportion of HIV-exposed infants tested for HIV after breastfeeding cessation.
5. Number and proportion of HIV-exposed infants who test HIV-negative after breastfeeding cessation.
Figure 1.12a
Cascade analysis among
commercial sex workers <25 years of age,
Zimbabwe
Figure 1.12b
Cascade analysis among
commercial sex workers
*
25 years of age,
Zimbabwe
a) Sex workers <25 years of age
HIV positive Know positive On ART Virally suppressed 100%
b) Sex workers ≥25 years of age
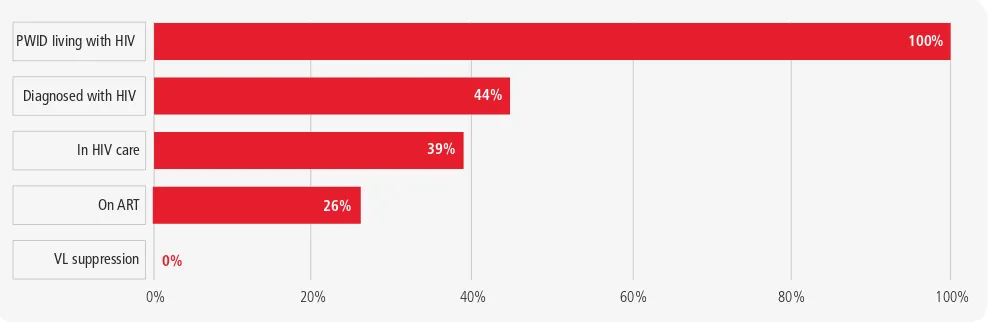
Figure 1.13
Cascade analysis to monitor access to HIV services among people who inject
drugs, Ukraine
1.2.4 Cascades for care and treatment of HIV co-morbidities
Cascade analyses can be used to track populations with co-infections. First, cascade analysis is an opportunity to provide standard analyses and dashboards (e.g. in district health information systems) for several conditions.
For tuberculosis (TB), there are three routine indicators that can be used to identify cascade gaps and two additional indicators (A) where additional data from patient records or surveys are available, namely:
1. Estimated incident TB cases (new and relapse), data provided by WHO
A. New and relapse TB patients detected
2.TB patients notified (new and relapse), reported routinely by countries
A. New and relapse TB patients started on treatment 3.TB patients treated successfully (new and relapse),
reported routinely.
Similarly for HBV and HCV, there are standard cascade indicators that should be assessed to identify programme gaps, namely:
1. People infected with HBV and in a separate cascade with HCV
2. Diagnosis – the number of people who are diagnosed and the proportion of infected persons
3. Treatment – the number of people started on treatment, usually lifelong treatment for HBV or short-term curative treatment for HCV
4. Treatment outcomes – for HBV the number of people on treatment who have viral suppression; for HCV the number of people completing treatment who are cured.
These basic cascades should be addressed, where possible, in country cascade analysis and in building in standard dashboards into district health information systems.
Chapter 5 describes cascades for HIV-HBV, HIV-HCV and HIV-TB co-infection. Unlike care and treatment cascades for HIV, these cascades are usually only longitudinal. In these cascades, there is a screening indicator that precedes the cascade and defines the co-infected population; this indicator is not part of the cascade. For instance, all HIV-infected patients should be screened for TB, and all patients with active TB should be screened for HIV. Those that are diagnosed with co-infection with both HIV and TB become the base population that is then followed through the cascade (Figure 1.14). 20%
0% 40% 60% 80% 100%
VL suppression PWID living with HIV
Diagnosed with HIV
In HIV care
On ART
100%
44%
39%
26%
Figure 1.14
Cascade for HCV by WHO region, highlighting the gaps that need filling in HIV
co-morbidities by 2020 and 2030
1.3
Cross-sectional and longitudinal
cascade analysis
The two general types of cascade analyses are cross-sectional cascades and longitudinal cascades (Box 1.4).
Cascade analyses can be performed using data that reflect indicators at a specific point in time. This type of cascade is the most common and is referred to as a “cross-sectional HIV cascade”.
Where there are strong individual-level reporting systems, including case reporting, HIV cascades can also be developed using data that follow persons along the indicators over time. This type of
cascade is called a “longitudinal cascade” or a “cohort cascade”. Longitudinal cascades reflect the outcomes from individuals during a specific time frame, with a specified beginning and a specified end. For example, a longitudinal cascade could include persons newly diagnosed with HIV in 2014 and results reported after 12 or 24 months of follow-up.
Cross-sectional cascades are generally the more useful for national programmes because they provide national estimates of the 90-90-90 targets (Figure 1.15). They are also normally easier to construct and use in a standard way at national, district and facility levels. Countries should prioritize construction of national and subnational cross-sectional cascades.
Figure 1.15
Cascades are used as a part of funding proposals for PEPFAR and the Global
Fund in Malawi, Zambia and Zimbabwe
Gap 70%Gap 73%
Number of persons (in thousands)
Cascade of care
Infected Diagnosed Started on treatment
in 2015 Cured in 2015
African Region
Diagnosed On ART Virally suppressed
Achievement Towards 90/90/90 - Results from Population HIV Impact Assessment (PHIA) 2016 Malawi, Zambia and Zimbabwe
Cross-sectional cascades typically use data from multiple sources that do not account for in- and out-migration in the population but use readily accessible data and are simple to construct and interpret (Figure 1.16).
Most national longitudinal cascades use data from robust case surveillance systems that continuously un-duplicate and update individual records. Such systems do not exist widely in high-burden resource-constrained areas. Furthermore, cascade analysis using longitudinal data can be more complicated than analyses used in cross-sectional analysis.
Box 1.4
Cascade definitions
Cross-sectional cascade: A cascade that measure indicators at a specific point in time. All living persons with a specific trait (HIV infection, risk of HIV infection, HIV co-infection) are included regardless of whether they are currently in care or not.
Longitudinal cascade: A cascade that records data at multiple points in time. In longitudinal cascades, individuals are in cohorts
and are followed until they reach a specified endpoint (e.g. viral suppression). This is also called a cohort cascade.
Denominator-denominator cascade: A cascade in which data are linked at the individual patient level across stages. For instance, in a cohort of patients with HIV-HCV co-infection, an individual patient is followed through each stage of the cascade.
Denominator-numerator cascade: A cascade in which data are linked at the individual patient level within each stage – for instance, the proportion of patients known to be on ART that have achieved viral suppression.
Single-source cascade: A cascade from which all data come from a single source – for instance, a cohort of patients with diagnosed HIV infection.
Multiple-source cascade: A cascade from which data come from multiple sources – for instance, in a prevention cascade when the numerator comes from the number of voluntary male medical circumcisions that have been performed and the denominator comes from a behavioural survey that estimates the number of 15-24-year-old men with multiple sexual partners.
Prevalence-based HIV continuum: A cascade that includes the number of living persons, whether diagnosed or not, at each step of
the cascade as a proportion of the total number with the condition (5). This is equivalent to a cross-sectional cascade.
Diagnosis-based HIV continuum: A cascade that includes the number of living persons who are diagnosed with the condition (e.g.
HIV, co-infection, elevated risk) as the denominator at each step of the cascade (5). This is the equivalent of a longitudinal cascade.
Adapted from Haber N, Dillay D, Porter K, Bärninghausen T. Constructing the cascade of HIV care: methods for measurement. Curr Opin HIV AIDS. 2016;11:102-8.
In contrast to cross-sectional cascades, longitudinal cascades begin with the number of persons who have been diagnosed with HIV and follow these same people over time to see how many eventually access care and go on to become virally suppressed (Figure 1.17). For instance, in a longitudinal cascade the first indicator could be the number of persons newly diagnosed with HIV from 1 January 2015 through 31 December 2015. The second indicator would be the number and percentage of those persons who entered care within three months of diagnosis (or some other time frame of interest such as one month) among those who were newly diagnosed with HIV in 2015. Key to these assessments is the availability and quality of the data. Given that many nationally available data are imperfect, it is important to understand and
Figure 1.16
Cross-sectional national cascade, Kenya AIDS Indicator Survey, 2012*
The selection of the denominator or denominators used in the cascade analysis depends on the indicators of interest. At global level, the preferred approach to constructing a cascade is to use
a single denominator. This type of cascade is sometimes called a denominator-denominator cascade.
Figure 1.17
Longitudinal care cascade, La Romana, Dominican Republic, 2011
This manual provides guidance on how to calculate core indicators for cross-sectional and longitudinal care cascades using a denominator-denominator approach. For each of these cascades, the indicators and the potential data sources for the denominator and numerators are presented. The manual also provides guidance on how to approach situations in which specific data are
unavailable by using supplemental (i.e. not core) indicators.
The guidance is practical in order to support data use, often with imperfect data, and to identify programme gaps and linkages. The data should be used to improve programmes and the quality of data continually. Cascade data use is an important step to improving both the quality of programmes and the quality and practical use of data.
PLHIV Diagnosed In care On ART Virolagically suppressed
Source: Kenya AIDS Indicator Survey, 2012: Final Report. Nairobi: NaƟonal AIDS and STI Control Programme (NASCOP);2014
ΎdŚĞĞƐƟŵĂƚĞĨŽƌW>,/sĐŽŵĞƐĨƌŽŵƚŚĞ^ƉĞĐƚƌƵŵ/^/ŶĚŝĐĂƚŽƌDŽĚĞů͘ 0
200 000 400 000 600 000 800 000 1 000 000 1 200 000
1 147 000
584 970
527 620
389 980
309 690 51%
46%
34%
27%
Adapted from: Ref. (6).
0 10% 50%
40%
30%
20% 60% 70% 80% 90% 100%
On ART 36%
Virologically suppressed at 12 months
4% In care within
3 months 65%
2. HIV CARE AND TREATMENT CASCADES
Countries should prioritize cross-sectional cascade analysis at national and subnational levels and for KP. This provides an overall view of programme gaps. Where there are strong individual-level reporting systems, including case reporting, these can be supplemented by analysis of individual-level, longitudinal cascades.
Cross-sectional cascades measure related indicators at a specific point in time. Typically, the number in the left-hand column (e.g. PLHIV) is
estimated, and multiple sources are used to calculate the various steps in the cascade. All living persons with a specific trait (HIV infection, risk of HIV infection, HIV co-infection) are included regardless of whether they are currently in care or not.
Cross-sectional cascades typically include four steps and indicators, although frequently a fifth (the number of PLHIV that are in HIV care) is added. These indicators are shown in Box 2.1.
Box 2.1
Cross-sectional cascade indicators
• Estimated number of PLHIV as of a specified date (typically the end of the most recent year for which data are available, which should be disaggregated geographically, by sex, age and KP).
• Number and percentage of the number of PLHIV who are aware of their status (also referred to as PLHIV who have been diagnosed with HIV).
• Number and percentage of the number of PLHIV who are receiving HIV care (including ART).5
• Number and percentage of the number of PLHIV who are on ART.
• Number and percentage of the number of PLHIV who are virologically suppressed (<1000 copies/mL).
5 This is an optional cascade indicator.
Cross-sectional cascades are typically constructed using data from multiple sources, such as modelled estimates of the number of PLHIV from the Spectrum AIDS Indicator Model (1) and clinical registry data for the number of PLHIV in care, on ART and virologically supressed. Additionally, data that were collected at
different times will often be needed to construct the cascade. For these reasons, it is important to document the source and year of the data that contribute to each column in the cascade. For all analyses, the most recent and most robust data should be used.
2.1
Core indicators and data sources
Indicator 1. Number of PLHIV (typically the estimated number of PLHIV)
HIV estimation models such as the Spectrum AIDS Indicator Model (1), population-based surveys of the general population or size estimation exercises from surveys of KPs can be used to determine the first indicator. Uncertainty ranges around the estimate should be included if available. Estimates from the UNAIDS-supported Spectrum modelling tool are the preferred data source for this indicator. If estimates of the number of PLHIV are derived from a data source other than Spectrum, the methods and the uncertainty of the corresponding estimates should be described.
This first indicator is typically presented as a number and represents 100%. This number serves as the denominator for all subsequent indicators.
Indicator 2. Number and percentage of PLHIV who are aware of their HIV status
Case-based surveillance data. In countries with well-functioning, mature HIV reporting systems (see criteria below), the number of persons reported to the national case-based surveillance system, minus the number of deaths, can serve as a proxy for the number of PLHIV who are aware of their HIV status. This assumes that, with rapid HIV testing, nearly all people who are diagnosed with HIV learn their status, and with a well-functioning mature HIV reporting system, all people diagnosed are subsequently reported.
In addition to allowing for reporting delays, countries should conduct an evaluation of the quality, completeness and timeliness of reporting no more than 2 years prior to cascade analysis. The case-based reporting system should meet high performance standards (e.g. at least 85% complete and 65% of cases reported within 6 months of diagnosis, or other standards that are deemed sufficiently high).
It is also recommended that countries only use case-based surveillance to calculate the proportion of PLHIV who know their status if the surveillance system meets the following criteria:
• The system has been in operation for at least three years. More recent systems may not have fully captured people who were diagnosed earlier.
• Reports of people diagnosed with HIV who have subsequently died can be excluded from the indicator. • Incoming reports are matched against records in the
surveillance registry to distinguish new or existing information on a previously reported person from reports on persons not previously reported.
How the system meets these criteria should be documented as part of the evaluation.
Modelling. An alternative to using case-based surveillance is to model the proportion of PLHIV that are undiagnosed using the European Centre for Disease Control model, which uses CD4 counts at diagnosis as a way of estimating duration of infection and the probability that someone remains undiagnosed (2). As with any data presented in a cascade, its source should be cited. Population-based survey data. Population-based HIV serosurveys or integrated bio-behavioural surveys in KPs that both test participants for HIV infection and ask them if they have been diagnosed with HIV can be used as an estimate of the number of persons who are aware of their infection. It is important to note that these self-reported data may underestimate the proportion of persons who know that they are HIV-infected because some participants who know that they are infected may not disclose this information to the interviewer. Surveys that are limited to people who attend clinics or attend certain programmes, such as needle and syringe exchanges, will be very unlikely to be representative of the entire population and, as such, will suffer from selection bias. In surveys that ask the respondents directly whether they are HIV-infected, the numerator is the number of participants who state that they are HIV-infected and whose HIV test result from the survey confirms their infection. Participants who are found to be HIV-infected from testing in the survey but report never having been tested or report having been tested prior to the survey but who did not receive their test results are considered to be unaware of their infection and should not be included in the numerator. The denominator in these studies is the number of people who test positive regardless of whether they know their status or not. In many study designs this number may be weighted to adjust for sampling. Alternatively, some surveys do not ask participants to disclose their serostatus, but they do ask participants if they have been tested for HIV. In settings where indirect estimation of knowledge of status from survey data is required to construct this indicator, it is useful to refer to the global AIDS monitoring guidelines (3) for more detailed instruction.
In cascade analysis, preference is generally given to the most recent data to ensure reasonable indicator estimates. For this reason, it is recommended that surveys be no more than 3 years old for use in cascade analysis. When using older survey data, it is possible that the proportion of people who reported knowing their status at the time of the survey is now exceeded by the current proportion of people on treatment. Moreover, in general in population-based household surveys, the sample size is powered to provide robust prevalence estimates at the national and, at times, subnational levels. However, given rapid scale-up in many countries, older survey data may indeed underestimate the number of PLHIV who know their status.
Indicator 3. Number and percentage of PLHIV who are receiving HIV care (including ART)
In countries that have adopted and implemented treatment for all PLHIV, this indicator should eventually be the same as the number of PLHIV on ART. However, in some countries it may still be important to measure this indicator since not all PLHIV are eligible for ART. As such, this is an optional element. This indicator provides the opportunity to monitor persons in care who are not yet on ART and to determine how this varies across populations and time. When reporting this indicator, we recommend that national programmes note whether they have expanded the criteria for initiating ART to treat everyone or whether they are using a different recommendation.
There are three possible data sources for the numerator: 1) case-based surveillance, 2) programme data and 3) population-based surveys. Evidence of care includes documentation of clinical staging, a CD4 or viral load test, ART initiation or ART use. Selecting which of these data to use will depend on their completeness, quality and recency.
Case-based surveillance data. The considerations regarding use of data from case-based surveillance described for indicator 2 also apply to indicator 3. Obtaining the number of persons in care from a case-based surveillance database generally requires definitions that include some time frame restrictions. For example, if the cross-sectional cascade is measuring persons in care as of 31 December 2014, it would probably not make sense to include persons who were in care in 2010 but not in 2014. Therefore, when using case-based surveillance data, it is recommended that this indicator should refer to a specified time period. Case-based surveillance data should be used only if reporting of sentinel events is robust. If not, the value of this indicator will be underestimated.
Population-based survey data. The considerations regarding use of data from population-based surveys described for indicator 2 also apply to indicator 3. Population-based surveys that collect information on receipt of care usually include a time frame (e.g. receipt of care in the 12 months prior to the survey). For population-based surveys, the recency of the survey remains even more important.
Indicator 4. Number and percentage of PLHIV in care who are on ART
There are three possible data sources for the numerator: 1) case-based reporting, 2) programme data and 3) survey data that measure the number of PLHIV in care who are on ART directly. Additionally, population-based surveys may be able to estimate this through questions about self-reported access in the absence of direct testing for antiretrovirals (ARV).
Case-based surveillance data. The considerations regarding use of data from case-based surveillance described for indicators 2 and 3 also apply to indicator 4. In countries where persons on ART are routinely monitored using viral load testing, evidence of a viral load test can be used as a proxy for being on ART.
Programme data. Programme data that indicate ART initiation or a viral load test in situations where viral load testing is performed only on persons who are on ART should be used for the numerator. Clinical and pharmacy records may be useful data sources. It is important to take into account pharmacy protocols for patients on ART since in some settings some or all patients may receive medication refills at intervals greater than one month. These people should still be included as on ART. Note that use of pre- and post-exposure prophylaxis is not included in this indicator. Keep in mind that programme data obtained from aggregate data are likely to overestimate this indicator. Countries should document the national guidelines on criteria for ART and, for countries that require a clinical or immunological threshold for ART, documentation of the estimated number and proportion of ART-eligible persons who are on ART may be worth including.
Population-based survey data. Population-based surveys that collect information on ART usually include a time frame, and the question of ART use is asked only among persons who report being in care. While self-report of receiving ART is typically used for calculating this indicator, tests for the presence of antiretroviral agents may also be conducted in some surveys. Survey participants whose laboratory tests indicate HIV infection and the presence of ART should also be counted as receiving ART (as well as being included as knowing their status and being in care) even if these participants denied having HIV infection. As with indicators 3 and 4, timeliness of survey data is a major concern in the face of rapid expansion of ART programmes.
Indicator 5. Number and percentage of PLHIV who are virally suppressed (<1000 copies/mL)6
There are four possible data sources for the numerator: 1) case-based reporting, 2) programme data, 3) laboratory data and 4) population-based or drug-resistance surveys.
For the first three sources, countries should construct this indicator only in settings where viral load testing has been routinely available to all populations during the time period covered by the cascade. Episodic viral load testing (i.e. to identify possible treatment failure or to determine when to initiate treatment) will lead to substantial underestimation of viral suppression levels. In situations where patients are monitored using routine viral load measurements but only in sentinel or selected sites, the proportion suppressed at these sites may be used to represent national suppression proportions, but a detailed explanation of the source of the data should be noted. If a national indicator is to be extrapolated from limited sentinel surveillance, great care must be taken to ensure that the results found in participating clinics are representative of all ART clinics in the country.
Case-based surveillance data. Keeping in mind the same considerations regarding use of data from case-based surveillance described previously, the numerator is the number of persons on ART whose most recent viral load test result is <1000 copies/mL.
Programme data. Data may come from registers, medical records or other patient monitoring systems. The numerator is the number of persons whose most recent viral load test result is <1000 copies/mL.
Laboratory data. In some countries, viral load testing takes place at a selected number of specialized laboratories. If there is a national laboratory with unduplicated laboratory records, the numerator is the number of persons whose most recent HIV viral load test result is <1 000 copies/mL.
Population-based survey data or drug-resistance surveys. The numerator is the number of persons whose viral load test result is <1000 copies/mL. This can also be estimated from nationally representative surveys of PLHIV in care and on ART.
2.2
Examples of cross-sectional cascades
2.2.1. Cross-sectional HIV care and treatment cascade
from Kenya
The data used to construct the HIV care cascade for Kenya using data from 2015 are shown below (Table 2.1); the cascade is shown in Figure 2.1. Unlike the Kenyan cascade shown in Figure 1.16, which is derived from a national household-based survey, the cascade shown in Figure 2.1 is much more typical in that it uses multiple sources to construct the care and treatment cascade. Figure 2.1 uses Spectrum to estimate the number of PLHIV, programme data to count the number of PLHIV in care and on ART, and cross-sectional estimates from the Kenyan AIDS Indicator Survey (KAIS 2012) for the proportion of persons who have reached virological suppression.
The findings from this cascade analysis highlight a number of areas for improved epidemiological data and programme service delivery. First, it shows that there is no current national estimate of the number of people who have been diagnosed with HIV and who know their results. This is a data gap that can be filled by case-based surveillance, modelled estimates or data from cross-sectional surveys. Secondly, while the cascade shows that the proportions of PLHIV who were in care and on ART were similar, it also found that a low proportion of PLHIV are virally suppressed. The comparability of these data can be questioned, but basic policy implications may include the need have data on HIV testing available for analysis, to increase the uptake of ART, and to obtain better estimates of the proportion of persons on ART who have achieved viral suppression. Because this is a cross-sectional cascade, it is possible that insufficient follow-up time may be responsible to some degree for the low suppression rate.
Table 2.1
Cross-sectional national-level HIV care and treatment cascade, Kenya, 2015
Indicator Data source and year data obtained Absolute number Percentage
Estimated number of PLHIV Spectrum (2015) 1 630 939 100%
Aware/diagnosed None Not available Not available
In HIV care Programme registers (2015) 931 518 57%
On ART Programme registers (2015) 823 738 51%
Viral suppression Kenya AIDS Indicator Survey, 2012 428 628 26%
Source: Developed and presented at the WHO Global HIV Cascade Workshop: Measuring and Tracking People Along the HIV Health Sector Cascade, November 2015, Marrakech.
0% 20% 40% 60% 80% 100%
100%
PLHIV
57%
In HIV care
51%
On ART
26%
VL Suppression
2.2.2 Cross-sectional HIV care and treatment cascade,
Georgia
Georgia’s cross-sectional cascade was constructed in 2015 from multiple data sources (Figure 2.2) (5). The number of PLHIV was estimated from Spectrum; all other data came from the national
HIV information system. In 2015 an estimated 61% of PLHIV had been diagnosed, 38% were on ART and 32% were virologically suppressed. These results suggest gaps in diagnosis and treatment. Notably, of the 2685 patients who had begun ART, 2274 (85%) had achieved virological suppression.
Figure 2.2
Cross-sectional national-level HIV care and treatment cascade, Georgia, 2015
2.2.3 Estimated worldwide HIV care and treatment cascade,
2016
In its 2016 global report on HIV, WHO estimated a worldwide cascade from national-level data (Figure 2.3) (6). Of the 36.7 million people estimated to be living with HIV at the end of 2015,
22.2 million (60%) knew that they were infected, 17.0 million (46%) had begun ART and 13.8 million (38%) had suppressed viral replication. The largest gap was in diagnosis, with 40% of PLHIV unaware that they were infected. The other gaps were smaller: 23% of those diagnosed had not been started on ART, and 19% of those that had started ART had not achieved viral suppression.
Figure 2.3
Cross-sectional HIV care and treatment cascade, Worldwide, 2015*
Source: Ref. (5).
PLHIV Diagnosed On ART Virologically suppressed
0 1000 2000 3000 4000 5000 6000 7000 8000
62%
38%
32%
Met target Gap
Adapted from: Ref. (6).
Virologically suppressed On ART
Aware of HIV infection HIV infected
In millions*
36,7
22,2
17
13,8 10,9
12,7
13