Zenoss Core 3.x Network and
System Monitoring
A step-by-step guide to configuring, using, and adapting
this free Open Source network monitoring system
Michael Badger
Copyright © 2011 Packt Publishing
All rights reserved. No part of this book may be reproduced, stored in a retrieval system, or transmitted in any form or by any means, without the prior written permission of the publisher, except in the case of brief quotations embedded in critical articles or reviews.
Every effort has been made in the preparation of this book to ensure the accuracy of the information presented. However, the information contained in this book is sold without warranty, either express or implied. Neither the author, nor Packt Publishing, and its dealers and distributors will be held liable for any damages caused or alleged to be caused directly or indirectly by this book.
Packt Publishing has endeavored to provide trademark information about all of the companies and products mentioned in this book by the appropriate use of capitals. However, Packt Publishing cannot guarantee the accuracy of this information.
First published: April 2011
Production Reference: 1120411
Published by Packt Publishing Ltd. 32 Lincoln Road
Olton
Birmingham, B27 6PA, UK. ISBN 978-1-849511-58-2
www.packtpub.com
About the Author
Michael Badger is a freelance technical communicator with a knack for helping other people understand and use their computer software and technology. In addition to writing a previous book about Zenoss Core: ZenossCoreNetworkandSystem Monitoring, Badger authored Scratch1.4:Beginner'sGuide, a Scratch programming tutorial.
He lives in north central Pennsylvania (United States) on a small farm and has recently taken to raising pastured chickens, honeybees, and pigs. Michael is searching for a way to integrate Zenoss Core into the hen house so that he can receive an alert each time an egg is laid.
For more information, visit www.badgerfiles.com/zenoss3.
There are so many people to thank, starting with my family. They tolerate my late nights and weekend work.
My team at Packt deserves a nod for finally helping me get this revision done. Thanks for the help Rakesh Shejwal and Jovita Pinto.
Then there are the reviewers. It's not easy to provide substantive critique of another person's work because it takes time and
About the Reviewers
Andrea
Consadori
is the lead technical support at Lais s.r.l. and has been working with Zenoss to monitor customer IT infrastructures for the past four years.He has been implementing simple zenpacks to integrate all of the vendors' products he uses like Motorola Canopy/PTP, Alvarion, and so on.
Lais s.r.l. is a WISP and uses Zenoss to monitor its wireless infrastructure.
Earlier, he worked at Edslan s.p.a. (an Italian networking product distributor) where he studied lots of networking brands.
Andrea is passionate about solving hard networking issues and enjoys working with routing protocol and firewall rules.
I would like to thank Michela for her encouragement that makes my skill and knowledge grow every day.
Jonny
Gerold
loves Open Source, enjoys working with Linux/Unix/Solaris, and also enjoys dirt biking.www.PacktPub.com
Support files, eBooks, discount offers
and more
You might want to visit www.PacktPub.com for support files and downloads related to your book.
Did you know that Packt offers eBook versions of every book published, with PDF and ePub files available? You can upgrade to the eBook version at www.PacktPub. com and as a print book customer, you are entitled to a discount on the eBook copy. Get in touch with us at [email protected] for more details.
At www.PacktPub.com, you can also read a collection of free technical articles, sign up for a range of free newsletters and receive exclusive discounts and offers on Packt books and eBooks.
http://PacktLib.PacktPub.com
Do you need instant solutions to your IT questions? PacktLib is Packt's online digital book library. Here, you can access, read and search across Packt's entire library of books.
Why Subscribe?
• Fully searchable across every book published by Packt • Copy & paste, print and bookmark content
• On demand and accessible via web browser
Free Access for Packt account holders
Table of Contents
Preface
1
Chapter 1: Network and System Monitoring with Zenoss Core
7
Device management 9
Availability and performance monitors 10
Event management 11
Plugin architecture 12
System reports 13
Custom device reports 14
System architecture 14
User layer 15
Data layer 16
Collection layer 17
Device management daemons 18
Performance and availability daemons 18
Event daemons 19
Summary 20
Chapter 2: Discovering Devices
21
Zenoss Core installation 22
Preparing devices for monitoring 22
SNMP 23
SNMP versions 24
Configuring SNMP on Linux 25
Configuring SNMP and WMI on Windows 26
Zenoss Plugins 28
Installing Zenoss Plugins 29
Port scan 30
Opening monitoring-specific ports 30
Zenoss Core setup wizard 33
Step 1: Setting up users 33
Step 2: Specify or discover devices to monitor 34
Adding devices 35
Manually find devices 35
Autodiscover devices 37
Our device inventory: A job well done 38
Reviewing device creation job log 40
Adding a single device 42
Entering device attributes 43
Importing a list of devices with zenbatchload 46
Command line discovery with zendisc 48
Summary 49
Chapter 3: Device Setup and Administration
51
Organizing devices in Zenoss Core 52
Locations 52
Systems and Groups 54
Organizer details 54
Editing organizers 56
Moving organizers 56
Classes 56
Viewing a list of device classes 57
Assigning devices to a class 58
Modeling devices 59
Modeler plugins gather device information 60
Assigning modeler plugins 62
Troubleshooting data collection 62
Troubleshooting SNMP problems 62
Running snmpwalk 63
Is the SNMP daemon running on Linux servers? 64
SNMP problems on Windows 64
Troubleshooting WMI problems 64
Zeneventlog—unable to connect to Windows 65
Zenoss Core does not collect WMI data 65
Troubleshooting Zenoss Plugins 66
A class of its own 66
Device administration 67
Locking or unlocking a device 67
Renaming a device 68
Resetting the IP address 69
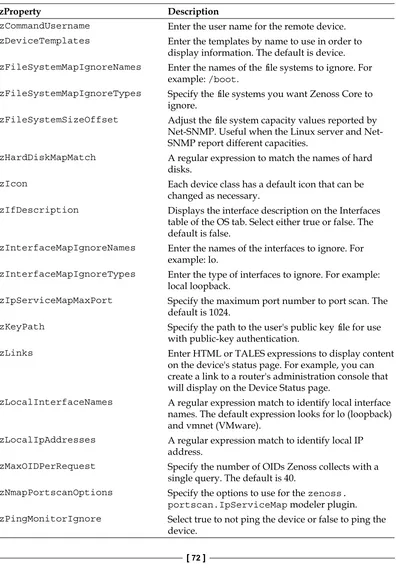
zProperties defined 71
Summary 74
Chapter 4: Monitor Status and Performance
75
Collectors collect 76
Configuring the performance collector 77
Monitoring components 79
Interfaces 80
OS Processes 81
Add Process 81
Viewing or editing the process details 82
Configuration properties 82
Monitoring OS Processes 83
Services 85
Enable monitoring for a service 85
Configuration properties 87
Monitoring exceptions for services 87
Interactively monitor IP services 88
File Systems 89
Ignoring File Systems with zProperties 89
Network Routes 90
Networks 91
Add Components 92
Viewing and editing component details for a device 93
Performance Graphs 94
Interface template 95
Performance Graphs 96
Working with graphs 97
Monitoring performance thresholds 98
Summary 98
Chapter 5: Custom Monitoring Templates
99
Monitoring Templates 99
Monitoring SNMP data sources 101
Overriding templates 101
Editing the /Server/Linux template 103
Find OIDs for SNMP monitoring 105
Monitoring with Nagios plugins 108
Working with Nagios plugins 111
Nagios return codes 111
Nagios performance data 111
Adding the Nagios plugin to Monitoring Templates 112
Adding a Data Source 114
Defining monitoring thresholds 118
Graph definitions 120
RRDtool Graph Point configurations 123
Binding templates to the device class 125
Adding a device to monitor using the Bogo template 126
Monitoring with Cacti plugins 127
Data Source parser 128
Summary 129
Chapter 6: Core Event Management
131
Event Console 132
Event severities defined 133
Event statuses defined 134
Acknowledging an event 134
Viewing an event log 135
Events consoles are everywhere 137
Closing events 137
Displaying historical events 138
Event Manager 138
Event Fields 141
Event commands 143
Creating a command 143
Working with events 145
Simulating an event 145
Clearing the event 147
Event mapping 148
Event Classes 148
Event class zProperties 149
Mapping an event 150
Event mapping sequence 154
Event de-duplication 154
Turning off event de-duplication 155
Summary 156
Chapter 7: Collecting Events
157
Routing syslog messages to Zenoss Core 157
Collecting Cisco router syslogs 159
Testing syslog configuration with Logger 160
Monitoring Windows event logs 161
Windows event log severities 162
Incorporating event reporting into third-party scripts
via zensendevent 163
Simple backup script with zensendevent 165
Creating events by e-mail 166
Zenmail 167
Zenpop3 169
Configuring alerting rules 170
Alert filters 172
Alert escalations 173
Schedule 174
Alert messages 176
Event transformations 177
Some event transformation examples 178
Programming in zendmd, an interactive shell 180
Summary 182
Chapter 8: Settings and Administration
183
Managing Zenoss Core users 183
Administered Objects 185
Event Views 187
Groups 189
Creating custom User Commands 189
Adding a User Command 192
System settings 193
Configuring Zenoss Core's Monitoring Dashboard 194
Locations portlet with Google Maps 196
Device Issues portlet 197
Zenoss Issues portlet 198
Watch List portlet 198
Root Organizers portlet 199
Production States portlet 199
Portlet permissions 200
Meet the Zenoss Daemons 200
Maintenance Windows 202
Adding MIBs 204
Backing up and restoring monitoring data 205
Automating backups with zenbackup 206
Restoring backups with zenrestore 207
Updating Zenoss Core 208
Chapter 9: Extending Zenoss Core with ZenPacks
211
Installing community ZenPacks 211
Monitoring websites with HttpMonitor 212
Viewing a list of installed ZenPack objects 215
Configuring HttpMonitor 216
Configuring HttpMonitor settings 217
Creating a ZenPack 218
Adding files and objects to the ZenPack 221
Adding a new data source to the monitoring template 222
Adding objects to a ZenPack 223
Packaging the ZenPack 224
ZenPack development mode 225
Developer resources 226
Summary 226
Chapter 10: Reviewing Built-in Reports
227
Report overview 227
Device Reports 228
New Devices 229
Device Changes 229
Model Collection Age 229
Software Inventory 230
Manufacturers and Products 230
SNMP Status Issues 231
Ping Status Issues 232
All Devices 232
All Monitored Components 232
Event Reports 233
All Event Classes 233
All Event Mappings 234
All Heartbeats 234
Graph Reports 234
Multi-Graph Reports 237
Adding Collections 238
Adding Graph Definitions 240
Adding Graph Groups 241
Performance Reports 243
Aggregate Report 244
Availability 245
Memory Utilization 248
Threshold Summary 248
User Reports 249
Notification Schedules 249
Summary 249
Chapter 11: Writing Custom Device Reports
251
Creating Custom Device Reports 251
Custom Device Report fields 253
Building Custom Device Report queries 254
Using zendmd to test report queries 255
Exploring data in Zope 258
Using Python expressions in the columns 260
Convenience functions 261
convToUnits 261
Scheduling reports for e-mail delivery 262
Sending a CSV report 263
Scheduling a cron job 263
Summary 263
Appendix A: Event Attributes
265
Appendix B: Device Attributes
269
Appendix C: Example snmpd.conf
273
Preface
For system administrators, network engineers, and security analysts, it is essential to keep a track of network traffic.
Zenoss Core is an enterprise-level systems and network monitoring solution that can be as complex as you need it to be. While just about anyone can install it, turn it on, and monitor "something", Zenoss Core has a complicated interface packed with features. The interface has been drastically improved over version 2, but it's still not the type of software you can use intuitively—in other words, a bit of guidance is in order.
The role of this book is to serve as your Zenoss Core tour guide and save you hours, days, maybe weeks of time.
This book will show you how to work with Zenoss and effectively adapt Zenoss for System and Network monitoring. Starting with the Zenoss basics, it requires no existing knowledge of systems management, and whether or not you can recite MIB trees and OIDs from memory is irrelevant. Advanced users will be able to identify ways in which they can customize the system to do more, while less advanced users will appreciate the ease of use Zenoss provides. The book contains step-by-step examples to demonstrate Zenoss Core's capabilities. The best approach to using this book is to sit down with Zenoss and apply the examples found in these pages to your system.
In Zenoss Core, ZenPacks are modules that add monitoring functionality. Using the Nagios plugin example, you will learn how to create, package, and distribute a ZenPack. You also learn how to explore Zenoss Core's data model using zendmd so that you can more effectively write event transformations and custom device reports. Implement Zenoss Core and fit it into your security management environment using this easy-to-understand tutorial guide.
What this book covers
Chapter1, Network and System Monitoring with Zenoss Core, provides an overview of Zenoss Core's monitoring capabilities and system architecture.
In Chapter 2, Discovering Devices, we prepare our monitoring environment by configuring SNMP, WMI, SSH, and firewall ports. We'll add devices to Zenoss Core via the setup wizard, zenbatchload, and zendisc.
Chapter3, Device Setup and Administration, configures devices so that we ensure we collect the proper monitoring information by organizing, configuring, and troubleshooting the monitoring properties.
Chapter4, Monitor Status and Performance, monitors and graphs the performance of device components such as routes, windows services, IP services, processes, file systems, and network interfaces.
Chapter5, Custom Monitoring Templates, explores custom monitoring templates by configuring various data sources, including SNMP, Nagios plugins, and Cacti plugins.
Chapter6, Core Event Management, introduces us to processing events via the Event Console. We create custom event commands, learn how to create test events, and perform event mapping.
Chapter 7, Collecting Events, allows Zenoss Core to receive and process events from third-party sources, such as syslog, Windows Event Log, e-mail, and home-grown system administration scripts.
Chapter 10, Reviewing Built-in Reports, reviews each of Zenoss Core's included reports to help us troubleshoot, analyze, and view our monitoring performance over time. It also creates custom graph and multi-graph reports.
Chapter 11, Writing Custom Device Reports, provides an in-depth look at Zenoss Core's custom device report functionality, including the use of zendmd to explore the Zenoss data model.
AppendixA, EventAttributes, lists the available event attributes in Zenoss Core. AppendixB, DeviceAttribute, lists the attributes that we may use when working with our devices.
AppendixC, Examplesnmpd.conf, lists a sample snmpd.conf file.
What you need for this book
This book will work best if you have a working installation of Zenoss Core and some network servers, routers, switches, and other devices to monitor. Zenoss Core can be installed on Linux, Mac OS X, and Windows (via a virtual Zenoss Virtual Appliance and VMware).
Who this book is for
This book is written primarily for network and systems administrators who are monitoring their IT assets with Zenoss Core or who plan to monitor them. In reality, this book will benefit anyone, regardless of job title, who recognizes the importance of proactively monitoring the servers, routers, computers, websites, and devices that connect companies to customers.
Conventions
In this book, you will find a number of styles of text that distinguish between different kinds of information. Here are some examples of these styles, and an explanation of their meaning.
Code words in text are shown as follows: "Before you make any changes, back up the snmpd.conf file".
A block of code is set as follows:
Any command-line input or output is written as follows:
python setup.py build python setup.py install
New terms and important words are shown in bold. Words that you see on the screen, in menus or dialog boxes for example, appear in the text like this: "Select Simple Network Management Protocol and WMI".
Warnings or important notes appear in a box like this.
Tips and tricks appear like this.
Reader feedback
Feedback from our readers is always welcome. Let us know what you think about this book—what you liked or may have disliked. Reader feedback is important for us to develop titles that you really get the most out of.
To send us general feedback, simply send an e-mail to [email protected], and mention the book title via the subject of your message.
If there is a book that you need and would like to see us publish, please send us a note in the SUGGEST A TITLE form on www.packtpub.com or e-mail suggest@ packtpub.com.
If there is a topic that you have expertise in and you are interested in either writing or contributing to a book, see our author guide on www.packtpub.com/authors.
Customer support
Downloading the example code
You can download the example code files for all Packt books you have purchased from your account at http://www.PacktPub.com. If you purchased this book elsewhere, you can visit http://www.PacktPub.com/support and register to have the files e-mailed directly to you.
Errata
Although we have taken every care to ensure the accuracy of our content, mistakes do happen. If you find a mistake in one of our books—maybe a mistake in the text or the code—we would be grateful if you would report this to us. By doing so, you can save other readers from frustration and help us improve subsequent versions of this book. If you find any errata, please report them by visiting http://www.packtpub. com/support, selecting your book, clicking on the errata submission form link, and entering the details of your errata. Once your errata are verified, your submission will be accepted and the errata will be uploaded on our website, or added to any list of existing errata, under the Errata section of that title. Any existing errata can be viewed by selecting your title from http://www.packtpub.com/support.
Piracy
Piracy of copyright material on the Internet is an ongoing problem across all media. At Packt, we take the protection of our copyright and licenses very seriously. If you come across any illegal copies of our works, in any form, on the Internet, please provide us with the location address or website name immediately so that we can pursue a remedy.
Please contact us at [email protected] with a link to the suspected pirated material.
We appreciate your help in protecting our authors, and our ability to bring you valuable content.
Questions
Network and System
Monitoring with Zenoss Core
Whether it's internal or public-facing technology, businesses of all sizes depend on the availability of their IT assets, which may include servers, routers, networks, switches, and websites. If you're picking up this book, then you already know the value of monitoring and more than likely have an installation of Zenoss
Core running.
Zenoss Core is an open source network and system monitoring platform that is sponsored by Zenoss, Inc. Zenoss, Inc, develops two versions of Zenoss: Core and Enterprise. Core belongs to the community and is supported by the community. Enterprises adds some value-added features on top of the Core version, such as an extended report library, synthetic web transactions, certified monitors (ZenPacks), and a global dashboard for multiple Zenoss installations. The additional features allow Zenoss Inc., to sell the enterprise version as a commercial software product with support. As open source consumers, we're familiar with this business model. Our focus in the book is on Zenoss Core, but the concepts will also apply to Zenoss Enterprise.
The role of this book is to serve as your Zenoss Core tour guide and save you hours, days, maybe weeks of time. It's designed to quickly acquaint you with the core features so you can customize Zenoss Core to your needs. It's loaded with screenshots and provides a handy reference guide. Zenoss Core provides a monitoring solution that incorporates the following:
• Device management • Availability monitoring • Performance graphs • Event management
• User and alert management • Plugin architecture
• Monitoring reports
To monitor your IT assets (servers, routers, switches, websites, and anything else attached to your network), you install Zenoss Core to a server. Even though Zenoss Core is intended to be installed on a Linux server, virtual appliances are available that allow Macintosh and Windows users to install a working version of Zenoss Core by using VMware.
The web portal is the face of the Zenoss Core system and is the place where we spend most of our time. It provides a single access point to the monitoring system and requires no operating-system-specific knowledge to use. The web interface features drag-and-drop dashboard portlets that display a customized view of the network's health at any given time.
Device management
At the heart of the device management capabilities, Zenoss Core uses a configuration management database (CMDB), which stores a model of the IT environment and its change history. Zenoss Core supports adding IT assets (I'll switch out of "executive-speak" and just refer to the "IT assets" as devices from this point on) to the CMDB one at a time or by auto-discovering active devices by walking the routing tables. Devices are then modeled via Simple Network Management Protocol (SNMP), SSH (or Telnet), or port scans.
Availability and performance monitors
By using ICMP and SNMP monitoring, Zenoss Core reports on the availability of the following:• Network devices
• TCP/IP services and ports • URL availability
• Windows services and processes • Linux/UNIX processes
Zenoss Core is Level-3 network topology aware, which reduces the amount of alert chatter by creating an event about the problem device only and not about the devices that depend on it.
Performance monitors collect time series data and provide us with a graphical analysis of the following components:
• File system statistics • CPU and memory usage
• JMX monitoring for J2EE servers (available via a ZenPack) • Nagios and Cacti plugin support
Using the built-in event management system, we can configure Zenoss Core to generate an event if a monitored device crosses a defined threshold.
Event management
Zenoss Core monitors a variety of sources for signs of trouble, including syslogs, availability and performance monitors, SNMP traps, Windows event logs, and custom scripts. Core features of the event management system include:
• Custom events
• Automatic event prioritization • Event deduplication
The following screenshot shows the Event Console:
The event system mitigates duplicate events and auto-clears events when the status of the event changes from down to up. Zenoss Core can also collect events from custom scripts and external applications.
In response to events, Zenoss Core can send e-mail or pager alerts, run a script, or do nothing. We configure how Zenoss Core responds to an event by defining alerting rules. Alerting rules are defined on a per user or user-group basis.
Plugin architecture
Zenoss Core provides several ways for us to extend the base functionality: • ZenPacks: Zenoss Core's add-on modules
The information presented there will be valuable for those of you who want to develop your own plugins.
The ZenPack architecture allows us to package plugins and configurations for distribution to other users and the community at-large. Chapter9, ExtendingZenoss CorewithZenPacks walks you through the steps of installing a community ZenPack, and how to create your own ZenPack as well.
System reports
Zenoss Core packages a set of standard reports that allow us to view what is
happening right now, as well as what has happened in the past. The reports integrate with the device management, performance monitors, events, and user functionalities. The following screenshot shows the All Monitored Components report:
Custom device reports
The canned reports are nice, but sometimes we need to access and analyze data that the included reports do not cover. Zenoss Core enables users to write custom device reports from the web interface, as seen in the following screenshot:
We step through the creation of custom device reports in Chapter11, WritingCustom DeviceReports.
System architecture
Zenoss Core builds upon several open-source software projects to create a robust network and systems management solution. The most notable open-source software components that integrate with Zenoss Core include Zope, Python, MySQL,
RRDtool, and Twisted.
When we talk about the system architecture, it helps to conceptually segregate Zenoss Core into three layers:
• User • Data • Collection
User layer
Zenoss Core is flexible enough to work from a command line, but most of our work will take place via a web interface, which is based on the Zope application server framework.
Zope is a popular, extensible application server written in Python. It features a built-in web server, transactional object database, and HTML templates. Python is the basis for Zope; it's also the basis for Zenoss Core.
Through the web interface, we provide input with both the data and collection layers to accomplish tasks related to the following areas:
• Navigation and organization • Device management
• Availability and performance monitors • System reports
• Event management
Data layer
As we might expect, databases are the heart of the data layer, and Zenoss Core stores data in three types of databases. The Collection layer funnels device information to ZenHub, which in turns stores the data in the appropriate place, as seen in the following illustration.
Events are stored in a MySQL database. Zenoss Core generates Events when an established threshold is crossed, such as a server outage or high memory usage. Events trigger actions, such as e-mail or pager alerts.
Collection layer
The collection layer includes several daemons that gather information about devices, performance, and Events. They feed information to ZenHub to distribute to the appropriate database. The Zenoss Core daemons are easy to identify—they all start with the prefix "zen".
If we browse the file system, we will find each daemon in $ZENHOME/bin. $ZENHOME is an environment variable, which allows us to talk about the Zenoss installation directory without knowing exactly where it is. For example, I may install to /usr/ local/zenoss/zenoss while you install to /home/zenoss.
Twisted is an integral network communication protocol for the daemons. The Twisted Core README file describes Twisted as an "event-based framework for Internet applications"
Device management daemons
Finding the devices on our networks is a prerequisite to managing them, and Zenoss Core not only finds the devices, it models them. Device modeling builds a detailed overview of the network by recording the following types of information: system dependencies, available services, and change history.
The following table describes the daemons responsible for discovering and modeling devices:
Device daemon Description
zenmodeler Queries the devices via SSH/Telnet, SNMP, and port scans when we model the device. Each time zenmodeler runs on a device, it compares its findings with existing configuration and updates it as necessary.
zendisc Runs each time a request is made to discover a network or device. Zenoss uses SNMP as a primary collection protocol. However, it can also collect information via ICMP pings, port scans, and plugins.
The following daemons play an important role in collecting performance and availability data:
Performance daemon Description
zenperfsnmp Stores the collected performance data in RRD files so that RRDtool can graph device performance over hourly, daily, weekly,
monthly, or yearly durations.
zencommand Provides a way to run custom scripts and third party plugins including Nagios and Cacti plugins from within Zenoss. zenprocess Monitors the processes on Linux, Unix, and Windows systems. zenping Pings a device and reports an up or down status to determine if a
device is active or not.
zenstatus Tests the TCP ports and reports an up or down service.
Event daemons
When a device goes down or a service crosses a predetermined threshold,
such as available disk space, Zenoss Core generates an event. Events can generate a notification alert or run a custom command (to automatically take remedial action to fix the event, for example).
Not only can Zenoss Core generate its own events, but it can collect events from external sources (for example, custom system administration scripts) and convert the information to a "Zenoss-style" event.
The following table outlines the Zenoss Core event daemons:
Event daemon Description
zensyslog Creates events from syslog messages. zeneventlog Creates events from Windows event logs.
Summary
Discovering Devices
I assume that many of you already have a working Zenoss Core installation with devices in your inventory; however, adding devices is the easy part. Before we jump to monitoring, we need to think about how we will monitor. For example, we can use Simple Network Management Protocol (SNMP), Windows Management Instrumentation (WMI), or command-line plugins that run over SSH/Telnet. Each of your monitored devices may have different requirements. We'll review each of the monitoring protocols to help you decide how to monitor your devices with Zenoss Core.
Because our Zenoss Core server needs to communicate with our monitored devices, we will need to configure those devices to allow connections on various TCP and UDP ports.
The order in which you perform the items in this chapter is not important. If you are starting a new installation, then it makes sense to prepare your devices to be monitored before you add them to your inventory. If you've already added devices to your inventory, then you will still need to do these tasks in order to monitor them. Here's what we'll do in this chapter:
• Prepare devices for monitoring via SNMP, WMI, or SSH • Open ports for monitoring
• Run the Zenoss Core setup wizard • Import devices with zenbatchload • Discover devices with zendisc
Zenoss Core installation
Zenoss, Inc., makes several installation packages of Zenoss Core available to meet the needs of its community. For a list of current installation packages, visit www. zenoss.com/download. You'll find native packages, stack installers, and source files for several operating systems: Red Hat Enterprise Linux, Centos, Ubuntu, Fedora Core, OS X, OpenSuse, and Debian. The stack installers and native packages include all Zenoss Core dependencies.
If you need a no fuss installation to use as a sandbox or to follow along with the book, then I recommend loading one of the Zenoss Core VMware appliances for Windows, Linux, or OS X. To run the appliance, download the VMware Player or VMware Server for free from www.vmware.com.
Preparing devices for monitoring
One of the first questions we need to answer is, "How will I collect information from my devices and services?" Zenoss Core supports the following ways to model (collect data from) the device:
• Simple Network Management Protocol (SNMP) • Windows Management Instrumentation (WMI) • SSH/Telnet (for example, Zenoss Plugins) • Port scan
SNMP gives us the most flexibility and the best device support. WMI lets us access information about services running on Windows servers and can co-exist with SNMP. If we want to monitor Windows event logs, then WMI is a must. Even if your device supports SNMP, there may be times when you are unable to use it. For example, you're monitoring a remote device that's outside the local network. Zenoss, Inc., distributes a suite of command-line monitors that can be installed on a device via the Zenoss Plugins, and Zenoss Core runs the plugins over an SSH or Telnet session to collect the performance data.
SNMP
Zenoss Core uses SNMP to model the specific characteristics about a device, such as file system utilization, memory usage, or throughput on a network interface. The network devices report data to Zenoss Core via an SNMP agent that runs on each device. The agent on the device communicates with Zenoss Core—the SNMP network management station.
When Zenoss Core requests information from a device using SNMP, it asks the device to send information for a specific characteristic by including an Object Identifier (OID) in the request. For example, the OID 1.3.6.1.2.1.25.1.1.0 contains the system uptime value.
The following screenshot shows a sample transaction between Zenoss Core and a Linux server. Zenoss Core requests the value for an OID and the server responds with the value:
OIDs are collected in modules, called Management Information Bases (MIBs). Zenoss Core supplies many of the MIBs that we need to monitor a broad range of devices. However, we can download and install manufacturer-specific MIBs to extend our monitoring functionality. We'll cover adding MIBs in Chapter8, Settings andAdministration including how to know when you need to download a new MIB. SNMP agents don't always wait to be asked for information. They have the ability to send traps to the network management station as a notification of a system problem. We'll investigate SNMP traps in Chapter7, CollectingEvents.
We'll encounter more SNMP as we move through the remainder of the book, but if you'd like to read more SNMP theory, consider the following resources:
• SNMP RFC: http://www.ietf.org/rfc/rfc1157.txt. • Net-SNMP: http://www.net-snmp.org.
Let's take a quick look at the different SNMP versions before we configure our monitored devices.
SNMP versions
SNMP comes in three versions: v1, v2c, and v3. SNMP v2c provides support for 64-bit counters, and it can embed multiple requests in one packet, whereas v1 needs to send each SNMP request in a separate packet.
SNMP v3 improves upon the "weak" security model of the v1 and v2c by implementing user authentication and roles. In the earlier versions of SNMP, authentication is done with community strings. It's the equivalent of protecting your childhood fort by asking, "What's the secret word," to everyone who knocks on the door.
Let's manufacture an example and configure a Linux server to respond to any SNMP request that contains the community string of "wildchicken". If the Zenoss Core server queries with a SNMP community string of "public", the Linux server won't respond and Zenoss Core won't collect data from the server.
Throughout the course of the book, we won't dwell on which version of SNMP you should use. Use the version that meets your requirements and your devices' capabilities. As we move through the device management chapter, we'll see how to adjust the SNMP collection options in Zenoss Core. Experiment with different configurations, as necessary.
Configuring SNMP on Linux
If we plan to collect device information from the network using SNMP, we need to install an SNMP agent on all devices that we plan to monitor with SNMP. The SNMP agent on the monitored devices listens for incoming SNMP requests from Zenoss Core and responds to the request appropriately. Although there are other SNMP options, Net-SNMP is widely used and recommended by the Zenoss team.
Net-SNMP also includes a set of utilities, such as snmpwalk, snmpget, and snmptrap that can help us manipulate SNMP values and troubleshoot problems. It won't hurt you to install both packages.
The Net-SNMP package names vary from one distribution to the next, so be sure to check with your distribution if you are unsure of which file you need. Here are a few examples:
• Red Hat users can install the agent and the utilities with the command:
yum -y install net-snmp net-snmp-utils
• Ubuntu users can install the agent and utilities with the command:
apt-get install snmpd snmp
Next, we must configure the SNMP agent to process requests and to publish the entire MIB tree. As root, we need to edit the /etc/snmp/snmpd.conf file.
1. Before you make any changes, back up the snmpd.conf file:
cp /etc/snmp/snmpd.conf /etc/snmp/snmpd.conf.bak
2. In the section that begins "First, map the community name into a security name," add the following line and replace public with the value of your community string:
com2sec notConfigUser default public
3. In the section that begins "Second, map the security names into group names," add:
group notConfigGroup v1 notConfigUser group notConfigGroup v2c notConfigUser
4. In the section that begins "Third, create a view for us to let the groups have rights," add:
5. In the section that begins, "Finally, grant the 2 groups access to the 1 view with different write permissions," add the following line:
access notConfigGroup "" any noauth exact systemview none none
6. Add the following lines to the System Contact Information section using your contact details:
syslocation Unknown (edit /etc/snmp/snmpd.local.conf)
syscontact Root <root@localhost> (configure /etc/snmp/snmpd.local. conf)
7. Add the following lines to the Further Information section to send SNMP traps to the Zenoss Core server. Replace the IP address with your Zenoss server IP and use the community string for your network:
trapsink 192.168.1.125 public 162
Downloading the example code
You can download the example code files for all Packt books you have purchased from your account at http://www.PacktPub. com. If you purchased this book elsewhere, you can visit
http://www.PacktPub.com/support and register to have the files e-mailed directly to you.
Configuring SNMP and WMI on Windows
Your Windows server most likely has WMI and SNMP already installed. However, in the event you need to install one or the other, you can do so through Add or Remove Programs.
WMI and SNMP are enabled from the Windows Management and Monitoring Tools packages. To install WMI and SNMP (refer to the following screenshot), follow these steps:
1. Open the Windows Control Panel.
2. Select Add/Remove Windows Components.
After WMI installs, we should confirm that WMI is properly configured: 1. From the Windows Start menu, select Run.
2. Enter the command wbemtest. 3. Select the Connect button.
7. In the search box, type select*fromwin32_service to see a list of services as shown in the next screen capture.
The Windows SNMP agent does not return information about the server's CPU, memory, or file system. For these stats, the Zenoss team recommends the free SNMP (not open source) agent from SNMP Informant located at http://www.snmp-informant.com. No configuration is necessary for SNMP Informant.
Zenoss Plugins
If the device we plan to monitor does not support SNMP, or if we need to monitor a device behind a firewall on a network far, far away, SSH provides an alternative to SNMP. Zenoss Core also supports Telnet, but we'll work with SSH in our examples. In order to collect performance data from our device over SSH, the monitored device needs the Zenoss Plugins installed. And the monitored device needs to have an SSH server installed so that it can accept incoming requests from the Zenoss Core server. OpenSSH from openssh.com offers a good solution.
The level of data provided by plugins varies between platforms. For this reason we may not achieve the same level of detail as we do with SNMP; however, SSH modeling provides more detail than a port scan.
Installing Zenoss Plugins
As a prerequisite to installing the Zenoss Plugins, the monitored system needs a Python environment installed. This can be installed using your distribution's package manager. If you have setuptools installed, you can install the Zenoss Plugins package from the Cheese Shop (http://pypi.python.org/pypi/) with the following command as root:
easy_install Zenoss-Plug-ins
We can also build the plugins package from source:
1. Download the Zenoss Plugins package from http://www.zenoss.com/ download/.
2. Extract the file.
3. From the extracted plugin source directory, run the following commands as root:
python setup.py build python setup.py install
The setuptools procedure installs zenplugin.py to /usr/bin, which is important because we will need to configure the configuration properties(zCommandPath) of the device or device class to look for the plugins at the correct location. We'll review the configuration properties in Chapter3, DeviceSetupandAdministration.
To ensure that the plugin file is working correctly, run the following command on the monitored device:
zenplugin.py –list-plugins
Port scan
Sometimes, the only option we have to model our devices is a port scan. A port scan tries to guess which services are running on a device by connecting to various ports. Port scans provide the least detailed model and may raise security alerts on your network. Consult the security administrators before port scanning devices on the network.
We don't need to make any special provisions on our monitored device if we plan to check the availability of services with port scanning.
Opening monitoring-specific ports
Both the Zenoss Core server and the monitored devices have port requirements. The Zenoss Core server needs to allow access to the following ports:
• TCP port 8080 for HTTP access
• TCP port 514 for syslog access, if Zenoss Core is acting as a syslog server • TCP port 22 for remote SSH access
• UDP port 162 to process SNMP traps
To facilitate monitoring, the systems on the network need to allow access to the following ports:
• UDP 161 for SNMP requests
• TCP port 22 for remote collector plugins via SSH • TCP port 23 for remote collector plugins via Telnet
Configuring Linux firewalls
Iptables is a popular tool for managing firewall access on Linux systems. Assuming, iptables is installed and configured, use the following command to view the current filtering rules:
iptables --list-rules |grep INBOUND
The following screenshot shows a sample list of iptables rules:
Configuring Windows firewall
Windows has built-in firewall support via the Windows Firewall Control Panel (as shown in the following screenshot). If you are unsure about how to configure port access, consult your system documentation or friendly system administrator.
Zenoss Core setup wizard
New installations automatically run a setup wizard that creates a user account, defines an administrator password, and discovers devices attached to the network. Many of you have probably already breezed through this step, but we'll step through the process for the benefit of those of you who are working through an initial install. Even if you already ran the initial setup wizard, you can invoke the add device wizard by selecting the Add Multiple Devices... link on the Infrastructure | Devices page. See the following screenshot:
To access your Zenoss Core installation, open a browser and navigate to port 8080 of your Zenoss Core server. For example, go to http://zenoss.example.com:8080 where zenoss.example. com is your web address.
Step 1: Setting up users
Click the big green arrow to advance the wizard to the Set Up Initial Users screen. The user setup screen will ask you to provide two important pieces of information. The first is an administrative password for Zenoss Core's built-in admin user. You also set up a privileged user account by specifying a User name, Password, and email address.
The admin user in Zenoss Core has superuser privileges, similar to root access on a Linux machine.
It's generally considered bad form to work under a system's admin account, and the same philosophy holds with Zenoss Core. Zenoss Core logs each user's activities throughout the system, so you don't want multiple people making changes as the admin user.
The user account we setup should accommodate all our monitoring tasks.
As we'll see in the user management section of Chapter8, SettingsandAdministration we can control user access to the system via roles.
Click the Submit button after you have entered all the information.
Classes in Zenoss Core establish a default set of monitoring characteristics for a type of device, specifically, the collector plugins. The collector plugins determine what information Zenoss Core collects from each type of device. As we'll find out in Chapter3, DeviceSetupandAdministration when we review device classes in-depth, we can always change the defaults and change the classification.
If we manually add devices, Zenoss Core will assign the device to the class based on the device type we select. For example, if we select Linux Server, the device class will be /Server/Linux. In contrast, if we autodiscover devices, Zenoss Core classifies all our devices in a generic /Discovered class, and we will manually have to classify the devices.
To enter devices in advanced mode, click the link titled skip to the dashboard. Then you can skip to the start of Chapter3, DeviceSetup andAdministration.
Adding devices
When you add a device manually, you provide Zenoss Core the IP address or the hostname of the device. When you add devices automatically, you can specify an entire subnet or ranges of IP addresses.
Here are some reasons you may opt to manually add devices:
• You have a relatively small number of devices on your network
• Your network has a large number of devices with dynamic IP addresses (for example, Workstations)
Here are some reasons you may opt to autodiscover devices: • You have a large number of devices on your network • You need to probe multiple networks and IP ranges
Of course, what you choose to do is a judgment call. Let's look closer at each option.
Manually find devices
Let's step through the process:
1. Make sure the Manually find devices option is selected from the Add Devices screen.
2. In the first text field, enter the IP address or the hostname of the first device.
Make sure the devices you want to add are turned on and connected to the network, else Zenoss Core won't be able to find them. Sounds obvious, right?
3. In the shaded Details box, select a device type from the drop-down box. 4. In the SNMP Credentials field, enter the community strings required to
connect to the device. The defaults are public and private.
As you see in the screenshot, I have three devices specified: sausage, bacon, and 192.168.1.65. The hostname bacon is highlighted and contains an arrow that points to the bacon Details section of the screen. As you click on the hostnames, you'll notice the details section changes too. This allows us to specify a unique set of details for each of the devices we're going to add.
This is a big interface improvement over the earlier versions of Zenoss Core. In the next chapter, we'll take a look at the old add device interface, which has some of its own advantages.
When you have all of your devices entered, click the Submit button. Zenoss Core will create a job that tries to connect to each device using the details you specified for it. You'll be looking at the Zenoss Core dashboard after you submit the job. Take a coffee or tea break. When you come back, we'll review the results of our work.
Autodiscover devices
If we choose to autodiscover devices, we will be prompted to specify SNMP information, SSH login, or Windows administrator credentials. What you enter depends on what types of devices you expect to monitor.
Let's autodiscover some devices. For this example, I'm going to scan my employer, MoJo Active's, network.
1. From the Add Device screen, select autodiscover devices.
2. In the text field for Networks/Ranges, specify a network or an IP range. 3. To add more than one network or IP range, click the button with the plus (+)
sign on it.
5. Click the Discover button to tell Zenoss Core to find your devices. You'll be transferred to the Zenoss Core dashboard.
The authentication options correspond to the monitoring methods we talked about earlier in the chapter.
If Zenoss Core discovers a Windows server, it will try to log in with the supplied username and password to retrieve information via WMI. It will also test the server with the supplied SNMP community strings.
If Zenoss Core discovers a Unix based machine, it will query the device with the SNMP community strings. It will also try to log in via SSH to determine if the Zenoss Plugins are installed.
Our device inventory: A job well done
We have a table that lists the device name, the device IP, the class, the production state, and the number of events. That's a lot of information to process, and we're not going to be able to decode it all at once.
Right now, I'd like to draw your attention to the Events column.
If you're like me, you have several devices with warning level events, which are identified here by the color orange. These are errors that we need to address.
If you autodiscovered your devices, you're going to see more events per device than if you manually added each device. Let's take a look.
To view the details of an event, click on the event column for a device to display the Event Console for the selected device. See the following screenshot:
Informational events will auto clear after four hours. You don't need to be concerned with them.
If you autodiscovered your network, you could see multiple events as Zenoss Core tried to connect to the device with WMI, SNMP, and SSH. Any failed attempts will generate an event that we have to deal with by properly configuring our devices to be monitored or by tuning how we monitor. We'll tune our monitoring in Chapter 5, Custom Monitoring Templates, Chapter 6, CoreEventManagement, and Chapter 7, Collecting Events.
To clear an event, highlight the event and click the Close selected event button at the top of the Event Console.
Manually adding the device will cause Zenoss Core to generate fewer events. However, you may see a warning event that indicates the SNMP agent is down, which indicates SNMP is not properly configured.
Before we can model our devices, we must resolve our SNMP, WMI, or Zenoss Plugin issues. Modeling our devices means we collect performance data, such as disk utilization, CPU utilization, and interface information.
Before we clean up our device inventory, let's take a look at the device discovery process in a bit more detail by examining the log file.
Reviewing device creation job log
To review the log file from our device discovery job, click on the Advanced menu to display the Settings page. From the sidebar navigation, choose Jobs. Then select the Jobs tab to display a table of completed jobs. Actually, if the job is currently running, it will still show in this table with a status of running.
Click the notepad to display the log file:
At the top of the log file, we can see that our device creation job ran the zendisc command:
$ZENHOME/bin/zendisc run --now --monitor localhost \
--deviceclass /Discovered --job 015be396-c020-424f-bbd1-ad37cc28e6ec \ --net 192.168.0.0/24
Zendisc is a device management command that operates in the collection layer of Zenoss Core's architecture.
The job of zendisc is to scan the supplied network or IP address for a device, and for each device it finds, create a device in the inventory. The discovered devices are added to the Zope database ZODB.
The command accepts several options. The --deviceclass option sets the default class for each new device. The --net option scans the supplied network. These command line options correspond to the values we entered in the add device wizard.
To see the available options for zendisc, run the following command as the zenoss user: zendischelp.
Let's take a look at the log file for a manually added device and note the differences:
As the screenshot indicates, our command is:
$ZENHOME/bin/zendisc run --now -d coyote --monitor localhost \
--deviceclass /Server/Linux --job 015be396-c020-424f-bbd1-ad37cc28e6ec
zendisc used the --deviceclass option to set the device class to /Server/Linux and the -d option specifies a hostname, instead of the --net option we used in the autodiscovery example.
As we step through each of our log files, we can see what transpires between Zenoss Core and the device. The zendisc daemon scans each device looking for SNMP, WMI, and the Zenoss Plugins.
In the screenshot of the manually added device, there are some lines that follow the format of Processing zenoss.snmp.DeviceMap for device localhost. This indicates that zendisc successfully connected via SNMP and is running each of the collector plugins for the /Server/Linux device class, of which zenoss.snmp.DeviceMap is one.
Adding a single device
We've seen how you can autodiscover the devices on your network, but you may not want to monitor all of the discovered networks. For example, you may have workstations, test servers, and other systems not worth monitoring. By adding a single device at a time, you can also specify device attributes, including classes, SNMP properties, serial numbers, notes, and more.
The Add a Single Device window displays as a pop up with the option to add several device attributes:
The advantage of adding devices from this view is that we can add a device with a specific set of properties. The wizard didn't give us this kind of flexibility.
Entering device attributes
At a minimum, we should enter a Device Name and Device Class. The Device Name identifies the IP address or resolvable hostname, while the Device Class Path sets the monitoring properties we want our device to inherit by default. Device classes are a core concept in Zenoss Core and we will discuss them at length in Chapter3, DeviceSetupandAdministration.
As you look at the Add Single Device window, you will notice there is a More link that displays additional attributes.
Some of the fields, such as groups, class, systems, and location, are often referred to as "organizers" because they create hierarchies that help categorize the device inventory. The organizers help us define monitoring properties, categorization, and alerting rules. Alerting rules dictate how administrators are notified when events occur.
The Add Device Options table lists the available attributes we can set when manually adding a device:
Add Device Options
Field name Description More info
Name or IP Specify the IP address or
resolvable hostname of the device to be monitored.
You can rename the device later to anything you want.
Device Class Select a class from the drop-down
list that describes the device. The classes form a hierarchy of monitoring properties where devices inherit the properties of the parent class.
Model Device Determines whether or not Zenoss will try to model the device using SNMP, WMI, and SSH.
Leave unchecked if you know the device doesn't support any of the monitoring protocols.
Collector The default collector is localhost. The collector defines how Zenoss collects information, including polling intervals. SNMP Community Specify the SNMP community
string to try when zendisc discovers the device.
Leave this field blank if the device doesn't support SNMP.
SNMP Port The default SNMP port is 161. Zenoss Core will send SNMP get requests to the port specified for the device. Tag Number Text field to record service tag
numbers or model numbers for the device.
This field helps you manage your devices by providing a place to store service-related information.
Serial Number Text field to record serial numbers or other identifying information.
Add Device Options
Field name Description More info
Production State Select the appropriate state of this device:
Production states provide rules for monitoring, alerting, and display: Priority Select the device's priority:
• Highest
How important are your devices? Use the priority field to rank how important one device is in relation to the others.
Rack Slot Enter the physical location. Never let a device hide from you again.
Title Enter an alternate name. The title will be used throughout the interface to refer to the device.
Comments Text field to file notes about the
device. Enter troubleshooting steps, configuration information, or share a haiku.
HW Manufacturer Select the name of the device
Add Device Options
Field name Description More info
HW Product Select the product name from the drop-down list. The available products are dependent on the selected HW Manufacturer.
Describe the device.
OS Manufacturer Select the operating system information from the drop-down list.
Describe the device in terms of the operating system.
OS Product Select the appropriate operating system version. The available products depend on the selected OS Manufacturer.
Describe the device in terms of the operating system.
Location Path Select a location from the
drop-down list. The location can describe the device's location in terms of office, city, room, country, or whatever you deem appropriate.
Systems Select a Systems organizer from the drop-down list. You can select multiple systems.
The Systems organizer is a free form classification that helps you describe the device in the context of your organization. Groups Select a Groups organizer from
the drop-down list. You can select multiple groups.
The Groups organizer is a free form classification that helps you describe the device in the context of your organization.
After we enter the configuration information for the device, click the Add button to schedule the job to run via Zenoss Core's zenjobs daemon. You may check on the status of the job by going to Advanced | Settings | Jobs. Refresh the device list to see the newly-added device.
Importing a list of devices with
zenbatchload
So far, we've seen ways to build our device inventory through the web interface. In one case, we auto-discover everything and in the other case, we add the devices one at a time.
In its simplest form, zebatchload will process a text file that lists one device per line. Here's a sample list of devices that I will call deviceList.txt:
device01 router02 web03
Since zenbatchload is a Zenoss Core daemon, we need to run it as the zenoss user. Here are the commands:
su – zenoss
<enter zenoss user's password> zenbatchload deviceList.txt
The zenbatchload command will attempt to run SNMP on each device. If the device doesn't support SNMP, it won't be added to the inventory. The zenbatchload
command accepts device classes, options, and zProperties in the text file. We'll talk about zProperties in the Chapter3, DeviceSetupandAdministration.
Let's modify deviceList.txt with some options:
/Network/Router
device01 comments ='Sample Device' /Server/Linux
router2 zSnmpMonitorIgnore='true' web03 serialNumber='013478783'
The first thing we added was device class definitions. That's the /Network/Router and /Server/Linux lines. The second thing we added was a list of comma-separated options for each device. The option's value is enclosed in quotes.
When you specify the device class, zenbatchload will identify the class name and assign all subsequent devices to that class name until it detects a new class name. So, in our example, device01 is automatically assigned to/Network/Router, router2 and web3 are assigned to /Server/Linux. Classes are coming up in the next chapter. If you want to see which options you can use within the zenbatchload text file, run the following command:
zenbatchload --show_options
The zenbatchload file is a harness file for the $ZENHOME/Products/ZenModel/ BatchDeviceLoader.py file. It's well documented and gives more usage examples.
Command line discovery with zendisc
The zendisc daemon gives us an opportunity to discover devices from the command line. It can be a helpful troubleshooting tool, or it can be a way for you to shed the Web interface and satisfy your curiosity about how Zenoss Core works. Let's take a look at a few example commands.To see a list of available options, run the following command as the zenoss user:
zendisc help
Let's work through an example where we remodel a device on our network. Modeling the device gives Zenoss Core the characteristics about the device that we monitor. Sometimes Zenoss Core may not be collecting the information we think it should, so we need to figure out why.
Run the following command as the zenoss user:
zendisc run --remodel -d coyote --logseverity=10
Because we used the --logseverity=10 option, the output is verbose and we can step through the remodeling process, one line at a time. A value of 10 provides the highest level of verbosity.
The -dcoyote option ran the --remodel on the device named coyote. Now, if you ran the command exactly as I wrote it, zendisc should have reported that it couldn't find an IP address for the device. Feel free to run the command again and substitute the IP address or hostname of a device on your network.
The run option tells zendisc to immediately run in the foreground, specifically for debugging.
Let's try another command to scan a network for available devices:
zendisc run --net=192.168.0.0/24 --parallel=8
One more example: This time let's find all the routers on a network and automatically assign them a device class:
zendisc run --net=192.168.0.0/24 --routers \ --deviceclass=/Server/ Network/Routers
While zendisc is helpful for debugging, you could use it to work directly with your device inventory. I know many of you will prefer the command line to the web environment, so enjoy.
Summary
In order to monitor a device, we need to tell Zenoss Core how to monitor the device. Our options include SNMP, WMI, or Zenoss Plugins over SSH. Then we have to make sure the monitored devices are configured to respond to the monitoring protocol Zenoss Core uses for each device.
As you look at your Zenoss Core device list, you should see a list of devices.
However, you may see several events that indicate Zenoss Core is not able to model devices correctly. Events could also signify there's a problem with the monitored device, but we're just starting out. It's more likely we need to tweak the monitoring properties of each device.
A common point of failure in establishing the relationship between the monitoring server and monitored device is credentials. If you are having problems, make sure Zenoss Core can authenticate using the unique credentials for each device.
Our monitoring protocols also require access to specific ports. In this chapter, we outlined the common ports that Zenoss Core will need open in order to monitor via SNMP and SSH.
Device Setup and
Administration
Based on our work in Chapter 2, DiscoverDevices Zenoss Core is now monitoring all the devices we added to our inventory. However, Zenoss Core is probably not monitoring the way we need it to, and if we look closely, we may notice
that some devices have events associated with them. In this chapter, we're going to configure our devices so that we ensure we collect the proper information. As we work through the chapter, we will:
1. Organize devices by class, location, system, and group 2. Model devices via SNMP, WMI, and Zenoss Plugins 3. Troubleshoot our Zenoss Core data collection 4. Administer device properties
We'll spend the bulk of this chapter fine-tuning our device inventory and getting it into monitoring shape. One of Zenoss Core's critical concepts is inheritance, which means that the devices inherit monitoring properties from their parent device class. We can change the monitoring rules at the device level by tweaking individual device properties, called zProperties.