THE PERFORMANCE OF
3-BLADE PROPELLER TYPE HOUSEHOLD COMMON FAN
AS WIND TURBINE
FINAL ASSIGNMENT
Presented as a Partial Fulfillment of the Requirements for degree of Sarjana Teknik
in Mechanical Engineering
Proposed by:
ANANDIKA NEVADA Student Number: 045214032
To
THE PERFORMANCE OF
3-BLADE PROPELLER TYPE HOUSEHOLD COMMON FAN
AS WIND TURBINE
FINAL ASSIGNMENT
Presented as a Partial Fulfillment of the Requirements for degree of Sarjana Teknik
in Mechanical Engineering
Proposed by: ANANDIKA NEVADA Student Number: 045214032
To
THE PERFORMANCE OF
3-BLADE PROPELLER TYPE HOUSEHOLD COMMON FAN
AS WIND TURBINE
Arranged by: Name: Anandika Nevada Student Number: 045214032
Approved by:
Yogyakarta, 16th March 2011 Advisor
FINAL ASSIGNMENT
THE PERFORMANCE OF
3-BLADE PROPELLER TYPE HOUSEHOLD COMMON FAN
AS WIND TURBINE
Prepared and arranged by: Name: Anandika Nevada Student Number: 045214032
Defended before Board Examiner on 20th January 2011
Board Examiners
Chairman : I Gusti Ketut Puja, S.T., M.T. ...
Secretary : Ir. Rines, M.T. ...
Member : Budi Sugiharto, S.T., M.T. ...
This Final Assignment had been accepted as one of the requirements to achieve the degree of Sarjana Teknik
Yogyakarta, 17th March 2011 Faculty of Science and Technology
Sanata Dharma University Yogyakarta
ABSTRACT
ABSTRACT
This research aims to utilize fan blade from a fan to generate electricity. The research was done with laboratory scale experiment, with a wind tunnel which generates wind between 0 m/s to ±6.6 m/s, and variety of electronic load of 12 Ω, 6 Ω, 4 Ω, 3 Ω, 2.4 Ω, 2 Ω, 1.7 Ω, 1.5 Ω, 1.3 Ω and 1.2 Ω.
From this research, peak efficiency of ±24% was obtained with wind speed of 4.6 m/s. The highest electricity power generated was ±4.5 W with wind speed of ±6.6 m/s and load of 6 Ω.
ABSTRAK
Penelitian ini bertujuan memanfaatkan bilah kipas dari kipas angin untuk menghasilkan listrik.
Penelitian ini dilakukan dengan percobaan skala laboratorium, dengan menggunakan terowongan angin yang menghasilkan kecepatan angin antara 0 m/s hingga ±6.6 m/s, dan beban listrik bervariasi 12 Ω, 6 Ω, 4 Ω, 3 Ω, 2.4 Ω, 2 Ω, 1.7 Ω, 1.5 Ω, 1.3 Ω and 1.2 Ω.
MOTTO AND DEDICATION
“FAILURE IS MOTHER OF ALL
SUCCESS”
James Tan – Dear old friend, thanks for giving me this word. I will remember it always.
“THE GOAL IS ALWAYS IN THE
PROCESS”
Brother Marjito – Dear brother, thanks for giving us this word. There will always be a time to process ourselves to
be a better person.
“PERPETUATE PROGRESS SUCCESS”
Parry Primary School – Though you are now just a history, your motto lives deep in my heart. Thanks for educating me for 5 years, teaching me to love science.“MENJADI KARTIKA BANGSA”
Pangudi Luhur Van Lith Senior High School – I shall continue the spirit of Van Lith as kartika Bangsa. ThanksSTATEMENT OF NOVELTY
STATEMENT OF NOVELTY
I hereby declare and acknowledge this Final Assignment had never been written by any person in any writing published personally or institutionally in any form, except writings that are cited in references.
Yogyakarta, 3th March 2011
The Writer
DIGITAL DOCUMENT USAGE RIGHTS AGREEME
DIGITAL DOCUMENT USAGE RIGHTS AGREEMENT
I, tha
vada
w
THE PERFORMA E HOUSEHOLD
chment within this document to Public as Open-Source
the need of my permission and royalty, for given my name stated as the writer.
Anandika Nevada
NT
t put the signature below,
Name : Anandika Ne
Student Number : 045214032
Institution : Sanata Dharma University ould like to release my Final Assignment, which entitled:
NCE OF 3-BLADE PROPELLER TYP COMMON FAN AS WIND TURBINE
including atta
information.
With this, I hereby grant the rights any private user, institution, organization or community to store, rewrite, reprint, and republish portion or whole part of my document mention above in and into any media for non-commercial purpose, without
Yogyakarta, 3rd March 2011
LEMBAR PERNYATAAN PERSETUJUAN PUBLIKASI KARYA ILMIAH
LEMBAR PERNY ARYA ILMIAH
UNTUK KEPENTINGAN AKADEMIS
Yang
vada
da Perpustakaan
U
THE PERFORMA E HOUSEHOLD
kan loyalti kepada saya selama tetap mencantumkan nama saya sebagai Demikian pernyataan ini yang saya buat dengan sebenarnya.
Anandika Nevada
ATAAN PERSETUJUAN PUBLIKASI K
bertanda tangan dibawah ini ,
Nama : Anandika Ne
Nomor Mahasiswa : 045214032
Demi pengembangan ilmu pengetahuan, saya memberikan kepa
niversitas Sanata Dharma karya ilmiah saya yang berjudul:
NCE OF 3-BLADE PROPELLER TYP COMMON FAN AS WIND TURBINE
Beserta perangkat yang diperlukan. Dengan demikian saya memberikan kepada Perpustakaan Universitas Sanata Dharma hak untuk menyimpan, mengalihkan dalam bentuk media lain, mengelolanya dalam bentuk pangkalan data, mendistribusikan secara terbatas dan mempublikasikannya di Internet atau media lainnya untuk kepentingan akademis tanpa perlu meminta izin dari saya maupun memberi
penulis.
Dibuat di Yogyakarta Tanggal 3 Maret 2011
PREFACE
PREFACE
The writer would like to give praise to Jesus Christ for His greatness, thus the writer was able to complete this Final Assignment, and my deepest gratitude to:
− Head of Mechanical Engineering Department and Final Assignment Advisor, Budi Sugiharto, S.T., M.T., for many technical support and numerous miscellaneous advices.
− Vice Head of Mechanical Engineering Department and Academic Advisor, Ir. Rines, M.T., for academic support and numerous miscellaneous advices. − Head of Energy Conversion Laboratory, Ir. YB. Lukiyanto, M.T., for
permission to use the Energy Conversion Laboratory, technical support and advices.
− Laboratory Assistant, Intan Widanarko and Martono DS, for technical assistance.
− Dean of Faculty of Science and Technology, Yosef Agung Cahyanta, S.T., M.T. and Vice Dean of Faculty of Science and Technology, A. Bayu Primawan, S.T., M.Eng., for academic support by enabling me to extend my study period.
− All staff in the Faculty of Science and Technology not mention here, for any miscellaneous support.
− My Parents, Wenny Christianto and Ong Djoen Siong, for financial and spiritual support, last but not least great love and care.
− My Spiritual Father, Suharto Widodo Pr., for spiritual support.
− Brothers and sisters of Community of Sant’Egidio, for spiritual support and care.
Though this Final Assignment was written to serve as partial requirement to pass and obtain undergraduate degree, the writer wrote to promote wind-energy research. By writing with a simple language, the writer hopes to ease readers in digesting information. The writer avoids lengthy writing to give the reader brief but complete information on this research.
CONTENT
CONTENT
TITLE PAGE ... i
APPROVAL PAGE ... ii
ACCEPTANCE PAGE... iii
ABSTRACT ... iv
MOTTO AND DEDICATION... v
STATEMENT OF NOVELTY ... vi
DIGITAL DOCUMENT USAGE RIGHTS AGREEMENT ... viiT LEMBAR PERNYATAAN PERSETUJUAN PUBLIKASI KARYA ILMIAH ... viii
PREFACE... ix
CONTENT ... xiT LIST OF TABLES ... xiii
LIST OF FIGURES ... xiv
NUMENCLATURE ... xv
CHAPTER 1. INTRODUCTION 1.1. Background of Research ... 1
1.2. Statement of Problem ... 2
1.3. Objective of Research ... 2
1.4. Research Usage ... 2
CHAPTER 2. REVIEW OF RELATED LITERATURE AND THEORIES 2.1. Wind ... 3
2.2. Properties of Air ... 3
2.3. Power in the Wind... 3
2.4. Wind Turbine ... 4
2.5. Performance of Wind Turbine... 5
3.2.1. Pre-experimental Procedure ... 8
3.2.1.1. Apparatus Building ... 8
3.2.1.2. Blade Testing ... 10
3.2.1.3. Dynamometer Installation ... 10
3.2.1.4. Electronic Load Device Circuitry Design... 12
3.2.1.5. Understanding The Measuring Device ... 14
3.2.1.6. Understanding the Wind Inside The Wind Tunnel... 15
3.2.1.7. Arranging and Installing Devices ... 17
3.2.1.8. Condition Creating... 18
3.2.2. Experimental Procedure ... 19
3.2.2.1. Mechanical Efficiency Data Taking Procedure ... 19
3.2.2.2. Overall Efficiency Taking Procedure ... 20
3.2.3. Post-experimental Procedure ... 21
3.2.3.1. Data Calculation ... 21
3.2.3.2. Plotting and Reviewing... 22
CHAPTER 4. EXPERIMENTAL, RESULT ANALYSIS AND REVIEW 4.1. Result and Data Calculation... 23
4.1.1. Mechanical Efficiency of 3-Blade Propeller Type Fan... 23
4.1.2. Overall Efficiency of 3-Blade Propeller Type Fan ... 23
4.2. Observational Review ... 25
4.3. Performance Review ... 28
CHAPTER 5. CONCLUSION AND CONSIDERATION 5.1. Conclusion... 32
5.2. Consideration ... 32
REFERENCES... 33
LIST OF TABLES
LIST OF TABLES
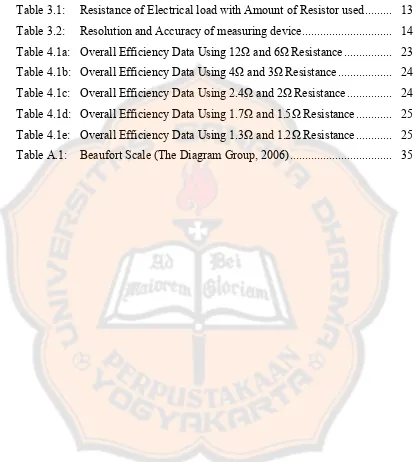
Table 3.1: Resistance of Electrical load with Amount of Resistor used... 13
Table 3.2: Resolution and Accuracy of measuring device... 14
Table 4.1a: Overall Efficiency Data Using 12Ω and 6Ω Resistance... 23
Table 4.1b: Overall Efficiency Data Using 4Ω and 3Ω Resistance... 24
Table 4.1c: Overall Efficiency Data Using 2.4Ω and 2Ω Resistance... 24
Table 4.1d: Overall Efficiency Data Using 1.7Ω and 1.5Ω Resistance... 25
Table 4.1e: Overall Efficiency Data Using 1.3Ω and 1.2Ω Resistance... 25
LIST OF FIGURES
LIST OF FIGURES
Figure 2.1: Quantity of Wind Captured... 4
Figure 2.2: Components of Torque ... 5
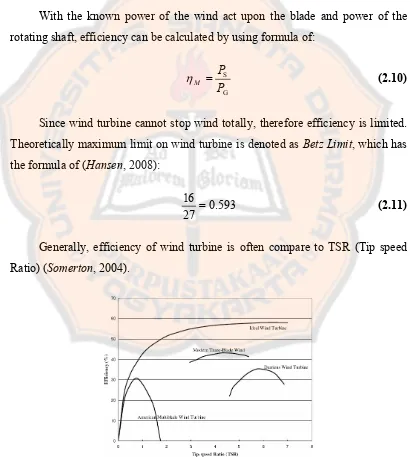
Figure 2.1: Efficiency vs. TSR of some common wind turbine (Somerton, 2004). ... 6
Figure 3.1: Construction of experimental apparatus ... 9
Figure 3.2: Blade Installation ... 9
Figure 3.3: Overall view of Dynamometer ... 11
Figure 3.4: Break Mechanism of Dynamometer ... 11
Figure 3.5: Electrical Load circuit... 12
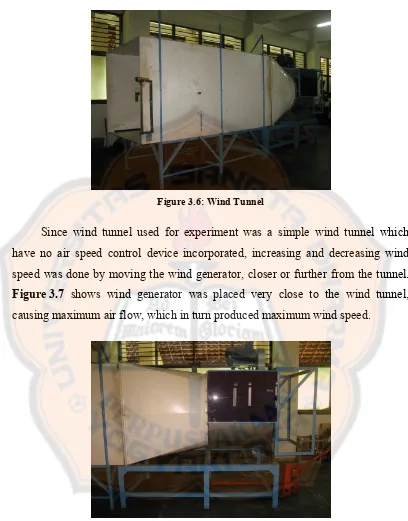
Figure 3.6: Wind Tunnel ... 16
Figure 3.7: Wind Generator... 16
Figure 3.8: Blade Emplacement ... 17
Figure 3.9: Measuring device position ... 17
Figure 4.1: Wind Speed versus Blade Rotational Speed Correlation Graph ... 26
Figure 4.2: Electrical Power versus Rotational Speed Correlation Graph (Resistance Aspect)... 27
Figure 4.3: Electrical Power versus Rotational Speed Correlation Graph (Wind Speed Aspect) ... 27
Figure 4.4: TSR versus Overall Efficiency Correlation Graph ... 28
Figure 4.5: Wind Speed versus Overall Efficiency Correlation Graph... 29
NUMENCLATURE
Subscribe:
B = Blade
E = Electrical G = Gas or wind
S = Shaft
X = Brake
Numbering, Units and symbols:
CHAPTER 1. INTRODUCTION
CHAPTER 1
INTRODUCTION
1.1. Background of Research
Electricity is an important source of energy in our life. Despite of its usages, producing electricity is a major problem in many countries which do not have large quantities of natural resources. Large uses of natural resource have created another major problem. As natural resource continue to be used up, together with issues of its limited amount, have pushed the frontier of science to research on alternative renewable energy.
Wind is chosen because of its abundance in nature. Furthermore, wind is a clean and environmentally safe-to-use source of energy. Despite of its many environmental advantages, wind energy is limited in some area of the world. Wind-harvesting process requires a large area; therefore it is rendered it as disadvantage in small country, or country with rare windy days. Despite of its disadvantages, research on utilizing wind become an interesting subjects to nation which do not want to be oil-import dependent.
1.2. Statement of Problem
This research will focus in answering statement of problem below:
1. How efficient of 3-blade propeller type common household fan in converting kinetic energy from the wind into mechanical energy in shaft? 2. How efficiency of 3-blade propeller type common household fan in
producing electricity?
1.3. Objective of Research
This research is done to achieve the following objectives:
1. To review the ability of 3-blade propeller type common household fan in converting kinetic energy into mechanical energy.
2. To review the productivity of 3-blade propeller type common household fan in producing electricity.
1.4. Research Usage
CHAPTER 2. REVIEW OF RELATED LITERATURE AND THEORIES
CHAPTER 2
REVIEW OF RELATED LITERATURE AND THEORIES
2.1. Wind
The sun provides a continuous ray to the rotating earth, thus heating the air, the sea and the land at different strength depending on many geographical factors and locations. (The Diagram Group, 2006)
The process of receiving and losing heat at a different rate causes the temperature and density of air to change. This was followed by pressure changes. Pressure change creates high-pressure zone and low-pressure change, which causes mass of air movements, from high-pressure zone to low-pressure zone. This mass of air movements is called as wind (Aguado and Burt, 2008).
2.2. Properties of Air
Standard condition of 1 atmospheric pressure and temperature of 25°C, air density is 1.255 kg/m³. If the location is above sea level with moderate climate, and more precise value is needed, density of air may be calculated using the equation without significant error (Hughes, 2000):
(
×)
⋅z−
= −4
G 1.255 1.194 10
ρ (2.1)
2.3. Power in the Wind
Since wind is defined as moving mass of air, therefore we can conclude that wind is a form of “kinetic energy” (American Wind Energy Association, 2009), which means calculable by using formula:
2
1 m v
The formula is modified equivalently as:
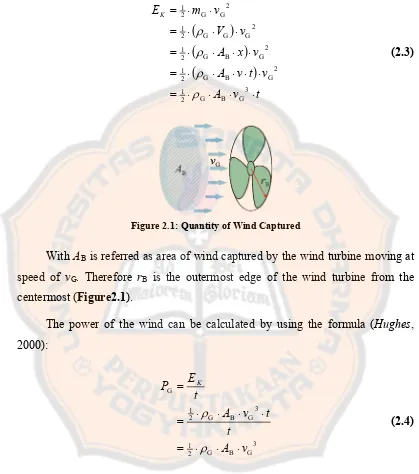
Figure 2.1: Quantity of Wind Captured
With AB is referred as area of wind captured by the wind turbine moving at speed of vG. Therefore rB is the outermost edge of the wind turbine from the centermost (Figure2.1).
The power of the wind can be calculated by using the formula (Hughes, 2000):
2.4. Wind Turbine
2.5. Performance of Wind Turbine
Kinetic energy in the wind creates force that pushes the blades of a wind turbine. The forces that act on the blades create torque and cause the shaft to turn
(Figure 2.2). Therefore the formula of torque can be stated as (Crowell, 2010):
F r ⋅
=
Τ S (2.5)
Figure 2.2: Components of Torque
The work done by moving objects can be calculated by using formula of (Crowell, 2010):
s F
EW = ⋅d (2.6)
Therefore the amount of work done by blades over shaft can be calculated substituting distance with circular distance. Therefore the formula becomes:
(
r N)
F
EW = ⋅ π ⋅2⋅ S⋅ (2.7)
With formula of power as (Crowell, 2010):
t E
P = W
Therefore we can write the power of blade use to turn the shaft with the
With the known power of the wind act upon the blade and power of the rotating shaft, efficiency can be calculated by using formula of:
G
Since wind turbine cannot stop wind totally, therefore efficiency is limited. Theoretically maximum limit on wind turbine is denoted as Betz Limit, which has the formula of (Hansen, 2008):
TSR can be calculated by using formula (Hansen, 2008):
G B
TSR
v r
⋅
=ω (2.12)
2.6. Generator and Electricity
Generator is an instrument that converts mechanical energy into electricity. The power of electricity can be calculated by using formula (Crowell, 2010):
V I
PE = ⋅Δ (2.13)
Therefore the overall efficiency of wind turbine in generating electricity can be calculated by comparing the power of electricity produced and the wind:
G E
P P
T =
CHAPTER 3. RESEARCH METHOD
CHAPTER 3
RESEARCH METHOD
3.1. Research Method
To accomplish the objective of research, experimental method was chosen. The experiment will provide the necessary data which was calculated to answer the statement of problem and achieve the objective of research.
3.2. Research Procedure
This research is categorized as explorative research as experiments are needed to obtain data. There are steps done to achieve the objective of this research.
3.2.1. Pre-experimental Procedure
Before the experiments are done, equipments used are built to suit the experiment condition, reviewed and tested to match the experiment goals.
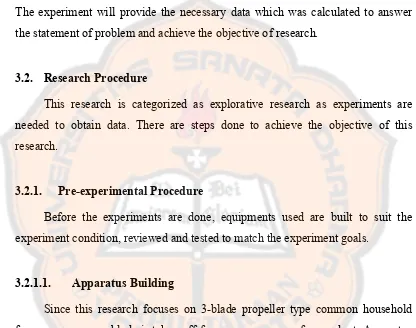
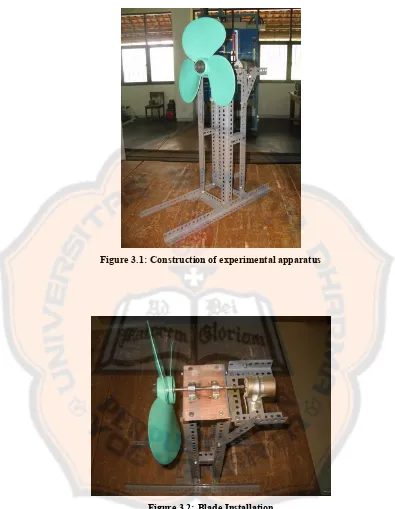
3.2.1.1. Apparatus Building
Since this research focuses on 3-blade propeller type common household fan, an anonymous blade is taken off from an anonymous fan product. Apparatus will be built to ensure the easiness of condition creating and data taking of the blade. The removed blade will be place in the apparatus.
To ensure the steadiness of the blade for experiment, experimental apparatus was built by using right angled holed iron stick and wood plank.
Figure 3.1: Construction of experimental apparatus
Figure 3.2: Blade Installation
3.2.1.2. Blade Testing
Blade that will be tested is a blade taken off from an anonymous 3-blade propeller type common household fan with diameter of 39 cm.
To ensure the capability of blade to capture the wind, pre-experimental on the fan-blade was carried out. The blade was placed into the experimental apparatus, and blown by wind at anonymous speed inside the wind tunnel.
The wind blade was able to rotate, thus answering the capabilities of 3-blade propeller type common house hold fan as a wind energy capturing device.
Despite of the ability to rotate, there was a noticeable slight off-center of the wind blade.
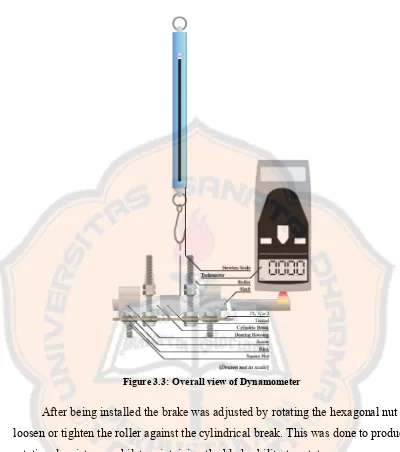
3.2.1.3. Dynamometer Installation
To measure the amount of Power produce by the shaft, a dynamometer had to be used. But since no dynamometer appropriate for the experiment was available, hand-made dynamometer was used.
Hand-made dynamometer used for this experiment uses the concept of a break dynamometer, which uses break as energy absorbing mechanism to measure rotational force which later calculated with diameter of shaft and rotational speed to produce power of shaft.
Figure 3.3: Overall view of Dynamometer
After being installed the brake was adjusted by rotating the hexagonal nut to loosen or tighten the roller against the cylindrical break. This was done to produce rotational resistance whilst maintaining the blade ability to rotate.
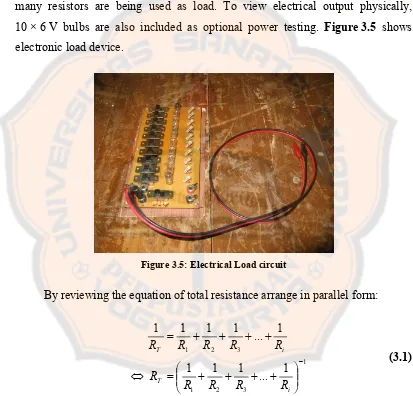
3.2.1.4. Electronic Load Device Circuitry Design
To measure electrical power, generator had to be loaded. Electronic load device that was going to be used, was an electronic load device consist of 10 × 12 Ω 5% 2 W Resistors arranged in parallel form. Resistors are soldered to PCB (Printed Circuit Board) with the switch on each Resistor to determine how many resistors are being used as load. To view electrical output physically, 10 × 6 V bulbs are also included as optional power testing. Figure 3.5 shows electronic load device.
Figure 3.5: Electrical Load circuit
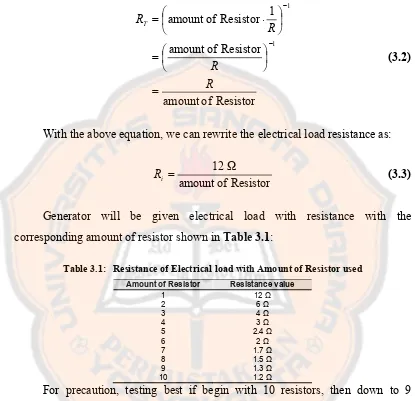
By reviewing the equation of total resistance arrange in parallel form:
With the use of similar resistance value, therefore we can write the equation
With the above equation, we can rewrite the electrical load resistance as:
Resistor
Generator will be given electrical load with resistance with the corresponding amount of resistor shown in Table 3.1:
Table 3.1: Resistance of Electrical load with Amount of Resistor used
Amount of Resistor Resistance value
1 12 Ω
For precaution, testing best if begin with 10 resistors, then down to 9 resistors and so on. If unknown electrical power is given, electrical test should use 10 bulbs, then down to 9 bulbs and so on, while measuring the voltage and Current.
3.2.1.5. Understanding The Measuring Device
Since most of the measuring devices are digital electronic device, calibration cannot be done by mechanical means. Electronic device are fallible due to limited resolution of display and electronic fault.
Table 3.2 shows all measuring devices, modes, used for the entire data
taking with resolution and accuracy of the device respectively.
Table 3.2: Resolution and Accuracy of measuring device
Model Figure Mode used Resolution Accuracy
Testo 425 ±1 Digit of resolution
CDT-2000HD
Digital Tachometer Non-contact rpm
1 rpm (4 digit)
0.1 rpm (3 digit) ±(0.02%±1Digit)
Heles UX-878 TR
Digital Multi-meter 20 DCV 10 mV
±(1.0% of rdg. ±2Digit)
Heles UX-37 TR
Digital multi-meter 20 DCA 10 mA ±(0.02%±1Digit)
The anemometer used for measuring wind speed does not use moveable parts, but a sensitive electronic component. The anemometer is sensitive to small air flow around the probe. This was seen when the cap was removed from the probe.
Tachometer available for use does not provide rad/s measuring mode, therefore the entire data will be converted using formula:
π
ω 2
60⋅
= n (3.4)
Digital multi-meter is the most delicate measuring device if installed incorrectly. Although most digital multi-meter are design with fuse protection, it still may subject to explosion and burning. Furthermore certain measuring mode such as 10 AC/DCA (Heles UX-878 TR) or 20 AC/DCA (Heles UX-37 TR) are modes that do not use fuse protection.
Digital multi-meter used for measuring voltage is connected parallel to the electronic load device. Measurement begins with 200 DCV to ensure safety of use 20 DCV.
Another digital multi-meter used for measuring current is connected serial to the electronic load device. Measurement begins with 10 DCA. Because the available highest modes are 200 DCmA and 10 DCA, therefore 10 DCA is used.
Pre-experimental testing showed that maximum voltage generated by the generator is ±13 V, this ensure the safety of using 20 DCV. With electronic load device maximum current recorded is ±1.5 A, therefore unfused 10 DCA is considered as safe.
3.2.1.6. Understanding the Wind Inside The Wind Tunnel
Figure 3.6: Wind Tunnel
Since wind tunnel used for experiment was a simple wind tunnel which have no air speed control device incorporated, increasing and decreasing wind speed was done by moving the wind generator, closer or further from the tunnel.
Figure 3.7 shows wind generator was placed very close to the wind tunnel,
causing maximum air flow, which in turn produced maximum wind speed.
Figure 3.7: Wind Generator
To minimize error during data taking due to interference from outside wind, a wind vane was installed near the wind tunnel to detect major air movements. Thus, whenever major air movements were detected, data taking will be aborted until air movements were stabilize.
3.2.1.7. Arranging and Installing Devices
Since the tachometer used is a probeless hand-held measuring device, data taking is viable from within the wind tunnel. Measuring device was arranged to maximize data validity and to ease reading within one position. Figure 3.8
represents device placement inside the wind tunnel and Figure 3.9 shows how measuring device is placed.
3.2.1.8. Condition Creating
The blade will be tested by the given conditions. The conditions are divided into two categories:
1. Fixed Condition:
Fixed Condition is condition that is constant throughout the experiments, or is assumed to be constant during the experiment, includes only ρG (Density of air)
Since the location of the experiments is 170 m above sea level, therefore the density of air calculated with Formula (2.1) will be:
(
)
2. Variable Condition
Variable condition is condition that will be change variably on purpose to stimulate data, which consist of only (Wind Speed). Ideally wind speed that will be given range between 0 m/s to 10.5 m/s with increment of 0.25 m/s.
G v
3.2.2. Experimental Procedure
Experiments are done to extract data, which later calculated and analyst to fulfill the research goals.
3.2.2.1. Mechanical Efficiency Data Taking Procedure
The first experiment goal was to extract data of the 3-blade propeller type fan with variety wind speed. The data will then be calculated to obtain mechanical efficiency.
To achieve experiment goal, data collected for this experiment will be divided into two categories:
1. Fixed data
Fixed data is the data collected once and is used for the entire analyst procedure. These data includes:
− rB (Radius of Blade) − rS (Radius of Shaft)
2. Variable data
Variable data is the data collected at certain condition. These data includes: − FS (Rotational force acting upon the shaft)
− ω (Rotation speed)
Since the break used for this experiment was a contact-type break, the vibration in rotational force reading occurred during testing. Despite of the vibration, reading was still possible by estimating reading in the middle of between the highest and the lowest peak.
3.2.2.2. Overall Efficiency Taking Procedure
The second experiment goal was to extract data of the 3-blade propeller type fan with variable wind speed and electrical resistance. The data will then be calculated to obtain overall efficiency.
To achieve experimental goal, data collected for this experiment will be divided into two categories:
1. Fixed data
Fixed data is the data collected once and is used for the entire analyst procedure. These data include only rB (Radius of Blade).
2. Variable data
Variable data is the data collected at certain condition. These data includes: − V (Voltage generated)
− I (Current generated)
Similar to mechanical efficiency data-taking procedure, wind speed and rotational speed used for data taking was average value measured for one minutes.
3.2.3. Post-experimental Procedure
After the experiments, data are calculated, and the result will be analyst to fulfill research objectives.
3.2.3.1. Data Calculation
Calculation are done to obtain analyzable result. These calculation are performed:
1. PG (Power of Wind)
Calculation is done by calculating vG created during experiment, and ρG obtainable from Equation (3.5) with Formula (2.4):
2. PS (Power of Shaft)
Calculation is done by calculating FS and ω measured during experiment, and rS is apparatus dependent, with equivalent formula of Formula (2.9):
(
⋅)
⋅ω= S S
S F r
P (3.6)
3. PE (Power of Electricity)
Calculation is done by calculating V and I measured during experiment, with Formula (2.13).
4. ηM (Mechanical Efficiency)
Efficiency will be calculated by comparing between PG and PS, with
Formula (2.10).
3.2.3.2. Plotting and Reviewing
Since this the data of this research is quantitative data, analysis will be done with the aid of graphic, which will represent calculated data.
Plotting will be done with the aid of Microsoft’s Excel 2003 by comparing the data of:
− TSR and Efficiency. TSR will be calculated with the corresponding condition and data. With TSR as abscissa and Overall Efficiency as ordinate, the data will be plotted into Mechanical Efficiency graphic (Based on TSR), and Overall Efficiency graphic (Compare to TSR).
− Wind Speed and Power of Electricity. With Wind Speed as abscissa and Power of Electricity as ordinate, the data will be plotted as Shaft Power and Electrical Power Graphic.
CHAPTER 4. EXPERIMENTAL, RESULT ANALYSIS AND REVIEW
CHAPTER 4
EXPERIMENTAL, RESULT ANALYSIS AND REVIEW
4.1. Result and Data Calculation
Result of experiment was data that were arranged and calculated in table to ease reading.
4.1.1. Mechanical Efficiency of 3-Blade Propeller Type Fan
Data taken for this experiment produce a flawed result due to inconstant breaking and high slippage in higher rotation within the device which causes error in reading tangential force acting on the shaft. This experiment was discontinued.
4.1.2. Overall Efficiency of 3-Blade Propeller Type Fan
Table4.1a to Table 4.1e represent data taken in Energy Conversion
Laboratory of Sanata Dharma University.
Table 4.1a: Overall Efficiency Data Using 12Ω and 6Ω Resistance
Table 4.1b: Overall Efficiency Data Using 4Ω and 3Ω Resistance
Table 4.1c: Overall Efficiency Data Using 2.4Ω and 2Ω Resistance
Table 4.1d: Overall Efficiency Data Using 1.7Ω and 1.5Ω Resistance
Table 4.1e: Overall Efficiency Data Using 1.3Ω and 1.2Ω Resistance
1.3 Ω 1.2 Ω
4.2. Observational Review
0 200 400 600 800 1000 1200 1400
0 1 2 3 4 5 6 7
vg (m/s)
n
(rp
m
) Removed
Result Corrected
Figure 4.1: Wind Speed versus Blade Rotational Speed Correlation Graph
It is noticeable that rotational speed of blade increased followed by the increment of the wind speed as shown on Figure 4.1. It was shown that the trend correlation between wind speed and rotational speed of the wind turbine tend to be linear. Notice that the data drawn had oscillated greatly in 6.01 m/s wind speed; this was due to instability of wind speed flowing through the anemometer’ probe, thus hindering measurement accuracy of the real wind speed during condition creating procedure.
0
0 200 400 600 800 1,000 1,200 1,400
n (rpm)
Figure 4.2: Electrical Power versus Rotational Speed Correlation Graph (Resistance Aspect)
The amount of electrical power produced by the generator depends on rotational speed. This event can be seen in recorded and calculated data plotted in
Figure 4.2. Maximum electrical power generated by the generator, is noticeable at
resistance of 6 Ω, while rotating at speed of ±1150 rpm.
0
0 200 400 600 800 1,000 1,200 1,400
Seeing from wind speed aspect in Figure 4.3, as electrical load increases, rotational speed tends to fall. The capability of generator to produce power depends on electrical load. The more electrical load, the more torque needed to turn the generator.
By reviewing Figure 4.2 and Figure 4.3, it was seen that the generator produce electricity at a given wind speed increase at electrical load of 6 Ω then decrease as more load are applied. This is cause by armature effect of generator.
4.3. Performance Review
As most wind turbine efficiency are compare to TSR and since this experiment failed to measure mechanical efficiency like other experiments perform by wind-energy professionals. The performance of this wind turbine cannot be compared globally. It is noticeable that TSR of the wind turbine with electrical load could not begin with 0, as higher wind speed was needed to start the blade rotation.
Though global comparison cannot be done, comparing TSR to overall efficiency does not hinder understanding performance of 3-blade propeller type common household fan as wind turbine.
From the data plotted in Figure 4.4, 12 Ω resistance of electrical have higher TSR while performing with efficiency almost equal compared to 6 Ω resistance of electrical load. This can be seen also in low correlation of rotational speed and electrical power gradient of Figure 4.2 as a reason of this event.
Peak efficiency achieved was ±23.5% at TSR of ±4.6. Since TSR is mostly used to compare wind turbine’s performance scientifically, therefore TSR comparison is unusable in common daily life
Figure 4.5 compares efficiency with wind speed instead of TSR. Beaufort
scale is included to the graph to minimize the need of anemometer, as anemometer is limited in availability to wind-energy amateur. A complete table of Beaufort scale can be viewed in Table A.1.
Ca
Figure 4.5: Wind Speed versus Overall Efficiency Correlation Graph
Due to low correlation in rotational speed and electrical power of 12 Ω resistance electrical loads, the overall efficiency is the highest when measured at 6 Ω resistance of electrical load. As the load increased, electrical power generated decreased whilst lowering overall efficiency. This can be seen visually through
Figure 4.2.
As efficiency is not important to most energy user, as most wind-energy user prefer to know more about the quantity of electrical power produced by a wind turbine rather than understanding their efficiency.
This analysis was performed to compare wind speed to electrical power produced to power a resistor as electrical load.
Ca
Figure 4.6: Wind Speed versus Electrical Power Correlation Graph
The decrement of electrical power production with smaller resistance was due to decreasing rotational speed as electrical load increased, whilst compensating for greater electrical power, needed to power 1.2 Ω Resistance of electrical load.
CHAPTER 5. CONCLUSION AND CONSIDERATION
CHAPTER 5
CONCLUSION AND CONSIDERATION
5.1. Conclusion
An objective achievement reviews the whole research process base on objectives fundamentals.
1. Experiment to review 3-blade propeller type common household fan ability in converting kinetic energy into mechanical energy was a success, but with error result.
2. The blade of 3-blade propeller type common household fan can produce electricity with peak efficiency of ±24% at wind speed of ±4.6 m/s (Gentle Breeze).
3. The blade of 3-blade propeller type common household fan produce maximum electrical power of between ±4.5 W at maximum available wind speed of ±6.6 m/s (Moderate Breeze) when given electrical load of 6 Ω.
5.2. Consideration
REFERENCES
REFERENCES
Aguado, E. and Burt, J.E. (2001). Understanding Weather & Climate.2nd Edition. New Jersey: Prentice-Hall, Inc.
Crowell, B. (2010). Simple Nature. California: Light and Matter.
Evans, J. (2007). Confusing Units of Measure – Work Power and Torque. Hansen, M.O.L. (2008). Aerodynamic of Wind Turbines. 2nd Edition. London: Earthscan.
Hughes, T. (2000). Wind Power Tutorial Series. Lesson 1. Environmental verification and Analysis Center. The University of Oklahoma.
Hughes, T. (2000). Wind Power Tutorial Series. Lesson 2. Environmental verification and Analysis Center. The University of Oklahoma.
N.N. (2003). Wind Energy Teacher’s Guide. American Wind Energy Association. Somerton, C. W. (2004). ME 417 Design of Alternative Energy System. Michigan State University.
APPENDIX
APPENDIX A. BEAUFORT SCALE
APPENDIX A. BEAUFORT SCALE