edited by John Helliwell, richard layard and Jeffrey sachs
Happiness
reporT
Table of ConTenTs
1. Introduction
2. World Happiness: Trends, explanations and Distribution
3. Mental Illness and Unhappiness
4. The objective benefits of subjective Well-being
5. Restoring Virtue ethics in the Quest for Happiness
6. Using Well-being as a Guide to Policy
7. The oeCD approach to Measuring subjective Well-being
8. from Capabilities to Contentment: Testing the links between Human Development and life satisfaction
WORLD
HAPPINESS
REPORT
2013
3 2 3
Chapter 1.
IntroductIon
JOHN F. HELLIWELL, RICHARD LAYARD AND JEFFREY D. SACHS
John F. Helliwell: Vancouver School of Economics, university of British columbia, and the canadian Institute for Advanced research (cIFAr)
3
The world is now in the midst of a major policy debate about the objectives of public policy. What should be the world’s Sustainable Development Goals for the period 2015-2030? The World Happiness Report 2013 is offered as a contribution to that crucial debate.
In July 2011 the UN General Assembly passed a historic resolution.1 It invited member countries to measure the happiness of their people and to use this to help guide their public policies. This was followed in April 2012 by the first UN high-level meeting on happiness and well-being, chaired by the Prime Minister of Bhutan. At the same time the first World Happiness Report was published,2 followed some months later by the OECD Guidelines setting an international standard for the measurement of well-being.3 The present Report is sponsored by UN Sustainable Development Solutions Network established by UN Secretary General Ban Ki-moon.
Happiness
The word “happiness” is not used lightly. Happiness is an aspiration of every human being, and can also be a measure of social progress. America’s founding fathers declared the inalienable right to pursue happiness. Yet are Americans, or citizens of other countries, happy? If they are not, what if anything can be done about it?
The key to proper measurement must begin with the meaning of the word “happiness.” The problem, of course, is that happiness is used in at least two ways — the first as an emotion (“Were you happy yesterday?”) and the second as an evaluation (“Are you happy with your life as a whole?”). If individuals were to routinely mix up their responses to these very different questions, then measures of happiness might tell us very little. Changes in reported happiness used to track social progress would perhaps reflect little more than transient changes in emotion. Or impoverished persons who express happiness in
terms of emotion might inadvertently diminish society’s will to fight poverty.
Fortunately, respondents to happiness surveys do not tend to make such confusing mistakes. As we showed in last year’s World Happiness Report and again in this year’s report, respondents to surveys clearly recognize the difference between happiness as an emotion and happiness in the sense of life satisfaction. The responses of individuals to these different questions are highly distinct. A very poor person might report himself to be happy emotion-ally at a specific time, while also reporting a much lower sense of happiness with life as a whole; and indeed, people living in extreme poverty do express low levels of happiness with life as a whole. Such answers should spur our societies to work harder to end extreme poverty.
As with last year’s report, we have again assembled the available international happiness data on how people rate both their emotions and their lives as a whole. We divide the available measures into three main types: measures of positive emotions (positive affect) including happiness, usually asked about the day preceding the survey; measures of negative emotions (negative affect) again asked about the preceding day; and evaluations of life as a whole. Together, these three types of reports constitute the primary measures of subjective well-being.4 The three main life evaluations are the Cantril ladder of life,5 life satisfaction,6 and happiness with life as a whole.7 Happiness thus appears twice, once as an emotional report, and once as part of a life evaluation, giving us considerable evidence about the nature and causes of happiness in both its major senses.
outline of Report
4
•
In Chapter 2 we update our ranking of lifeevaluations from all over the world, making primary use of the Gallup World Poll, since it continues to regularly collect and provide com-parable data for the largest number of countries. We also present tentative explanations for the levels and changes of national-level and regional averages of life evaluations.
•
In Chapter 3 we learn that mental illness is the single most important cause of unhappiness, but is largely ignored by policy makers.•
Chapter 4 adopts a different perspective, looking at the many beneficial consequences of well-being (rather than its causes).•
Chapter 5 discusses values; returning to the ancient insights of Buddha, Aristotle, and others teachers and moralists, that an individual’s values and character are major determinants of the individual’s happiness with life as a whole.•
Chapter 6 looks at the way policy makers can use well-being as a policy goal.•
Chapter 7 presents the OECD’s Guidelines on Measuring Subjective Well-being and general approach, and;•
Chapter 8 explores the link between the UN’s Human Development Index and subjective well-being.We briefly review the main findings of each chapter.
Trends, explanations and distribution
Chapter 2 presents data by country and continent, and for the world as a whole, showing the levels, explanations, changes and equality of happiness, mainly based on life evaluations from the Gallup World Poll. Despite the obvious detrimental happiness impacts of the 2007-08 financial crisis, the world has become a slightly happier and more generous place over the past five years. Because of continuing improvements in most
supports for better lives in Sub-Saharan Africa, and of continued convergence in the quality of the social fabric within greater Europe, there has also been some progress toward equality in the distribution of well-being among global regions.
There have been important continental cross-currents within this broader picture. Improvements in quality of life have been particularly notable in Latin America and the Caribbean, while reductions have been the norm in the regions most affected by the financial crisis, Western Europe and other western industrial countries; or by some combi-nation of financial crisis and political and social instability, as in the Middle East and North Africa.
Mental health and unhappiness
The next chapter focuses on mental health. It shows that mental health is the single most important determinant of individual happiness (in every case where this has been studied). About 10% of the world’s population suffers from clinical depression or crippling anxiety disorders. They are the biggest single cause of disability and absenteeism, with huge costs in terms of misery and economic waste.
Cost-effective treatments exist, but even in advanced countries only a third of those who need it are in treatment. These treatments produce recovery rates of 50% or more, which mean that the treatments can have low or zero net cost after the savings they generate. Moreover human rights require that treatment should be as available for mental illness as it is for physical illness.
Effects of well-being
5
The authors of Chapter 4 show that subjective well-being has an objective impact across a broad range of behavioral traits and life outcomes, and does not simply follow from them. They observe the existence of a dynamic relationship between happiness and other important aspects of life with effects running in both directions.
Values and happiness
Chapter 5 discusses a riddle in the history of thought. In the great pre-modern traditions concerning happiness, whether Buddhism in the East, Aristotelianism in the West, or the great religious traditions, happiness is determined not by an individual’s material conditions (wealth, poverty, health, illness) but by the individual’s moral character. Aristotle spoke of virtue as the key to eudaimonia, loosely translated as “thriving.” Yet that tradition was almost lost in the modern era after 1800, when happiness became associated with material conditions, especially income and consumption. This chapter explores that transition in thinking, and what has been lost as a result. It advocates a return to “virtue ethics” as one part of the strategy to raise (evaluative) happiness in society.
Policy making
Chapter 6 explains how countries are using well-being data to improve policy making, with examples from around the world. It also explains the practical and political difficulties faced by policy makers when trying to use a well-being approach. The main policy areas considered include health, transport and education. The main con-clusion is that the well-being approach leads to better policies and a better policy process.
OECD Guidelines
Chapter 7 describes the OECD approach to measuring subjective well-being. In particular the OECD approach emphasizes a single primary measure, intended to be collected consistently across countries, as well as a small group of core measures that data producers should collect where possible.8 The content and underpinnings
of the OECD approach are laid out more fully in the recent OECD Guidelines on Measuring Subjective Well-being. The chapter also outlines progress that has been made by national statistical offices, both before and after the release of the guidelines.
Human Development Report
Chapter 8 investigates the conceptual and empirical relationships between the human development and life evaluation approaches to understanding human progress. The chapter argues that both approaches were, at least in part, motivated by a desire to consider progress and development in ways that went beyond GDP, and to put people at the center. And while human development is at heart a conceptual approach, and life evaluation an empirical one, there is considerable overlap in practice: many aspects of human development are frequently used as key variables to explain subjective well-being. The two approaches provide complementary lenses which enrich our ability to assess whether life is getting better.
Conclusion
6 1 UN General Assembly (19 July 2011).
2 Helliwell et al. (2012).
3 OECD (2013).
4 The use of “subjective well-being” as the generic description was recommended by Diener et al. (2010, x-xi), reflecting a conference consensus, later adopted also by the OECD Guidelines (2013, summarized in Chapter 7), that each of the three components of SWB (life evaluations, positive affect, and negative affect) be widely and comparably collected.
5 Used in the Gallup World Poll (GWP). The GWP included the life satisfaction question on the same 0 to 10 scale on an experimental basis, giving a sample sufficiently large to show that when used with consistent samples the two questions provide mutually supportive information on the size and relative importance of the correlates, as shown in Diener et al. (2010, Table 10.1).
6 Used in the World Values Survey, the European Social Survey and many other national and international surveys. It is the core life evaluation question recommended by the OECD (2013), and in the first World Happiness Report.
7 The European Social Survey contains questions about happiness with life as a whole, and about life satisfaction, both on the same 0 to 10 numerical scale. The responses provide the scientific base to support our findings that answers to the two questions give consistent (and mutually supportive) information about the correlates of a good life.
7
References
Diener, E., Helliwell, J. F., & Kahneman, D. (Eds.). (2010). International differences in well-being. New York: Oxford University Press. doi: 10.1093/acprof:oso/9780199732739.001.0001
Helliwell, J. F., Layard, R., & Sachs, J. (Eds.). (2012). World happiness report. New York: Earth Institute.
OECD. (2013). Guidelines on measuring subjective well-being. Paris: OECD. Retrieved from http://www.oecd.org/statistics/Guidelines on Measuring Subjective Well-being.pdf
8
Chapt
er 2.
World Happines
s: Trends,
explanaTions and disTribuTion
JOHN F. HELLIWELL AND SHUN WANG
John F. Helliwell: Vancouver school of economics, university of british Columbia, and the Canadian institute for advanced research (CiFar)
9
The first World Happiness Report attracted most attention with its rankings of average life evalua-tions, especially at the national level, based on data from all available years of the Gallup World Poll, mainly 2005 to 2011.2 This year we dig deeper. First, we repeat our summary of average levels for the Cantril ladder, this year using the most recent data available, now covering 2010-12. We will also compare international differences in life evaluations with average measures of positive and negative emotions. This will set the stage for our later analysis of the happiness trends that have appeared in some countries and regions since the beginning of the Gallup World Poll in 2005.
At the same time as we present the levels, we shall also provide a breakdown of the likely reasons why life evaluations are higher in each region or country than in a hypothetical comparison country called Distopia. Distopia is faced with the world’s lowest national average values of each of six key variables that we have found to explain three-quarters of the international differences in average life evaluations: GDP per capita, years of healthy life expectancy, having someone to count on in times of trouble (sometimes referred to as “social support” in this chapter), perceptions of corruption, prevalence of generosity, and freedom to make life choices.3
After making these current comparisons based on the three most recent survey years, we then look for changes and trends in happiness in countries, regions, and for the world as a whole. Finally, we will look for differences and trends in the equality or inequality with which happiness is distributed within and among countries and regions.
As we found last year, whether we are interested in comparing levels or looking for trends, there is a necessary trade-off between sample size and the ability to identify the latest levels and trends. The Gallup World Poll, which still provides the most comparable data for a large group of countries, typically interviews 1,000 respondents per country in each survey year. We average the three most recent years (2010–12)in order to achieve a typical sample size of 3,000, thus reducing
uncertainty in the resulting estimates of country averages. In looking for possible trends, we com-pare these most recent three yearswith average values in the earliest years (2005–07)of data available for each country. In the future, when collection of data on subjective well-being (SWB) has a longer history, is based on larger samples, and has been made a part of large official surveys in many countries, as outlined in the recent OECD Guidelines for the Measurement of Subjective Well-Being,4 it will be possible to recognize and explain international and sub-national happiness changes and trends in a more timely way. But there are nonetheless some interesting findings in the data already in hand.
Throughout this chapter, we shall make primary use of the answers given by individual respondents asked to evaluate their current lives by imagining life as a ladder, with the best possible life for them as a 10, and the worst possible life as a zero. We shall then examine the average levels and distri-butions of these responses, sometimes referring to the measures as the Cantril ladder,5 and some-times as life evaluations or measures of happiness about life as a whole.
10 10
Using alternative descriptions for life evaluations and favoring life evaluations over measures of positive and negative affect follows from the analysis contained in the first World Happiness Report.There it was shown that while the three main types of life evaluation in frequent use — satisfaction with life as a whole, happiness about life as a whole, and the Cantril ladder — have different average values and distributions, they provide equivalent information about the sources of differences among individuals and nations.6 It was also shown there, and in Table 2.1 in this chapter, that life evaluations are much more fully explained by enduring life circumstances than are measures of the previous day’s positive and negative emotions. Emotional measures are nonetheless of fundamental impor-tance for experimental work, and for the analysis of daily life, as they respond to short-term events and surroundings much more than do the more stable life evaluations.7 Emotional states, especially positive ones, are nonetheless closely related to life evaluations, as we shall see in the next section.
If life evaluations are more closely determined by life circumstances than are emotions, we might also expect to find that that they line up more closely with other measures of human development, such as the United Nations Development Programme’s Human Development Index (HDI), which is the subject of Chapter 8 in this report. We find that this is indeed so, as the simple correlation between the HDI and national averages of the Cantril ladder is 0.77, several times as great as that between the HDI and measures of positive and negative affect.8
If it is true that life evaluations are more determined by the circumstances of life, and if life circum-stances are more unevenly distributed among nations than are the supports for emotions, then we would expect to find that the international distribution of life evaluations matches that of key life circumstances, while emotional states, like the personality differences that partially underlie them, might be expected to differ relatively more among individuals than among nations. The data support this expectation.
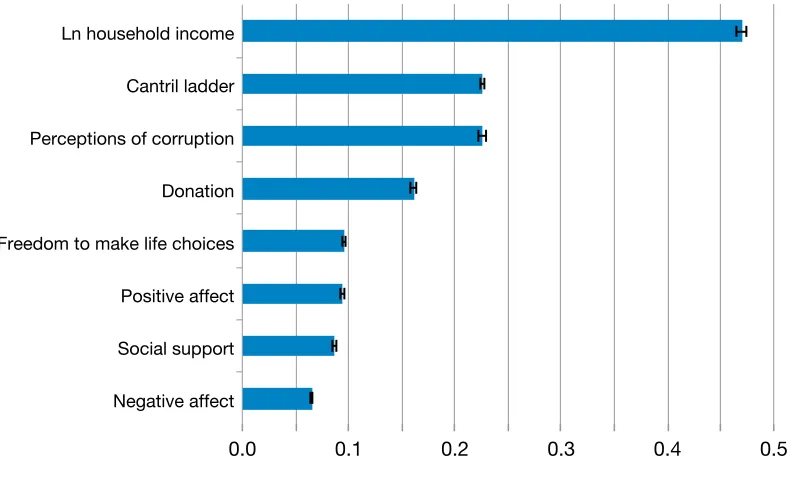
Figure 2.1 shows for each of eight variables the share of their total variation among more than 500,000 Gallup World Poll respondents in 2010 –12 that is among rather than within nations.9 The eight variables include the Cantril ladder, positive and negative affect, and five variables we use to explain international differences in our three measures of subjective well-being.10 Of all the variables, house-hold income is by far the most unevenly divided among countries, with more than half of its global variation being among countries. International differences in perceived corruption and in the Cantril ladder are next in the extent to which their global variation is among countries, followed by generosity, freedom, positive affect, and social support. The variance of negative affect is almost entirely within rather than among countries, with an international share well below 10%.
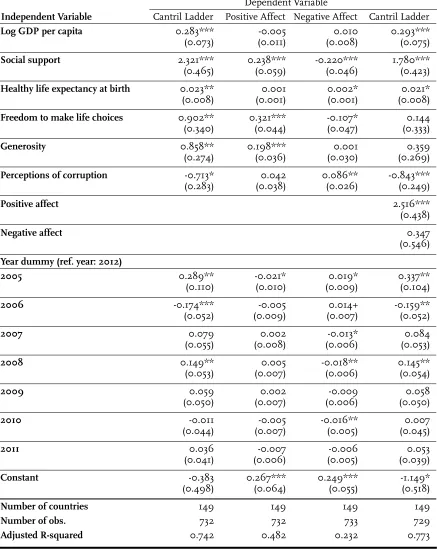
To further compare life evaluations and emotions, we use six key variables to explain international differences in the Cantril ladder, positive affect, and negative affect. These equations, as shown in Table 2.1, use a pooled sample of all available annual national average scores for each of the three measures of well-being regressed on a set of variables, similar to those used in Table 3.1 of the first World Happiness Report. These variables, which span the main range of factors previously found to be important in explaining differences in life evaluations, include the log of GDP per capita, years of healthy life expectancy, having someone to count on in times of trouble, perceptions of corruption, prevalence of generosity, and freedom to make life choices.
11
and feeling a sense of freedom to make key life choices are both strong determinants of life evaluations and emotions. Perceived corruption provides an interesting contrast, as negative affect is much worse, and life evaluations lower, where corruption is perceived to be more prevalent. But there is no link between corruption perceptions and positive affect. Generosity is also interesting, as it has a strong positive link with life evaluations and positive affect, but no relation to negative affect. This latter result is supported by recent experimental evidence that subjects who behave generously when given the chance become significantly happier, but there is no change in their level of negative affect. Their initial levels of positive and negative affect, on the other hand, do not influence significantly the likelihood of them acting generously.
The fourth column of Table 2.1 repeats the first column, but adds the national averages, in each year, of positive and negative affect. Positive affect enters the equation strongly, but negative affect does not. Positive affect is itself strongly connected to generosity, freedom, and social support, as shown in column 2 of Table 2.1, and the addition of positive affect to the life evaluation equation in column 4 suggests that some substantial part of the impact from those variables to life evaluations flows through positive affect.
Partly because of their more robust connections with the established supports for better lives, life evaluations remain the primary statistic for mea-suring and explaining international differences and trends in subjective well-being. Although life satisfaction, happiness with life as a whole, and the Cantril ladder all tell similar stories about the sources of a good life, we shall concentrate here on the Cantril ladder, since it is the only life evaluation in continuous use in the Gallup World Poll, and the latter provides by far the widest and most regular country coverage. An online data ap-pendix provides comparable data for positive and negative affect.
Global and regional Happiness
levels and explanations
Figure 2.2 shows life evaluation averages for each of 10 regional groupings13 of countries, as well as for the world as a whole, based on data for the years 2010-12. For this figure, the levels and the 95% confidence bounds (shown by a horizontal line at the right-hand side of each bar) are based on all the individual-level observations available for each country in the survey, weighted by total population in each country.14 This population-weighting is done so that the regional averages, like the national averages to be presented later, represent the best estimate of the level and changes of the ladder scores for the entire population. The results for the world as a whole are similarly weighted by population in each country, just as was done in Figure 2.1 in the first World Happiness Report.
Figure 2.2 shows not only the average ladder scores for the world, and for each of 10 regional groupings, but also attempts to explain why average ladder scores are so much higher in some regions than in others. To do this, we make use of the coefficients found in the first column of Table 2.1. The length of each sub-bar in Figure 2.2 shows how much better life is for having a higher value of that variable than in Distopia. Distopia is a fictional country that has the world’s lowest national average value (for the years 2010-12) for each of the six key variables used in Table 2.1. We calculate 2010–12 happiness in Distopia to have been 1.98 on the 10-point scale, less than one-half of the average score in any of the country groupings.15
12
values for their error terms since the country rankings are based on the actual survey results, and not on what the model predicts. It is somewhat reassuring that even for the top-ranked and bottom-ranked countries and regions, most of the differences between their scores and those in Distopia are explained by having values of at least most variables that are better than those in Distopia. No country has the world’s lowest values for more than one of the six variables, and this is why actual national scores in all countries, and of course in all regions, are well above the calculated ladder score in Distopia.
The second segment in each regional bar is the amount by which the regional ladder score exceeds that in Distopia by dint of having average per capita incomes higher than those in the poorest country in the world. To take a particular example, GDP per capita in the richest region is over 16 times higher than in the poorest of the 10 regions. This difference in GDP per capita between the richest and poorest regions translates into an average life evaluation difference of 0.80 points on the 10-point range of the scale.17 Similarly, the fraction of the population reporting having someone to count on is 0.93 in the top region compared to 0.56 in the region with the lowest average social support. This interregional difference translates into a 0.86 difference in ladder averages.18 The corresponding ladder differentials between the top region and the region with the lowest national average for that variable are 0.20 for perceived absence of corruption,19 0.66 for the 28-year life expectancy difference between the top (Western Europe) and bottom (Sub-Saharan Africa) regions,20 0.46 for generosity differences (adjusted for income levels) between the most and least generous regions,21 and 0.26 for freedom to make life choices.22 Thus there are substantial regional differences in each of the six variables used in Table 2.1 to explain international differences in ladder scores, with correspondingly large effects on average happiness.
13
Figure 2.2 shows that there are large inter-regional differences in average ladder scores, which range from 4.6 to over 7.1. The explanations, as revealed by the width of the individual bars, show that all factors contribute to the explanation, but the amounts explained by each factor differ by region. For example, while Sub-Saharan Africa has the lowest average ladder score, corruption is seen as a smaller problem there than in the Commonwealth of Independent States (CIS), Central and Eastern Europe, and South-East Asia. Similarly, a higher fraction of respondents have someone to count on in Sub-Saharan Africa than in either South Asia or the Middle East and North Africa (MENA). Generosity, even before adjusting for income differences, is higher in Sub-Saharan Africa than in three regions— the CIS, East Asia, and MENA. After adjusting for income differences, Sub-Saharan generosity is also higher than in Latin America and the Caribbean, and Central and Eastern Europe. And the sense of freedom to make key life decisions is higher in Sub-Saharan Africa than in either the CIS or MENA. In fact, only for the two traditional development measures — GDP per capita and years of healthy life expectancy — are the average values lowest in Sub-Saharan Africa.
However, as might be expected, each region contains a wide variety of individual and country experiences. Having now illustrated how our explanatory framework operates, we turn in the next section to use it to explain the much greater differences that appear at the national level.
n
ational Happiness levels and
explanations
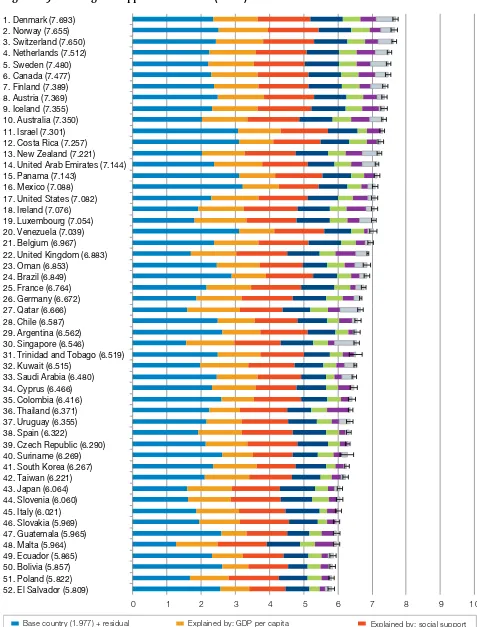
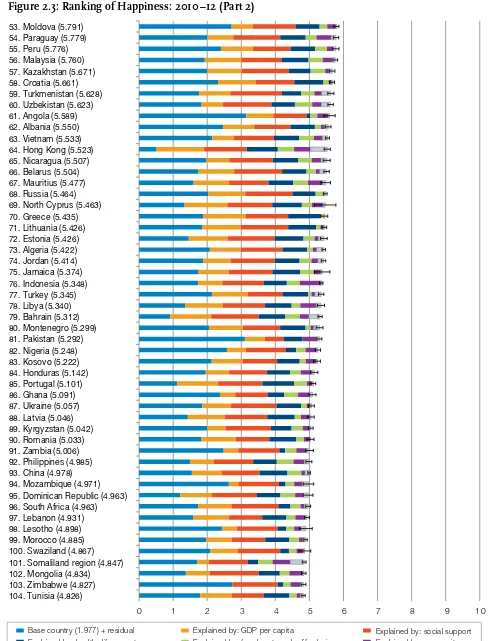
In this section, we first present in Figure 2.3 the 2010–12 national averages for life evaluations, with each country’s average score divided into seven pieces.25 The overall ladder rankings differ from those in Figure 2.3 of the first World Happiness Report. First, they include more up-to-date data, with the ending point of the new data coverage moving forward from mid-2011 to the
end of 2012. Second, in last year’s report we averaged all available data, running from 2005 until mid-2011, while this year we present averages for the three years 2010-12, giving a sample size of 3,000 for most countries.26 We focus on the more recent data for two reasons. First, we expect that readers want the data presented in our key tables to be as current as possible, consistent with having sample sizes large enough to avoid too many ranking changes due to sampling fluctuations. Second, we want to be able to look for changes through time in the average happiness levels for countries, regions, and the world as a whole.
The three panels of Figure 2.3 divide the 156 countries into three groups. The top five countries are Denmark, Norway, Switzerland, Netherlands, and Sweden, and the bottom five are Rwanda, Burundi, Central African Republic, Benin, and Togo. The gap between the top and the bottom is quite large: the average Cantril ladder in the top five countries is 7.48, which is over 2.5 times the 2.94 average ladder in the bottom five countries.
14
Global and regional Happiness
Trends
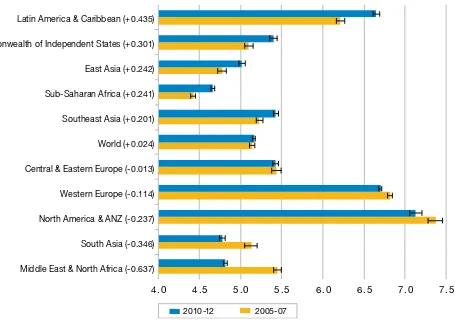
On average, on a global and regional basis, as shown in Figure 2.4, there has been some evidence of convergence of Cantril ladder scores between 2007 and 2012. There have been significant increases for Latin America and the Caribbean (+7.0%), the CIS (+5.9%), Sub-Saharan Africa (+5.4%), and East Asia (+5.1%),28 up to almost half a point on the zero to 10 scale of the Cantril ladder. There were significant declines in four regions: the Middle East and North Africa (-11.7%), South Asia (-6.8%), the group of four miscellaneous industrial countries (United States, Canada, Australia and New Zealand, -3.2%), and Western Europe (-1.7%). In Central and Eastern Europe there was no significant change in the regional average, but here too, as in the other regions, there were offsetting increases and decreases. For the world as a whole, there was an insignificant 0.5% increase.
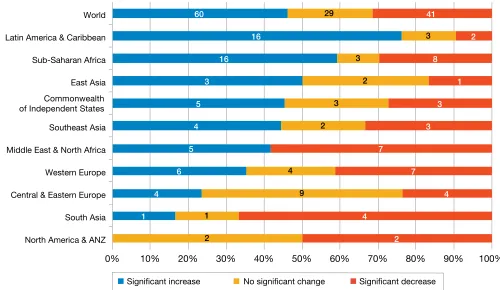
Figure 2.5 gives some idea of the variety of trend experiences within each region, for the 130 countries with adequate sample size at both the beginning and the end of the 2005–07 to 2010–12 period. It shows the percentages of countries in which life evaluations have grown significantly (in yellow), not changed by a significant amount (in blue), or fallen significantly (in red). The number of countries within each group is shown by numerals within each box. Overall, more countries have had significant increases (60) than decreases (41) in average life evaluations between 2005-07 and 2010-12, with a smaller group (29) showing no significant trend.
On a regional basis, by far the largest gains in life evaluations, in terms of the prevalence and size of the increases, have been in Latin America and the Caribbean, and in Sub-Saharan Africa. In Latin America and the Caribbean, more than three-quarters of all countries showed significant increases in average happiness, with a population-weighted average increase amounting to 7.0% of the 2005-07 value.29 In Sub-Saharan Africa, 16 of
the 27 countries covered by the surveys showed significant increases in life evaluations, and taking all of Sub-Saharan Africa together the average increase was over 5%.30 On the other hand, there have been significant decreases in two-thirds of the countries in South Asia. On average, there have been significant reductions in ladder scores in Western Europe, while average evaluations in Central and Eastern Europe were almost unchanged, as shown in Figure 2.4. The diversity of the Western European experiences is apparent. Six of the 17 countries had significant increases, while seven countries had significant decreases, the largest of which were in four countries badly hit by the Eurozone financial crisis- Portugal, Italy, Spain and Greece. In Central and Eastern Europe, there were significant increases in four transition countries showing upward convergence to European averages, balanced by four others with significant decreases. We turn to the country data for our more detailed analysis, recognizing that the increase in focus is matched by a reduction in sample size.
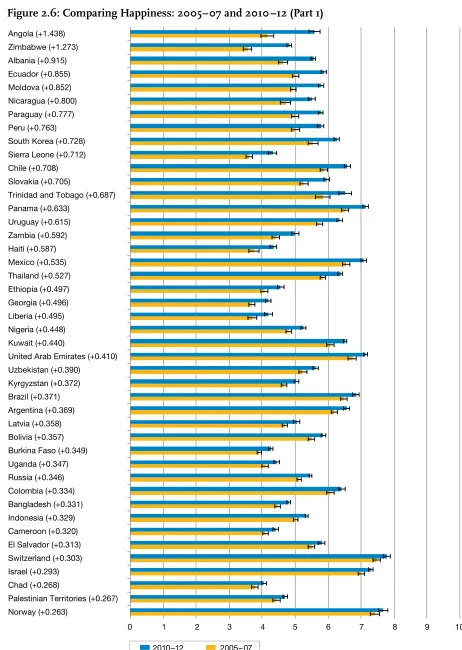
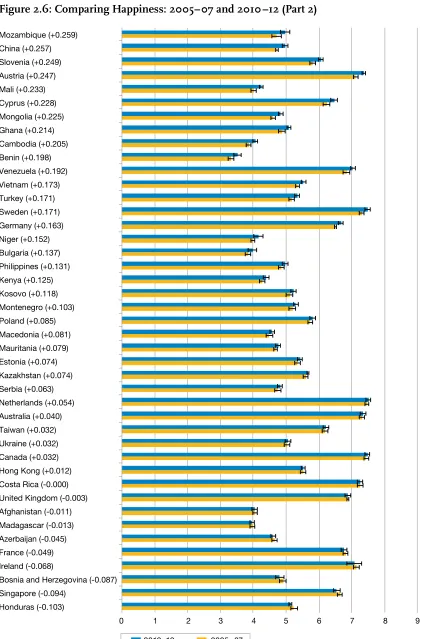
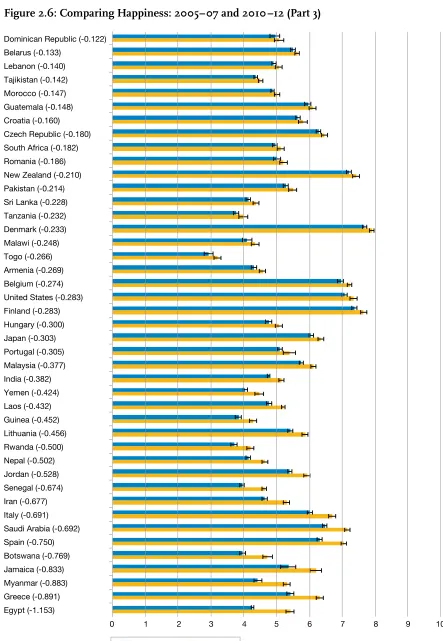
national Happiness Trends
Figure 2.6 compares the 2005–07 and 2010–12 average ladder scores for each country, ranked by the size of their increases from the first period to the second. The horizontal lines at the end of each bar show the 95% confidence regions for the estimate, making it relatively easy to see which of the changes are significant. Because not all countries have surveys at both ends of the comparison period, this restricts to 130 the number of countries shown in Figure 2.6.
15
none in Western Europe or elsewhere among the industrial countries, or in the Middle East and North Africa.
Of the 13 countries with average declines of 0.5 or more, there were four from the Middle East and North Africa, three from Sub-Saharan Africa, two from Asia, three from Western Europe, and only one from Latin America and the Caribbean.
r
easons for Happiness Changes
The various panels of Figure 2.7 show, for the world as a whole and for each of the 10 regions separately, the underlying changes in the material and social supports for well-being. Population weights are used, thereby representing regional populations as a whole, by giving more weight to the survey responses in the more populous coun-tries in each region. As shown in Figure 2.7.1,32 GDP per capita has increased in almost every region except the group of four miscellaneous industrial countries (United States, Canada, Australia and New Zealand), with the absolute increases being greatest in East Asia, Central and Eastern Europe, the CIS, and Latin America, and proportionate increases the largest in South Asia, which is mainly caused by India.
By contrast, the fraction of respondents having someone to count on was lower in most regions, and for the world as a whole. Social support was significantly up in Sub-Saharan Africa, Southeast Asia and the CIS, and generally lower everywhere else, including for the world as a whole, with the reductions greatest in South Asia and in the Middle East and North Africa. The European Social Survey (ESS) has a broad range of questions relating to trust, and research suggests that social trust is a strong determinant of life evaluations. Furthermore, although trust levels remain much lower in the transition countries than in Western Europe, they have been converging, and have been more important than income in explaining why life evaluations have been rising since the economic crisis.33
Perceptions of corruption were significantly improved (i.e. lower) in Latin America, Western Europe and East Asia, and higher (worse) in NANZ, MENA and Sub-Saharan Africa. The prevalence of generosity, which here is not adjusted for differences in income levels, grew significantly throughout Asia, Central and Eastern Europe and the CIS, and for the world as a whole, while being significantly reduced in Sub-Saharan Africa, Western Europe, Latin America and MENA. Perceived freedom to make life choices grew significantly in Sub-Saharan Africa, Southeast Asia, and Latin America, and shrank significantly in South Asia, NANZ and MENA. Among individual countries, as already shown in the panels of Figure 2.3, there is an even greater variety of experiences, and of underlying rea-sons.
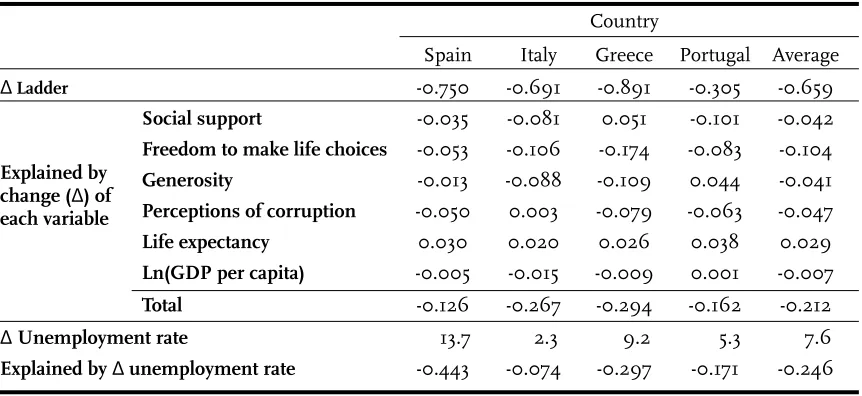
We pay special attention here to the four Western European countries worst hit by the Eurozone crisis, since they provide scope for examining how large economic changes play out in subjective well-being, especially when they are accompanied by damage to a country’s social and institutional fabric. Table 2.2 shows for each of the four countries worst affected (in terms of lower average life evaluations) by the Eurozone crisis, the average size of the reductions in average happiness,34 the extent to which these decreases were explained by change in the variables included in the equation of Table 2.1, and estimates of how much of the remaining drop can be explained by the rising unemployment rates in each country.
16
incomes. If per-capita GDP were pushed 10% below what might otherwise have happened without the crisis, the estimated loss in average subjective well-being would have been less than .04, which is less than one-tenth of the average drop in the four countries. As Table 2.2 shows, GDP per capita in three of the four countries actually fell, though not by as much as the 10% assumed above. The other five key factors in the Table 2.1 equation showed improvement in some countries and deterioration elsewhere, on average contributing to explaining the average decline. Healthy life expectancy was calculated to have continued to grow and improve subjective well-being, but all other factors generally moved in the other direction. The biggest hit, in terms of the implied drop in life evaluations, was in respondents’ perceived freedom to make key life choices. In each country the crisis tended to limit opportunities for individuals, both through cutbacks in available services and loss of expected opportunities. In the three of the four countries there were also increases in perceived corruption in business and government. Social support and generosity also each fell in three of the four countries. Assembling the partial explanations from each of the six factors still left most of the well-being drop to be explained.
The most obvious candidate to consider is unem-ployment, which grew significantly in each country, and has been shown to have large effects on the happiness of the unemployed themselves, and also on those who remain employed, but who either may be close to those who are unemployed, or may face possible future unemployment. Because of the lack of sufficiently widespread and compa-rable data for national unemployment rates, unemployment does not appear among the six factors captured in Table 2.1. For now, we can fill this gap by using OECD data for national unem-ployment rates to explain, for OECD countries, the remaining differences in life evaluations not explained by the model of Table 2.1.36 Our best estimate from this procedure is that each percentage point increase in the national unemployment rate will lower average subjective well-being by .033 points on the 10-point scale.37 This is several
times more than would flow from the large and well-established non-pecuniary effects on each unemployed person, because it combines these effects with the smaller but more widespread effects on those who are still employed, or are not in the labor force. Although large, this estimate is very similar to that obtained from US data,38 and smaller than that implied by previous research for Europe39 and for Latin America.40 Thus we are fairly confident that we are not overstating the likely well-being effects of the higher unemploy-ment rates in the four countries.
17
Greece stands out from the other countries in having the largest changes in life evaluations and affect measures, beyond what can be explained by average responses to the economic crisis. Research has shown that economic and other crises are more easily weathered and indeed provide the scope for cooperative actions that improve subjective well-being, if trust levels and other aspects of the social and institutional fabric are sufficiently high and well-maintained when the crisis hits.43 The European Social Survey (ESS) can provide useful evidence on this score, as it covers all four countries, and has two life evaluations and several trust measures. The ESS life evaluations, both for life satisfaction and happiness with life as a whole, mirror the Gallup World Poll in showing well-being losses that are greater in Greece than in the other countries.44 The ESS trust data provide some insight into the reasons for this. Although generalized social trust is maintained roughly at pre-crisis levels, trust in police and in the legal system fall much more in Greece. Trust in police stayed stable at pre-crisis levels, or even grew slightly, in Spain and Portugal, while falling by 25% in Greece. Trust in the legal system fell significantly in all three countries, but by almost three times as much in Greece as in the other countries. Because trust measures have been shown to be strong supports for subjective well-being,45 this erosion of some key elements of institutional trust thus helps to explain the exceptionally large well-being losses in Greece.
How equal is the distribution of
Happiness, and is it Changing?
In the first World Happiness Report, we emphasized that while average happiness levels in countries and regions are very important, it is equally important to track how happiness is distributed among individuals and groups. There has been much attention paid to measuring the levels and trends of income inequality, and concern over the increases in income inequality that have marked the recent economic history of many countries.46
There have also been attempts to assess the empirical links between income inequality and average happiness in nations.47 In general, the results of this research have been mixed. It is time to pay more attention to the distribution of happiness itself.
All of the data presented thus far in this chapter have been based on national and regional averages. Our analysis of the distribution of average happiness among countries and regions showed some evidence of global convergence, with the growth of happiness being generally higher in Sub-Saharan Africa, the region with the lowest average level. We now turn to consider inequality among individuals within regions. Figure 2.8 shows two measures of the inequality, and their 95% confidence intervals, of the distribution of ladder scores among individuals in each of the 10 regions, and for the world as a whole.48 The first measure includes 2005–2007, and the second covers the most recent period, 2010 –2012. To make the analysis reflect the population of each region, and of the world as a whole, we use population weights to combine the individual observations to form regional and global totals.
Looking at the inequality of happiness measures for 2010–12, we see that inequality is highest in MENA, Sub-Saharan Africa, and South Asia. It is lowest in Western Europe and NANZ. The world measure, which takes both inter-regional and intra-regional differences into account, is higher than in most regions taken separately, about equal to that for South Asia.
18
s
ummary and Conclusions
This chapter has presented data by country and region, and for the world as a whole, showing the levels, explanations, changes and equality of hap-piness, mainly based on life evaluations from the Gallup World Poll. Despite the obvious happiness impacts of the financial crisis of 2007-08, the world has become a slightly happier and more generous place over the past five years. Because of continuing growth in most supports for better lives in Sub-Saharan Africa, and of continued convergence in the quality of the social fabric within greater Europe, there has also been some progress toward equality in the regional distribu-tion of well-being.
There have been important regional cross-cur-rents within this broader picture. Improvements in the quality of life have been particularly preva-lent in Latin America and the Caribbean, while reductions have been the norm in the regions most affected by the financial crisis, Western Eu-rope and other western industrial countries, or by some combination of financial crisis and political and social instability, as in the Middle East and North Africa. Analysis of life evaluations in the four Western European countries most affected by the Eurozone crisis showed the happiness effects to be even larger than would be expected from their income losses and large increases in unemployment.
Other cross-currents were revealed also in South Asia, where there was a significant drop in aver-age life evaluations. The positive contributions from continuing economic growth and greater generosity were more than offset by the effects of declining social support, and of less perceived freedom to make life choices. Inequality in the distribution of happiness also grew significantly within South Asia.
In summary, the global picture has many strands, and the slow-moving global averages mask a variety of substantial changes. Lives have been improving significantly in Latin America
and the Caribbean, and in Sub-Saharan Africa; worsening in the Middle East and North Africa; dropping slightly in the western industrial world, and very sharply in the countries most affected by the Eurozone crisis. As between the two halves of Europe, the convergence of quality of life, in its economic, institutional and social dimensions, continues, if slowly. Within each of these broad regions, many complexities were evident, and others remain to emerge or to be noticed.
19
Dependent Variable
Independent Variable Cantril Ladder Positive Affect Negative Affect Cantril Ladder
Log GDP per capita 0.283*** -0.005 0.010 0.293***
(0.073) (0.011) (0.008) (0.075)
Social support 2.321*** 0.238*** -0.220*** 1.780***
(0.465) (0.059) (0.046) (0.423)
Healthy life expectancy at birth 0.023** 0.001 0.002* 0.021*
(0.008) (0.001) (0.001) (0.008)
Freedom to make life choices 0.902** 0.321*** -0.107* 0.144
(0.340) (0.044) (0.047) (0.333)
Generosity 0.858** 0.198*** 0.001 0.359
(0.274) (0.036) (0.030) (0.269)
Perceptions of corruption -0.713* 0.042 0.086** -0.843***
(0.283) (0.038) (0.026) (0.249)
Positive affect 2.516***
(0.438)
Negative affect 0.347
(0.546)
Year dummy (ref. year: 2012)
2005 0.289** -0.021* 0.019* 0.337**
(0.110) (0.010) (0.009) (0.104)
2006 -0.174*** -0.005 0.014+ -0.159**
(0.052) (0.009) (0.007) (0.052)
2007 0.079 0.002 -0.013* 0.084
(0.055) (0.008) (0.006) (0.053)
2008 0.149** 0.005 -0.018** 0.145**
(0.053) (0.007) (0.006) (0.054)
2009 0.059 0.002 -0.009 0.058
(0.050) (0.007) (0.006) (0.050)
2010 -0.011 -0.005 -0.016** 0.007
(0.044) (0.007) (0.005) (0.045)
2011 0.036 -0.007 -0.006 0.053
(0.041) (0.006) (0.005) (0.039)
Constant -0.383 0.267*** 0.249*** -1.149*
(0.498) (0.064) (0.055) (0.518)
Number of countries 149 149 149 149
Number of obs. 732 732 733 729
Adjusted R-squared 0.742 0.482 0.232 0.773
20 data on healthy life expectancy at birth is only available in 2007 from World Health Organization (WHO), but life
expectancy at birth is available for all years from World Development Indicators. We adopt the following strategy to construct healthy life expectancy at birth for other country-years: first we generate the ratio of healthy life expectancy to life expectancy in 2007 for countries with both data, and assign countries with missing data the ratio of world average of healthy life expectancy over life expectancy; then we apply the ratio to other years (i.e. 2005, 2006, and 2008-12) to generate the healthy life expectancy data. Social support (or having someone to count on in times of trouble) is the national average of the binary responses (either 0 or 1) to the question “If you were in trouble, do you have relatives or friends you can count on to help you whenever you need them, or not?” Freedom to make life choices is the national average of responses to the question “Are you satisfied or dissatisfied with your freedom to choose what you do with your life?” Generosity is the residual of regressing national average of response to the question “Have you donated money to a charity in the past month?” on GDP per capita. Perceptions of corruption are the average of answers to two questions: “Is corruption widespread throughout the government or not” and “Is corruption widespread within businesses or not?” Coefficients are reported with robust standard errors clustered by country in parentheses. ***, **, * and + indicate significance at the 0.1, 1, 5 and 10% levels respectively.
Country
Spain Italy Greece Portugal Average
ΔLadder -0.750 -0.691 -0.891 -0.305 -0.659
Explained by change (Δ) of each variable
Social support -0.035 -0.081 0.051 -0.101 -0.042
Freedom to make life choices -0.053 -0.106 -0.174 -0.083 -0.104
Generosity -0.013 -0.088 -0.109 0.044 -0.041
Perceptions of corruption -0.050 0.003 -0.079 -0.063 -0.047
Life expectancy 0.030 0.020 0.026 0.038 0.029
Ln(GDP per capita) -0.005 -0.015 -0.009 0.001 -0.007
Total -0.126 -0.267 -0.294 -0.162 -0.212
Δ Unemployment rate 13.7 2.3 9.2 5.3 7.6
Explained by Δunemployment rate -0.443 -0.074 -0.297 -0.171 -0.246
Country
Spain Italy Greece Portugal Average
2005-07 – 2010-12 ΔPositive Affect -0.033 -0.056 -0.113 0.023 -0.045
ΔNegative Affect 0.096 -0.003 0.079 -0.025 0.037
ΔLadder Ranking -16 -17 -28 -12 -18
ΔPositive Affect Ranking -1 -5 -16 6 -4
ΔNegative Affect Ranking -15 -6 -34 10 -11
Table 2.2: Sources of Lower Life Evaluations in Four Hard-Hit Eurozone Countries
Table 2.3: Dynamics of Emotions and Life Evaluations in Four Hard-Hit Eurozone Countries
21
0.0 0.1 0.2 0.3 0.4 0.5
Negative affect Social support Positive affect Freedom to make life choices Donation Perceptions of corruption Cantril ladder Ln household income
Figure 2.1: International Shares of Variance: 2010 –12
0 1 2 3 4 5 6 7 8 9 10
Sub-Saharan Africa (4.626) South Asia (4.782) Middle East & North Africa (4.841) East Asia (5.017) Commonwealth of Independent States (5.403) Central and Eastern Europe (5.425) Southeast Asia (5.430) Latin America & Caribbean (6.652) Western Europe (6.703) North America & ANZ (7.133) World (5.158)
Base country (1.977) + residual Explained by: GDP per capita Explained by: social support Explained by: healthy life expectancy Explained by: freedom to make
life choices
Explained by: generosity Explained by: perceptions of corruption
22 22
0 1 2 3 4 5 6 7 8 9 1 0
52. El Salvador (5.809) 51. Poland (5.822) 50. Bolivia (5.857) 49. Ecuador (5.865) 48. Malta (5.964) 47. Guatemala (5.965) 46. Slovakia (5.969) 45. Italy (6.021) 44. Slovenia (6.060) 43. Japan (6.064) 42. Taiwan (6.221) 41. South Korea (6.267) 40. Suriname (6.269) 39. Czech Republic (6.290) 38. Spain (6.322)
37. Uruguay (6.355) 36. Thailand (6.371) 35. Colombia (6.416) 34. Cyprus (6.466) 33. Saudi Arabia (6.480) 32. Kuwait (6.515)
31. Trinidad and Tobago (6.519) 30. Singapore (6.546)
29. Argentina (6.562) 28. Chile (6.587) 27. Qatar (6.666) 26. Germany (6.672) 25. France (6.764) 24. Brazil (6.849) 23. Oman (6.853)
22. United Kingdom (6.883) 21. Belgium (6.967) 20. Venezuela (7.039) 19. Luxembourg (7.054) 18. Ireland (7.076) 17. United States (7.082) 16. Mexico (7.088) 15. Panama (7.143)
14. United Arab Emirates (7.144) 13. New Zealand (7.221) 12. Costa Rica (7.257) 11. Israel (7.301) 10. Australia (7.350) 9. Iceland (7.355) 8. Austria (7.369) 7. Finland (7.389) 6. Canada (7.477) 5. Sweden (7.480) 4. Netherlands (7.512) 3. Switzerland (7.650) 2. Norway (7.655) 1. Denmark (7.693)
Base country (1.977) + residual Explained by: GDP per capita Explained by: social support Explained by: healthy life expectancy Explained by: freedom to make life choices Explained by: generosity Explained by: perceptions of corruption
23
104. Tunisia (4.826) 103. Zimbabwe (4.827) 102. Mongolia (4.834) 100. Swaziland (4.867) 99. Morocco (4.885) 98. Lesotho (4.898) 97. Lebanon (4.931) 96. South Africa (4.963) 94. Mozambique (4.971) 93. China (4.978) 92. Philippines (4.985) 91. Zambia (5.006) 90. Romania (5.033) 89. Kyrgyzstan (5.042) 88. Latvia (5.046) 87. Ukraine (5.057) 86. Ghana (5.091) 85. Portugal (5.101) 84. Honduras (5.142) 83. Kosovo (5.222) 82. Nigeria (5.248) 81. Pakistan (5.292) 80. Montenegro (5.299) 79. Bahrain (5.312) 78. Libya (5.340) 77. Turkey (5.345) 76. Indonesia (5.348) 75. Jamaica (5.374) 74. Jordan (5.414) 73. Algeria (5.422) 72. Estonia (5.426) 71. Lithuania (5.426) 70. Greece (5.435) 69. North Cyprus (5.463) 68. Russia (5.464) 67. Mauritius (5.477) 66. Belarus (5.504) 65. Nicaragua (5.507) 64. Hong Kong (5.523) 63. Vietnam (5.533) 62. Albania (5.550) 61. Angola (5.589) 60. Uzbekistan (5.623) 59. Turkmenistan (5.628) 58. Croatia (5.661) 57. Kazakhstan (5.671) 56. Malaysia (5.760) 55. Peru (5.776) 54. Paraguay (5.779) 53. Moldova (5.791)
101. Somaliland region (4.847) 95. Dominican Republic (4.963)
0 1 2 3 4 5 6 7 8 9 1 0
Base country (1.977) + residual Explained by: GDP per capita Explained by: social support Explained by: healthy life expectancy Explained by: freedom to make life choices Explained by: generosity Explained by: perceptions of corruption
24 24
0 1 2 3 4 5 6 7 8 9 1 0
156. Togo (2.936) 155. Benin (3.528)
154. Central African Republic (3.623) 153. Burundi (3.706)
152. Rwanda (3.715) 151. Tanzania (3.770) 150. Guinea (3.847) 149. Comoros (3.851) 148. Syria (3.892) 147. Senegal (3.959) 146. Madagascar (3.966) 145. Botswana (3.970) 144. Bulgaria (3.981) 143. Afghanistan (4.040) 142. Yemen (4.054) 141. Chad (4.056) 140. Cambodia (4.067) 139. Malawi (4.113) 138. Gabon (4.114) 137. Sri Lanka (4.151) 136. Niger (4.152) 135. Nepal (4.156) 134. Georgia (4.187) 133. Liberia (4.196) 132. Mali (4.247)
131. Burkina Faso (4.259) 130. Egypt (4.273)
129. Congo (Brazzaville) (4.297) 128. Armenia (4.316)
127. Sierra Leone (4.318) 126. Haiti (4.341) 125. Tajikistan (4.380) 124. Sudan (4.401) 123. Kenya (4.403) 122. Cameroon (4.420) 121. Myanmar (4.439) 120. Uganda (4.443) 119. Ethiopia (4.561) 118. Macedonia (4.574) 117. Congo (Kinshasa) (4.578) 116. Azerbaijan (4.604) 115. Iran (4.643) 114. Djibouti (4.690)
113. Palestinian Territories (4.700) 112. Mauritania (4.758)
111. India (4.772) 110. Hungary (4.775) 109. Laos (4.787) 108. Bangladesh (4.804)
107. Bosnia and Herzegovina (4.813) 106. Serbia (4.813)
105. Iraq (4.817)
Base country (1.977) + residual Explained by: GDP per capita Explained by: social support Explained by: healthy life expectancy Explained by: freedom to make life choices Explained by: generosity Explained by: perceptions of corruption
25
4.0 4.5 5.0 5.5 6.0 6.5 7.0 7.5
Middle East & North Africa (-0.637) South Asia (-0.346) North America & ANZ (-0.237) Western Europe (-0.114) Central & Eastern Europe (-0.013) World (+0.024) Southeast Asia (+0.201) Sub-Saharan Africa (+0.241) East Asia (+0.242) Commonwealth of Independent States (+0.301) Latin America & Caribbean (+0.435)
2010-12 2005-07
26 26
1 4
6 5
4 5
3 16
16 60
2 1
9 4
2 3
2 3
3 29
2 4
4 7 7
3 3
1 8
2 41
0% 10% 20% 30% 40% 50% 60% 70% 80% 90% 100%
North America & ANZ South Asia Central & Eastern Europe Western Europe Middle East & North Africa Southeast Asia Commonwealth of Independent States East Asia Sub-Saharan Africa Latin America & Caribbean World
Significant increase No significant change Significant decrease
27
0 1 2 3 4 5 6 7 8 9 10
Norway (+0.263)
Palestinian Territories (+0.267) Chad (+0.268)
Israel (+0.293) Switzerland (+0.303) El Salvador (+0.313) Cameroon (+0.320) Indonesia (+0.329) Bangladesh (+0.331) Colombia (+0.334) Russia (+0.346) Uganda (+0.347) Burkina Faso (+0.349) Bolivia (+0.357) Latvia (+0.358) Argentina (+0.369) Brazil (+0.371) Kyrgyzstan (+0.372) Uzbekistan (+0.390)
United Arab Emirates (+0.410) Kuwait (+0.440)
Nigeria (+0.448) Liberia (+0.495) Georgia (+0.496) Ethiopia (+0.497) Thailand (+0.527) Mexico (+0.535) Haiti (+0.587) Zambia (+0.592) Uruguay (+0.615) Panama (+0.633)
Trinidad and Tobago (+0.687) Slovakia (+0.705)
Chile (+0.708) Sierra Leone (+0.712) South Korea (+0.728) Peru (+0.763) Paraguay (+0.777) Nicaragua (+0.800) Moldova (+0.852) Ecuador (+0.855) Albania (+0.915) Zimbabwe (+1.273) Angola (+1.438)
2010–12 2005–07
28 28
0 1 2 3 4 5 6 7 8 9 10
Honduras (-0.103) Singapore (-0.094)
Bosnia and Herzegovina (-0.087) Ireland (-0.068)
France (-0.049) Azerbaijan (-0.045) Madagascar (-0.013) Afghanistan (-0.011) United Kingdom (-0.003) Costa Rica (-0.000) Hong Kong (+0.012) Canada (+0.032) Ukraine (+0.032) Taiwan (+0.032) Australia (+0.040) Netherlands (+0.054) Serbia (+0.063) Kazakhstan (+0.074) Estonia (+0.074) Mauritania (+0.079) Macedonia (+0.081) Poland (+0.085) Montenegro (+0.103) Kosovo (+0.118) Kenya (+0.125) Philippines (+0.131) Bulgaria (+0.137) Niger (+0.152) Germany (+0.163) Sweden (+0.171) Turkey (+0.171) Vietnam (+0.173) Venezuela (+0.192) Benin (+0.198) Cambodia (+0.205) Ghana (+0.214) Mongolia (+0.225) Cyprus (+0.228) Mali (+0.233) Austria (+0.247) Slovenia (+0.249) China (+0.257) Mozambique (+0.259)
2010–12 2005–07
29
Egypt (-1.153) Greece (-0.891) Myanmar (-0.883) Jamaica (-0.833) Botswana (-0.769) Spain (-0.750) Saudi Arabia (-0.692) Italy (-0.691) Iran (-0.677) Senegal (-0.674) Jordan (-0.528) Nepal (-0.502) Rwanda (-0.500) Lithuania (-0.456) Guinea (-0.452) Laos (-0.432) Yemen (-0.424) India (-0.382) Malaysia (-0.377) Portugal (-0.305) Japan (-0.303) Hungary (-0.300) Finland (-0.283) United States (-0.283) Belgium (-0.274) Armenia (-0.269) Togo (-0.266) Malawi (-0.248) Denmark (-0.233) Tanzania (-0.232) Sri Lanka (-0.228) Pakistan (-0.214) New Zealand (-0.210) Romania (-0.186) South Africa (-0.182) Czech Republic (-0.180) Croatia (-0.160) Guatemala (-0.148) Morocco (-0.147) Tajikistan (-0.142) Lebanon (-0.140) Belarus (-0.133)
Dominican Republic (-0.122)
0 1 2 3 4 5 6 7 8 9 10
2010–12 2005–07
30 30
$1,000 $2,700 $7,290 $19,683 $53,144
North America & ANZ (-345) Western Europe (207) Sub-Saharan Africa (288) South Asia (696) Southeast Asia (835) Middle East & North Africa (928) World (1,002) Latin America & Caribbean (1,205) Commonwealth of Independent States (1,653) Central and Eastern Europe (2,096) East Asia (2,355)
2010–12 2005–07
0.5 0.6 0.7 0.8 0.9 1.0
South Asia (-0.063) Middle East & North Africa (-0.060) World (-0.050) North America & ANZ (-0.042) Latin America & Caribbean (-0.020) Western Europe (-0.013) Central & Eastern Europe (-0.010) East Asia (-0.000) Commonwealth of Independent States (+0.014) Southeast Asia (+0.017) Sub-Saharan Africa (+0.031)
2010–12 2005–07
Figure 2.7.1: Population-Weighted GDP Per Capita by Regions: 2005–07 and 2010 –12
31
0.5 0.6 0.7 0.8 0.9 1.0
North America & ANZ (+0.055) Middle East & North Africa (+0.018) Sub-Saharan Africa (+0.016) World (+0.009) Commonwealth of Independent States (+0.006) Southeast Asia (+0.002) South Asia (-0.005) Central & Eastern Europe (-0.009) East Asia (-0.021) Western Europe (-0.039) Latin America & Caribbean (-0.058)
2010–12 2005–07
0.0 0.1 0.2 0.3 0.4 0.5 0.6 0.7 0.8 0.9 1.0
Middle East & North Africa (-0.074) Western Europe (-0.065) Latin America & Caribbean (-0.027) Sub-Saharan Africa (-0.022) North America & ANZ (+0.013) World (+0.025) Commonwealth of Independent States (+0.026) East Asia (+0.028) Central & Eastern Europe (+0.031) Southeast Asia (+0.035) South Asia (+0.079)
2010–12 2005–07
Figure 2.7.3: Perceptions of Corruption by Regions: 2005–07 and 2010 –12
32 32
0.5 0.6 0.7 0.8 0.9 1.0
Middle East & North Africa (-0.061) North America & ANZ (-0.045) South Asia (-0.026) Central & Eastern Europe (-0.015) Western Europe (-0.010) Commonwealth of Independent States (-0.003) World (+0.011) East Asia (+0.015) Latin America & Caribbean (+0.027) Southeast Asia (+0.050) Sub-Saharan Africa (+0.053)
2010–12 2005–07
0.00 0.05 0.10 0.15 0.20 0.25 0.30
South Asia (+0.032) North America & ANZ (+0.028) Middle East & North Africa (+0.027) Western Europe (+0.010) World (+0.009) Sub-Saharan Africa (+0.003) East Asia (+0.001) Central and Eastern Europe (+0.000) Southeast Asia (-0.003) Commonwealth of Independent States (-0.009) Latin America & Caribbean (-0.018)
2010–12 2005–07
Figure 2.7.5: Life-Choice Freedom by Regions: 2005 –07 and 2010–12
33
a
ppendix
Table A1: Imputation of Missing Values for Figure 2.3
Country GDP per capita Social support Perceptions of corruption
Generosity Freedom Healthy life
expectancy
Myanmar PPP US dollar in 2011 from IMF
Corruption in business in 2012
Predicted by “donation-a-b*ln(gdp)”1
Iran 2009 data 2008 data Predicted by
“donation-a-b*ln(gdp)”
2008 data
Palestinian Territories
2004 data from Washington Institute
Predicted by “donation-a-b*ln(gdp)”
Somaliland Region
Ethiopia’s data Predicted by
“donation-a-b*ln(gdp)”
Ethiopia’s data
Kosovo Bosnia and
Herzegovina’s data
Predicted by “donation-a-b*ln(gdp)”
North Cyprus Cyprus’s data Predicted by
“donation-a-b*ln(gdp)”
Cyprus’s data
Sudan 2008 data
Ethiopia Kenya’s data
Bahrain 2009 data
Jordan 2009 data
Uzbekistan 2006 data
Turkmenistan Uzbekistan’s data
Kuwait Corruption in
business in 2010-11
Saudi Arabia 2009 data
Qatar 2009 data
Oman Saudi Arabia’s
data
Saudi Arabia’s data
United Arab Emirates
Corruption in business in 2010
34 34
1 Our biggest debt of gratitude is to the Gallup Organization for complete and timely access to the data from all years of the Gallup World Poll. We are also grateful for continued helpful advice from Gale Muller and his team at Gallup, and for invaluable research support from the Canadian Institute for Advanced Research (CIFAR) and the Korea Development Institute (KDI) School of Public Policy and Management. Jerry Lee has provided fast and efficient research assistance, especially in the section relating to happiness changes in the Eurozone countries. Kind advice on chapter drafts has been provided by Chris Barrington-Leigh, Angus Deaton, Martine Durand, Richard Easterlin, Carol Graham, Jon Hall, Richard Layard, Daniel Kahneman, Conal Smith, and Arthur Stone.
2 See Helliwell, Layard & Sachs, eds. (2012).
3 The detailed definitions of the variables are found in the notes to Table 2.1. The equations shown in Table 2.1 use pooled estimation from a panel of annual observations for each country, and thus explain differences over time and among countries. If a pure cross-section is run using the 115 countries for which 2012 data are available, the equa-tion explains 75.5% of the internaequa-tional variance, similar to what is found using the larger sample of Table 2.1.
4 See OECD (2013).
5 See Cantril (1965).
6 See World Happiness Report (Helliwell, Layard & Sachs, eds. 2012, pp. 14-15). The result is shown by triangulation, since no surveys asks all three questions. We were first able to show the explanatory equivalence of SWL and the Cantril ladder using Gallup World Poll data. The triangle was completed using ESS data to show the same thing for SWL and happiness with life as a whole. The fact that ESS equations were even tighter using the average of SWL and happiness with life as a whole, than using either variable on its own, led us to recommend (Helliwell, Layard and Sachs 2012, p. 94) the inclusion of both questions in national surveys.
7 See, for example, Krueger et al. (2009). Measures of affect are also more useful in laboratory experiments, since these are generally expected to show only ephemeral effects, of a sort not likely to be revealed by life evaluations.
8 For the 606 country-years where there are observations for the HDI, ladder, and affect measures, there are significant positive correlations between the HDI and the Cantril ladder (+0.76), positive affect (+0.28), and happiness yesterday (+0.24). Thus the linkage with the HDI is three times as strong for the life evaluation as for positive emotions. The
link is even weaker for negative affect, where the correlation with the HDI is anomalously positive but insignificant (+0.06).
9 The horizontal line at the right-hand end of each bar shows the estimated 95% confidence intervals. Boot-strapped standard errors (500 bootstrap replications) are used to construct the confidence intervals.
10 The sixth variable used in Table 2.1, healthy life expectancy, is only available at the national level, so that all of its variance is among rather than within countries. Figure 2.1 is based on the household income levels submitted by each Gallup respondent, made internationally comparable by the use of purchasing power parities. The income variable we use in Table 2.1 is GDP per capita at the national level.
11 This result holds for the individual emotions as well as their averages. If the base equation of Table 2.1 is fitted separately to each of the positive emotions, the proportion of variance explained ranges from 0.38 for enjoyment to 0.48 for happiness, while for the negative emotions the share ranges from 0.17 for worry to 0.21 for anger. Since the patterns of coefficients are broadly similar, the aggrega-tion into measures of positive and negative affect produces equations that are generally tighter– fitting than for the individual emotions.
12 Using a large sample of individual-level observations for the Cantril ladder and positive affect from the Gallup Healthways US survey, Kahneman & Deaton (2010) also find much higher and more sustained income effects for the ladder than for positive affect.
13 The regional groupings are the same as those used by the Gallup World Poll, except that we have split the European countries into two groups, one for Western Europe and the other for Central and Eastern Europe. The online appendix shows the allocation of countries among the 10 regions.
35 15 From the actual average data in each country, we can find
the lowest value for each of the variables, and then calcu-late happiness in Distopia as the constant term of the equa-tion plus each coefficient times the lowest observed average country’s value for the six key variables in 2010-12.
16 This unexplained component is the country’s average error term, for 2010-12, in the equation of Table 2.1.
17 There are 11 possible answers over the 10-point range of the scale, with 0 for the worst possible life and 10 for the best possible life. The 0.8 is calculated as follows: 0.80=0.283*2.82, where 0.283 is the income coefficient from Table 2.1 and 2.82 is the difference of log incomes between the richest and poorest of the 10 regions. These are, respectively, the artificial region comprising the United States, Canada, Australia and New Zealand (NANZ) and Sub-Saharan Africa.
18 0.86=2.32*(0.93-0.56), where 0.93 and 0.56 are the aver-age shares of respondents who have someone to count on in Western Europe and South Asia, respectively.
19 0.20=0.713*(0.35-0.07), where 0.35 and 0.07 are the average values for perceived absence of corruption in NANZ and Central & Eastern Europe, respectively.
20 0.66=0.023*(72.56-43.76), where 72.56 and 43.76 are the average life expectancies in Western Europe and Sub-Saharan Africa.
21 0.46=0.86*(0.28-(-0.25)), where 0.28 and -0.25 are the average generosity values (adjusted for income levels) in the most (Southeast Asia) and least (MENA) generous regions.
22 0.26=0.90*(0.85-0.56), where 0.85 and 0.56 are the average freedom values in the most (NANZ) and least (MENA) free regions.
23 The issues and evidence are surveyed by Oishi (2010).
24 Higher positive affect, and greater sociability (beyond that captured by the social support variable) are advanced as possible sources of the Latin American boost, with ques-tion response styles an identified contributor to the East Asian effect. The positive effect for Latin America is also found by Inglehart (2010) using the World Values Survey data for a smaller number of countries. The negative differ-ence for East Asians becomes larger if it is compared to re-spondents in North America, mirroring earlier studies sug-gesting that East Asian respondents report lower subjective well-being, and are less likely to give answers at the top of the scale, than are similarly-aged and situated respondents
in the United States, with Asian immigrants to the United States falling in between. See Heine & Hamamura (2007).
25 There are some missing values for GDP per capita, healthy life expectancy at birth, social support, freedom to make life choices, generosity, and corruption in some countries. To generate the decomposition for each country, we impute the 2010-12 average values for the missing data. Table A1 in the Appendix show the imputation details.
26 There were no surveys in either 2010 or 2011 in Iceland, Switzerland, and Norway. To increase the data coverage and therefore the robustness of estimation of national averages representing the 2010-12 period, we combine data from 2008 and 2012 for Norway and Iceland, and data from 2009 and 2012 for Switzerland.
27 There is a zero correlation between the log of national population and average ladder scores, but if the log of population is added to the equation of Table 2.1, it takes the coefficient +0.075 (t=2.7). A similar coefficient, +0.071 (t=4.9), is obtained if the residuals from the Table 2.1 equation are regressed on the log of population.
28 The increase for East Asia is almost exactly the same as that for China, which has a dominant population share (86% in 2011) in the region. The increase in China matches that found in several other surveys over the 2005-10 period, as documented by Easterlin et al. (2012).
29 For the 21 countries, the population-weighted average increase was 0.435 points, on a 2005-07 average ladder score of 6.22.
30 For the 27 countries, the average increase was 0.241 points, or 5.5% of the 2005-07 average ladder score of 4.385.
31 South Korea’s exceptional post-crisis performance, in both macroeconomic and happiness measures, is discussed in more detail in Helliwell, Huang & Wang (2013).
32 The units for GDP per capita on the horizontal axis are on a natural logarithmic scale.
33 See Helliwell, Huang & Wang (2013).
36 36
35 The losses are almost as large even when set against the rankings of the same countries in the first World Happiness Report. That report included all years from 2005 through 2010 and into 2011, and hence included at least the start of the Eurozone crisis. The four countries had an average Cantril ladder ranking of 41st in Figure 2.3 of that report,
compared to 59th in Figure 2.3 of this report, which is
based on surveys carried out during 2010-12.
36 This is an appropriate empirical strategy, in the current case, because all of the four countries under the micro-scope are members of the OECD.
37 For the 176 OECD observations, the unemployment rate explains 7.8% of the remaining variance, with a coefficient of 0.033 (t=3.8).
38 See especially the updated version of Helliwell & Huang (2011).
39 Di Tella et al. (2001, 2003) use Eu