TECHNO-ECONOMY ANALYSIS OF CONDENSATE LIFTING FACILITIES
PROJECT IN NORTH SEA JAVA BY PT.X
Rafi Ahmad Razzak
Bachelor of Industrial Engineering, Industrial and System Engineering Faculty, Telkom University
Abstrak
PT. X adalah perusahaan BUMN yang bergerak di bawah naungan PT. Pertamina sektor hulu. Sebagai perusahaan yang bergerak di industri migas, maka salah satu tugas dari PT. X adalah membangun proyek baik berupa sumur ataupun fasilitas penunjang. Untuk menentukan proyek manakah yang seharusnya dibangun maka dibutuhkanlah analisis tekno-ekonomi. Analisis tekno ekonomi adalah analisis yang digunakan untuk menentukan pilihan terbaik suatu alternatif proyek dibandingkan dengan alternatif lainnya menggunakan perhitungan Net Present Value, Internal Rate of Return, Payback Period serta analisis sensitivitas. Pada kasus ini analisis dilakukan pada proyek pembangunan fasilitas lifting di lapangan laut utara jawa.
Terdapat tiga alternatif yang dihasilkan untuk melakukan penilaian dan analisis tekno-ekonomi. Alternatif pertama adalah membangun ORF(Operation Receiving Facility) baru, alternatif kedua adalah pengiriman melalui kapal, dan alternatif ketiga adalah joint lifting. Berdasarkan hasil perhitungan dan analisis, dapat diambil kesimpulan bahwa alternatif terbaik adalah alternatif ketiga. Kesimpulan tersebut didasarkan pada nilai masing-masing adalah NPV $ 27.660.000, IRR 27%, dan BCR 1,55. Selain nilai tersebut, alternatif ini sensitif terhadap nilai produksi kotor dan tidak peka terhadap harga minyak. Karena itu alternatif yang dipilih untuk melaksanakan pembangunan fasilitas lifting di lapangan XX oleh PT. X berdasarkan analisis tekno-ekonomi dilakukan dengan joint lifting.
Kata kunci : Analisis tekno-ekonomi, proyek pembangunan fasilitas, Net Present Value, Internal Rate of Return, Payback Period, Analisis Sensitivitas
Abstract
PT. X has one of the tasks which is a project building for either resevoirs or supporting facilities. PT. X use techno-economy analysis in determine which of the project should be build. Techno-economy analysis is the analysis used to determine the best choice of a project alternative compared to other alternatives using the calculation of Net Present Value, Internal Rate of Return, Payback Period and sensitivity analysis. In this case, the analysis is performed on development projects in the field of lifting facilities northern Java Sea.
There are three alternatives, The first alternative is building new ORF, the second alternative is shipping and docking, and the third alternative is joint lifting. Based on that analysis analysis, the conclusion is the best alternative is the third alternative. That conclusion is based on the value of each is $27.660.000 of NPV, 27% of IRR,and 1,55 value of the BCR. All those values is better compared to the other alternatives. Beside of that value, This alternative is sensitive to the value of gross production and insensitive to the oil price. The chosen alternative of building of lifting facilities in XX field by PT. X based on the techno-economy analysis is by joint lifting.
Keywords: Techno-economy Analysis, project, Net Present Value, Internal Rate of Return, Pay Back Period, Sensitivity Analysis
1.Introduction
Interest in oil and gas undertakings is a complex successive request. At each stage, the organization assemble data to choose whether the venture is possible sent to the following stage with the danger of monetary misfortune in the event that one stage neglects to accomplish its goals (Couёt, 2003). To take a decision on a project that is most financially feasible when compared to some project options available, it is necessary techno-economy analysis.
In a context of build a project, PT.X usually make several alternatives that will be decided later. These alternatives will be generated through several meeting with all divisions that related to the project. Decision making is basically a procedure of selecting the best alternative given the accessible data for correlation of qualities and shortcomings of every alternatives. The decisions are made by recognizing the option with the most income or the minimum cost. In order to decide that, incremental cost analysis will be used.
Techno-economy assessment in principle is a cost-benefit comparison using different methods. These assessments are used for tasks such as evaluate the economic feasibility of a specific project, investigate cash flows over the lifetime, Evaluate the likelihood of different technology scales and applications, and Compare the economic quality of different technology applications providing the same service. In this research Techno-economic assesment and analysis will be used to determine which alternative that the most feasible one in between several project alternatives to build the lifting facilities in northern java island field who will be build by PT.X.
In this report there are several problems that nned to be solved. In order to solve those problems, the steps that need to be done are determining technical aspects on each alternative, determining cost and benefit of each alternative, and determining the best alternative based on techno economy analysis. Those steps is also the basic step in execute the techno-economy assesment and analysis.
2.Basis Theory and Methodology
2.1Net Present Value (NPV)
NPV technique is to ascertain the contrast between the present estimation of the venture with the present estimation of net money receipts (income and the terminal operational income) later on. To figure the present esteem decided esteem loan cost that is viewed as important (Benny & Alexandria, 2009). The formula for calculating NPV is:
NPV = PV Benefit– PV Cost (1) NPV = ∑ (𝑅𝑛 − 𝐷𝑛)(𝑃
𝐹 𝑁
𝑛=0 , 𝑖%, 𝑛) (2)
Where:
Rn : Cash Inflow Dn : Cash Outflow
(𝑃𝐹, 𝑖%, 𝑛) : Factor present and future with the rate of i%
The criteria for accepting or rejecting an investment based on the NPV is as follows:
1. NPV > 0, project is feasible
2. NPV < 0, project is infeasible
3. NPV = 0, project is feasible but probability to be accepted is 50%
If NPV> 0 means that the project can create a cash inflow with a percentage greater than the capital invested opportunity. If NPV = 0, the project is likely to be accepted for cash flow obtained is equal to the opportunity cost of capital. Thus, the greater the NPV, the better for the project to be accepted and continued investment.
2.2Internal Rate of Return (IRR)
Internal Rate of Return (IRR) is a marker of the level of effectiveness of venture. As indicated by Keown, inward rate of return is one that outcomes in a capital planning choices that mirror the level of return for the venture. Numerically, the interior rate of return is the markdown rate which balance the present estimation of money inflows to the present estimation of money surges (Keown, et. Al., 2002).
The IRR is utilized to decide if a speculation is plausible or not, for this situation the rate of degree of profitability which is run must be higher than the base adequate rate of return or least appealing rate of return. Besides, the base worthy rate of return is the base rate of profit for a venture that is important to make financial specialists might be keen on contributing (Keown, et. Al., 2002). IRR could be determined by these equations:
𝐼0 = ∑ 𝐹𝐶𝐹𝑡
(1+𝐼𝑅𝑅)𝑡
𝑛
FCFt : The annual free cash flow in period t
I0 : Initial investment
n : Economic life of project
IRR : internal rate of return
The use of the IRR in decision-making begins with the calculation of the present value (PV) of the cash flows of an investment by using a discount rate. The calculation result is then compared with the number of PV from capital expenditures. If the PV of cash flows greater than PV investments (outlays), the discount rate used to be higher. But if otherwise, the PV of cash flow is less than PV investments, the discount rate used should be lower.
Looking at the outcomes PV income keep on doing so found the rebate rate that makes PV income equivalent to PV venture. By utilizing the rebate rate, the NPV of the venture is zero (Ross, et. Al., 2010).
2.3Payback Period (PBP)
Payback period strategy is a period required to close the speculation consumption (introductory money venture) by utilizing income, at the end of the day, the payback time frame is the proportion between the underlying expense of venture with its money inflow that the outcome is a unit of time. Besides, the estimation of this proportion contrasted and the most extreme satisfactory payback period (Umar, 2005). The formula used to calculate the payback period is:
𝑃𝐵𝑃 = 𝑁𝑒𝑡 𝐶𝑎𝑠ℎ𝑓𝑙𝑜𝑤 (𝑝𝑟𝑜𝑐𝑒𝑒𝑑)𝑖𝑛𝑣𝑒𝑠𝑡𝑚𝑒𝑛𝑡 (𝑜𝑢𝑡𝑙𝑎𝑦) ×1 𝑦𝑒𝑎𝑟 (4)
With the following criteria:
If payback period shorter than the maximum payback period, then the investment is feasible.
2.4Sensitivity Analysis
The sensitivity analysis is an investigation led while figuring the evaluated future money streams are frequently confronted with instability. Presently, we are breaking down the assessed future money streams, at that point we are managing vulnerability. Subsequently, the aftereffects of the estimations on paper it can stray a long way from reality. Instability can prompt decreased capacity of a business extend in operation to create benefits for the organization (Umar, 2005).
Here is stages that used in sensitivity analysis:
1. Assess the cash flow, the withdrawal continues to separate the cash flows resulting from investment decisions and cash flow that occurs due to spending decisions.
2. Calculate the cost of capital weighted average using after-tax basis. The cost of capital is obtained by multiplying the amount of the capital cost of each expenditure the proportion of funds used.
2.5 Conceptual Model
Determine the cost and benefit for each alternative
Determine the technical aspect of each alternative
Assess every alternatives with techno-economy
analysis method Alternative 2: Facilities development by
build the jetty on the offshore field to do delivery
by shipping and docking Alternative 1:
Facilities development by build the new ORF (Onshore Receiving
Facility) in Cirebon
Alternative 3: Facilities development by using PT.PEP source and facilities that called joint lifting agreement
Choose the best alternative
Executing sensitivity analysis Initiate planning for build
lifting facilities
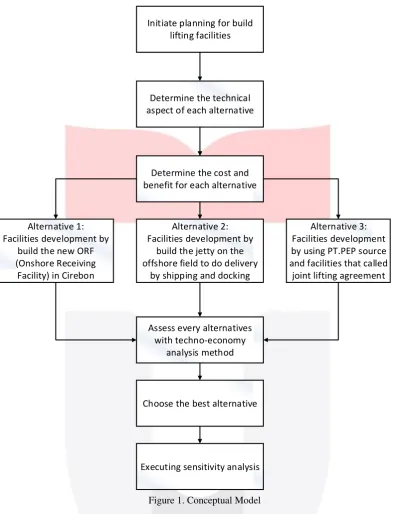
Figure 1. Conceptual Model
The concept in this study begins with determining which projects will be calculated by the method of the techno-economy analysis. In one time there may be a lot of projects offered to run by the project division, but of several options the project will only have a few or may not even exist at all to be run. It is caused by several factors: the degree of urgency of the project, the capital investment required, the risks that may occur, and other factors. After execute the initiate planning for build the lifting facilities, the next step is determine the alternatives to execute project. These project have 3 determined alternatives which are, Facilities development by connecting to the existing facilities, facilities development by build the new dock to do manual lifting, and make an outsourcing agreement with other company. Each alternative has its own technical aspect, cost, and risk so it needed to be calculated for each.
After technical stages, they started to stage financially. Initially estimated cash flows formed by considering all existing cost components and classification. Once that is done the process of determining MARR as a reference to measure how the withdrawal of a project economically. After the estimated cash flows and MARR specified then the calculation stage begins techno-economy analysis with NPV, IRR, PBP, and the BCR.
in price. After all, the report analyzed the form of conclusions and suggestions are given to the division of the project to execute the project.
2.6Troubleshooting systematics
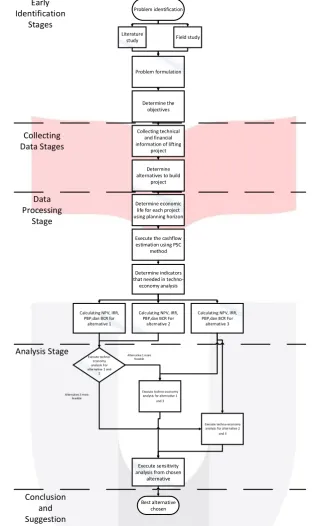
This research have several stages, that are 1. Early Identification Stages 2. Collecting Data Stages 3. Processing Data Stages 4. Analysis Stages
5. Conclusion and Suggestion Stages
Detailed explanation of the stages are presented as follows.The steps undertaken in problem solving on the object of this study can be described systematically through the following flowchart.
3.Discussion
3.1First Alternative (Building New ORF) Calculation Result
Table 1 First Alternative Calculation Result ECONOMIC METRICS
NPV10 ($m) 19,51 IRR 19% NPV/NPCe 0,2 Payback (Year) 2020 Opex Payback (Days) 87
Entitlement mmboe 5,0 Net Capex $/boe 22,7
Net Opex $/boe 17,7
Contr NPV10 ($m) 33,64 Govenrment NPV10 ($m) 144,94
Government share 41% Cost Recovery/Rev 42%
NPV for this alternative is 19,51. It is mean the estimation value of NPV in this project by choosing the first alternative is $19,510,000. The NPV is projected for 8 years with the discount rate factor of 10%. Those value of NPV is mean that this alternative is feasible because it fulfill the condition of NPV>0. The other value that need to be consider beside the NPV is IRR. The value of the IRR is 19%. The MARR of this project is 10% based on the fluctuation in oil and gas average rate of price. Because of the value of IRR is fulfill the condition of IRR>MARR then this alternative is feasible. Despite of the MARR is 10% PT. XX usually do not want to take the risk by choosing an alternative with less than 5% margin. Because of this alternative’s IRR value is 19% so this alternative will be considered as an alternative that will be chosen. The last variable that needs to be considered is payback period which in this model is in year. The result on payback year is in 2020. It is mean that this alternative takes 3 years from the base year to reach the break even point. Break event point is the point where the NPV=0. The IRR show it by the value of rate percentage and the payback period by the period it takes to reach that. This value is important for the comparation process later.
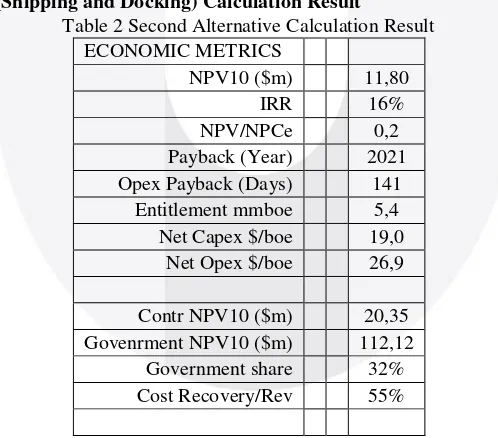
3.2Second Alternative (Shipping and Docking) Calculation Result
Table 2 Second Alternative Calculation Result ECONOMIC METRICS
NPV10 ($m) 11,80 IRR 16% NPV/NPCe 0,2 Payback (Year)
2021 Opex Payback (Days) 141
Entitlement mmboe 5,4 Net Capex $/boe 19,0
Net Opex $/boe 26,9
Contr NPV10 ($m) 20,35 Govenrment NPV10 ($m) 112,12
Government share 32% Cost Recovery/Rev 55%
each year. When the value is projected in the present value then the result is lower value of NPV. Despite of the value is lower, the NPV still fulfill the condition NPV>0 so this alternative considered as feasible alternative. The IRR of this alternative is 16%. This alternative is also has the lower IRR value than the first alternative. The reason is also same with the NPV, it is because this alternative has higher value of annual opex. From the IRR this alternative almost not considered as a chosen alternative. Wether the MARR is 10%, PT. X usually only want to choose the alternative that has more than 5% margin from the MARR value and this alternative only has 6% margin. It is also because of the IRR and the NPV value is lower than the first alternative, it takes longer time to reach break even point, so the payback period also take one more year than the first alternative.
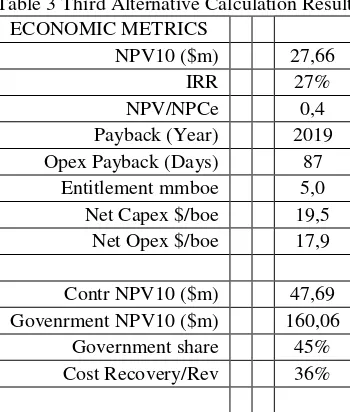
3.3Third Alternative (Joint Lifting) Calculation Result
Table 3 Third Alternative Calculation Result ECONOMIC METRICS
NPV10 ($m) 27,66 IRR
27% NPV/NPCe 0,4 Payback (Year) 2019 Opex Payback (Days) 87
Entitlement mmboe 5,0 Net Capex $/boe 19,5
Net Opex $/boe 17,9
Contr NPV10 ($m)
47,69 Govenrment NPV10 ($m) 160,06
Government share 45% Cost Recovery/Rev 36%
The NPV value is 27,66 which mean $27,660,000 in the value of money. This value is the largest compared to the two alternative before. This value is the largest because of this alternative has the lowest cost. The cost that include in this alternative is the same tangible and intangible cost as the other alternatives and the facilities cost that only from explort pipeline. Despite of this alternative has the largest NPV value and also feasible, this alternative not necessarily be the chosen alternative. This alternative has the IRR value of 27% which is a very high value of IRR when it came in the project’s field. This alternative has the highest value compared to the other alternatives. With those value it will be consider as the most feasible one. Because of this alternative has the highest value both in the NPV and also IRR so the payback period has the fastest one. In this alternative to reach the break even point it is only need 2 years. Wether this alternative is the best when it comes to the value of NPV, IRR, and payback period, this alternative need to be analyzed by the incremental cost and benefit ratio to be considered as the chosen alternative.
3.4Sensitivity Analysis
In the sensitivity analysis, the alternative that will be analyzed is only the third alternative because it is the chosen alternative. To conduct the sensitivity analysis in oil and gas industry it must be based on “Pedoman Tata Kerja Rencana Pengembangan Lapangan” (PTK POD). Based on that, the indicator that needs to be a parameter is oil price, gas price, gross production, capex and opex. After that, each of the parameter needs to be shown by spider diagram or tornado chart with 20% variance. The sensitivity analysis is needed to consider wether the techno-economy analysis needs to be revised or not.
The sensitivity analysis will conducted into the NPV and IRR. For the oil price the range of its price will be between range of -10 to +10 from its original price. For the gas price the range will be between -1 to +1 from its original price. For the gross production, capex, and opex it is use the -20% and +20% from its original value. Each of the parameter that used in this sensitivity analysis is independent which mean when a parameter is set as a variable then the other parameter is fixed.
the most sensitive factor is gross production. The differences is because when NPV is measuring the amount of money, the IRR is measuring the rate percentage. Based on that value it can be concluded if the opex is change 20% then the IRR will change about 10%.
On the other hand, the most insensitive factor is oil price and opex. The 20% change in opex value or the $10 change in oil price is only change the IRR value about 1%. From both sensitivity analysis from IRR and NPV it can be concluded the most sensitive factor to the most insensitive factor for the chosen alternative in sequence is gross production, capex, gas price, opex, and oil price
4.Conclusion
Based on the techno-economy assesment and analysis, the conclusion is the best alternative is the third alternative. That conclusion is based on the value of Net Present Value, Internal Rate of Return, payback period and Benefit-Cost Ratio. The value of each of that in sequence is $27.660.000 of NPV, 27% of IRR, 2 years of payback period and 1,55 value of the BCR. All those four values is better compared to the other alternatives. Beside of that value, This alternative is sensitive to the value of gross production and insensitive to the oil price. Because of that the chosen alternative to execute the building of lifting facilities in XX field by PT. X based on the techno-economy assesment and analysis is by joint lifting.
Bibliography:
[1] Afwira, Susi, 2010. Analisis Ekonomi teknik Infill Drilling di Lapangan “XYZ”. Pekanbaru: Universitas Islam Riau
[2] Blank, Leland, & Tarquin, Anthony. 2012. Engineering Economy: Seventh Edition. New York: The McGraw-Hill Companies Inc.
[3] Dini, Asrie Permata, 2015. Studi Kelayakan Pembentukan Kelompok Masyarakat Energi Mandiri dengan Biogas Memanfaatkan Limbah Mendong. Bandung: Telkom University
[4] Erwinsyah, 2012. Analisis Kelayakan Proyek Minyak dan Gas (Studi Kasus: Wilayah Kerja Whiskey Alpha). Jakarta: Universitas Indonesia