Harness the
Power of Big Data
for IBM Software Group’s Information Management division and addition-ally leads the World-Wide Competitive Database and Big Data Technical Sales Acceleration teams. Paul is an award-winning writer and speaker with over 19 years of experience in Information Management. In 2012, Paul was chosen by SAP as one of its Top 50 Big Data Twitter influencers (@BigData_ paulz). Paul has written more than 350 magazine articles and 16 books, including Understanding Big Data: Analytics for Enterprise Class Hadoop and Streaming Data; Warp Speed, Time Travel, Big Data, and More: DB2 10 New Fea-tures; DB2 pureScale: Risk Free Agile Scaling; DB2 Certification for Dummies; and
DB2 for Dummies. In his spare time, Paul enjoys all sorts of sporting activities, including running with his dog Chachi, avoiding punches in his MMA train-ing, and trying to figure out the world according to Chloë—his daughter. You can reach him at: [email protected].
Dirk deRoos, B.Sc., B.A., is IBM’s World-Wide Technical Sales Leader for IBM InfoSphere BigInsights. Dirk spent the past two years helping customers with BigInsights and Apache Hadoop, identifying architecture fit, and advis-ing early stage projects in dozens of customer engagements. Dirk recently coauthored a book on this subject area, Understanding Big Data: Analytics for Enterprise Class Hadoop and Streaming Data (McGraw-Hill Professional, 2012). Prior to this, Dirk worked in the IBM Toronto Software Development Lab on the DB2 database development team where he was the Information Architect for all of the DB2 product documentation. Dirk has earned two degrees from the University of New Brunswick in Canada: a Bachelor of Computer Sci-ence, and a Bachelor of Arts (Honors English). You can reach him at: dirk [email protected] or on Twitter at @Dirk_deRoos.
Krishnan Parasuraman, B.Sc., M.Sc., is part of IBM’s Big Data industry solu-tions team and serves as the CTO for Digital Media. In his role, Krishnan works very closely with customers in an advisory capacity, driving Big Data solution architectures and best practices for the management of Internet-scale analytics. He is an authority on the use of Big Data technologies, such as Hadoop and MPP data warehousing platforms, for solving analytical problems in the online digital advertising, customer intelligence, and
real-time marketing space. He speaks regularly at industry events and writes for trade publications and blogs. Prior to his current role, Krishnan worked in research, product development, consulting, and technology marketing across multiple disciplines within information management. Krishnan has enabled data warehousing and customer analytics solutions for large media and consumer electronics organizations, such as Apple, Microsoft, and Kodak. He holds an M.Sc. degree in computer science from the University of Georgia. You can keep up with his musings on Twitter @kparasuraman.
Thomas Deutsch, B.A, M.B.A., is a Program Director for IBM’s Big Data team. Tom played a formative role in the transition of Hadoop-based technol-ogy from IBM Research to IBM Software Group and continues to be involved with IBM Research around Big Data. Tom has spent several years helping customers, identifying architecture fit, developing business strategies, and managing early stage projects across more than 300 customer engagements with technologies such as Apache Hadoop, InfoSphere BigInsights (IBM’s Hadoop distribution), InfoSphere Streams, Cassandra, and other emerging NoSQL technologies. Tom has coauthored a book and multiple thought papers about Big Data, and is a columnist for IBM Data Management magazine. He’s a frequent speaker at industry conferences and a member of the IBM Academy of Technology. Prior to this, Tom worked in the Information Management CTO’s office, focused on emerging technologies; he came to IBM through the FileNet acquisition, where he was its flagship product’s lead product man-ager. With more than 20 years in the industry, and as a veteran of two startups, Tom is an expert on the technical, strategic, and business information man-agement issues facing the enterprise today. Tom earned a B.A. degree from Fordham University in New York and an M.B.A. degree from the University of Maryland University College.
David Corrigan, B.A., M.B.A
.
,
is currently the Director of ProductMarket-ing for IBM’s InfoSphere portfolio, which is focused on managMarket-ing trusted information. His primary focus is driving the messaging and strategy for the InfoSphere portfolio of information integration, data quality, master data management (MDM), data lifecycle management, and data privacy and security. Prior to his current role, David led the product management and product marketing teams for IBM’s MDM portfolio, and has worked in the Information Management space for over 12 years. David holds an M.B.A.
James Giles, BSEE, B.Math, MSEE, Ph.D., is an IBM Distinguished Engineer and currently a Senior Development Manager for the IBM InfoSphere BigIn-sights and IBM InfoSphere Streams Big Data products. Previously, Jim man-aged the Advanced Platform Services group at the IBM T. J. Watson Research Center, where Jim and his team developed the technology for the System S stream-processing prototype, which is now the basis for InfoSphere Streams. Jim joined IBM in 2000 as a Research Staff Member and led research and devel-opment in content distribution, policy management, autonomic computing, and security. He received his Ph.D. in electrical and computer engineering from the University of Illinois at Urbana-Champaign, where he studied covert communications in data networks. Jim has several patents and is the recipient of an IBM Corporate Award for his work on stream computing.
About the Technical Editor
Roman B. Melnyk, B.A., M.A., Ph.D., is a senior member of the DB2 Infor-mation Development team. During more than 18 years at IBM, Roman has written numerous books, articles, and other related materials about DB2. Roman coauthored DB2 Version 8: The Official Guide; DB2: The Complete Refer-ence; DB2 Fundamentals Certification for Dummies; and DB2 for Dummies.
Harness the
Power of Big Data
The IBM Big Data Platform
Paul C. Zikopoulos
Dirk deRoos
Krishnan Parasuraman
Thomas Deutsch
David Corrigan
James Giles
New York Chicago San Francisco Lisbon London Madrid Mexico City Milan New Delhi San Juan Seoul Singapore Sydney Toronto
ISBN: 978-0-07180818-7 MHID: 0-07-180818-3
The material in this eBook also appears in the print version of this title: ISBN: 978-0-07-180817-0, MHID: 0-07-180817-5.
McGraw-Hill eBooks are available at special quantity discounts to use as premiums and sales promotions, or for use in corporate training programs. To contact a representative please e-mail us at [email protected]. All trademarks are trademarks of their respective owners. Rather than put a trademark symbol after every occur-rence of a trademarked name, we use names in an editorial fashion only, and to the benefit of the trademark owner, with no intention of infringement of the trademark. Where such designations appear in this book, they have been printed with initial caps.
Information has been obtained by McGraw-Hill from sources believed to be reliable. However, because of the possibility of human or mechanical error by our sources, McGraw-Hill, or others, McGraw-Hill does not guaran-tee the accuracy, adequacy, or completeness of any information and is not responsible for any errors or omissions or the results obtained from the use of such information.
The contents of this book represent those features that may or may not be available in the current release of any products mentioned within this book despite what the book may say. IBM reserves the right to include or exclude any functionality mentioned in this book for the current or subsequent releases of InfoSphere Streams, InfoS-phere BigInsights, the family of IBM PureData Systems, or any other IBM products mentioned in this book. Decisions to purchase any IBM software should not be made based on the features said to be available in this book. In addition, any performance claims made in this book aren’t official communications by IBM; rather, they are the results observed by the authors in unaudited testing. The views expressed in this book are also those of the authors and not necessarily those of IBM Corporation.
TERMS OF USE
This is a copyrighted work and The McGraw-Hill Companies, Inc. (“McGrawHill”) and its licensors reserve all rights in and to the work. Use of this work is subject to these terms. Except as permitted under the Copyright Act of 1976 and the right to store and retrieve one copy of the work, you may not decompile, disassemble, reverse engineer, reproduce, modify, create derivative works based upon, transmit, distribute, disseminate, sell, publish or sublicense the work or any part of it without McGraw-Hill’s prior consent. You may use the work for your own noncommercial and personal use; any other use of the work is strictly prohibited. Your right to use the work may be terminated if you fail to comply with these terms.
THE WORK IS PROVIDED “AS IS.” McGRAW-HILL AND ITS LICENSORS MAKE NO GUARANTEES OR WARRANTIES AS TO THE ACCURACY, ADEQUACY OR COMPLETENESS OF OR RESULTS TO BE OBTAINED FROM USING THE WORK, INCLUDING ANY INFORMATION THAT CAN BE ACCESSED THROUGH THE WORK VIA HYPERLINK OR OTHERWISE, AND EXPRESSLY DISCLAIM ANY WAR-RANTY, EXPRESS OR IMPLIED, INCLUDING BUT NOT LIMITED TO IMPLIED WARRANTIES OF MERCHANTABILITY OR FITNESS FOR A PARTICULAR PURPOSE. McGraw-Hill and its licensors do not warrant or guarantee that the functions contained in the work will meet your requirements or that its operation will be uninterrupted or error free. Neither McGraw-Hill nor its licensors shall be liable to you or anyone else for any inaccuracy, error or omission, regardless of cause, in the work or for any damages resulting therefrom. Mc-Graw-Hill has no responsibility for the content of any information accessed through the work. Under no circum-stances shall McGraw-Hill and/or its licensors be liable for any indirect, incidental, special, punitive, consequen-tial or similar damages that result from the use of or inability to use the work, even if any of them has been advised of the possibility of such damages. This limitation of liability shall apply to any claim or cause whatso-ever whether such claim or cause arises in contract, tort or otherwise.
My sixteenth book in my nineteenth year at IBM. Looking back, as this collection of books literally occupies an entire shelf, one thing strikes me: the
caliber of people I work with. From this authoring team (some of whom are newfound friends), to past ones, I’m luckily surrounded by some of the smartest and most passionate professionals in the world: IBMers—and it’s
an honor to learn from you all.
To the people who have created an environment in which I never want to slow down (Martin Wildberger, Bob Picciano, Dale Rebhorn, and Alyse
Passarelli), thanks for your mentorship and belief in me, but also your patience with some of those 2 A.M. run-on notes with the red markup. It’s interesting the toll that writing a book takes on your life. For example, I
found that my golf handicap experienced double-digit percentage growth after I started to write this one, leaving my retirement portfolio green with
envy. (I’d be remiss if I didn’t thank Durham Driving Range’s Dave Dupuis for always greeting me with a smile and listening to me complain
as he watches the odd—perhaps more than odd—ball shank hard right.) Although that stuff doesn’t matter, the personal impact and trade-offs you have to make to write a book lead me to my most important thank-you I’ve got to give: to my family, Chloë, Kelly, and the spirit of Grace. You gals keep
me strong and in overdrive.
—Paul Zikopoulos
To Sandra, Erik, and Anna: the truly wonderful people I have in my life. Thanks for giving me the time to help make this happen and for your patience with me! I would also like to dedicate my work on this book to my beloved Netherlands national football team, who, yet again, broke my heart
this year. May the collaboration of the many authors on this book be an example to you of what teamwork looks like! (Mental note: Never work on a
book with a fellow Dutchman.)
—Dirk deRoos
I would like to thank the Netezza team for all the fond memories and good times; and to Brad Terrell…for being my Force Field.
—Krishnan Parasuraman
Finally, thanks to Nagui Halim, John McPherson, Hamid Pirahesh, and Neil Isford for being such good dance partners in emerging compute spaces.
—Thomas Deutsch
I’d like to thank Karen, Kaitlyn, and Alex for all of their love and support. I’d also like to thank all of my integration and governance colleagues for continuing to drive a strategy that makes this a market-leading platform
and a very interesting place to work.
—David Corrigan
I would like to dedicate this book to the tireless IBM Big Data development and research teams worldwide. This book would not be possible without the countless innovations and commitment to building great technology for the
enterprise. Thank you all!
—James Giles
ix
CONTENTS
Foreword . . . xvii
Preface . . . xxi
Acknowledgments . . . xxv
About This Book . . . xxvii
Part I
The Big Deal About Big Data
1 What Is Big Data? . . . 3Why Is Big Data Important? . . . 3
Now, the “What Is Big Data?” Part . . . 4
Brought to You by the Letter V: How We Define Big Data . . . 9
What About My Data Warehouse in a Big Data World? . . . 15
Wrapping It Up . . . 19
2 Applying Big Data to Business Problems: A Sampling of Use Cases . . . 21
When to Consider a Big Data Solution . . . 21
Before We Start: Big Data, Jigsaw Puzzles, and Insight . . . 24
Big Data Use Cases: Patterns for Big Data Deployment . . . 26
You Spent the Money to Instrument It—Now Exploit It! . . . 26
IT for IT: Data Center, Machine Data, and Log Analytics . . . 28
What, Why, and Who? Social Media Analytics . . . 30
Understanding Customer Sentiment . . . 31
Social Media Techniques Make the World Your Oyster . . . 33
Customer State: Or, Don’t Try to Upsell Me When I Am Mad . . . 34
Fraud Detection:
“Who Buys an Engagement Ring at 4 A.M.?” . . . 36
Liquidity and Risk: Moving from Aggregate to Individual . . . 38
Wrapping It Up . . . 39
3 Boost Your Big Data IQ: The IBM Big Data Platform . . . 41
The New Era of Analytics . . . 41
Key Considerations for the Analytic Enterprise . . . 43
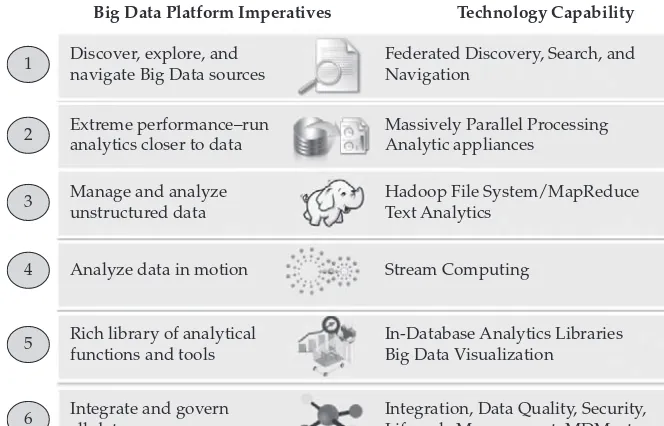
The Big Data Platform Manifesto . . . 45
IBM’s Strategy for Big Data and Analytics . . . 49
1. Sustained Investments in Research and Acquisitions . . . 49
2. Strong Commitment to Open Source Efforts and a Fostering of Ecosystem Development . . . 50
3. Support Multiple Entry Points to Big Data . . . 52
A Flexible, Platform-Based Approach to Big Data . . . 56
Wrapping It Up . . . 59
Part II
Analytics for Big Data at Res
t 4 A Big Data Platform for High-Performance Deep Analytics: IBM PureData Systems . . . 63Netezza’s Design Principles . . . 66
Appliance Simplicity: Minimize the Human Effort . . . 66
Hardware Acceleration: Process Analytics Close to the Data Store . . . 67
Balanced, Massively Parallel Architecture: Deliver Linear Scalability . . . 67
Modular Design: Support Flexible Configurations and Extreme Scalability . . . 67
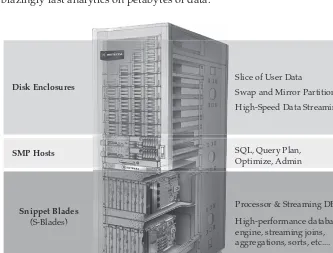
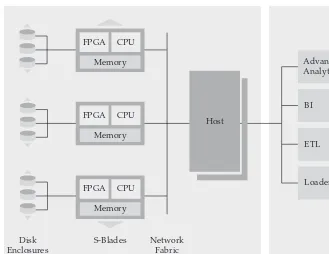
What’s in the Box? The Netezza Appliance Architecture Overview . . . 68
A Look Inside the Netezza Appliance . . . 69
The Secret Sauce: FPGA-Assisted Analytics . . . 72
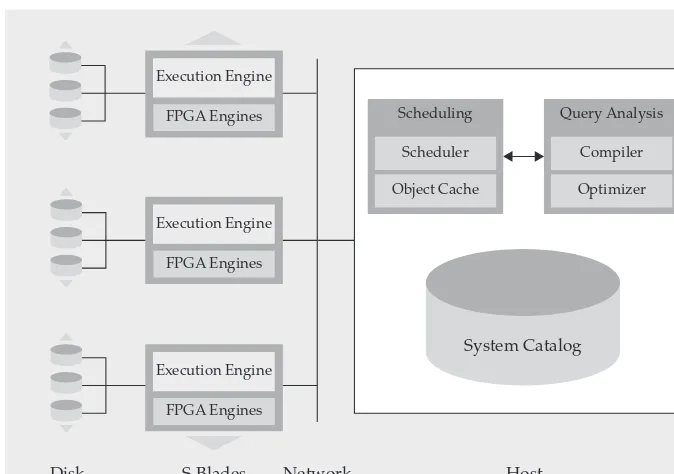
Query Orchestration in Netezza . . . 73
Platform for Advanced Analytics . . . 77
Contents xi
Customers’ Success Stories: The Netezza Experience . . . 81
T-Mobile: Delivering Extreme Performance with Simplicity at the Petabyte Scale . . . 82
State University of New York: Using Analytics to Help Find a Cure for Multiple Sclerosis . . . 83
NYSE Euronext: Reducing Data Latency and Enabling Rapid Ad-Hoc Searches . . . 84
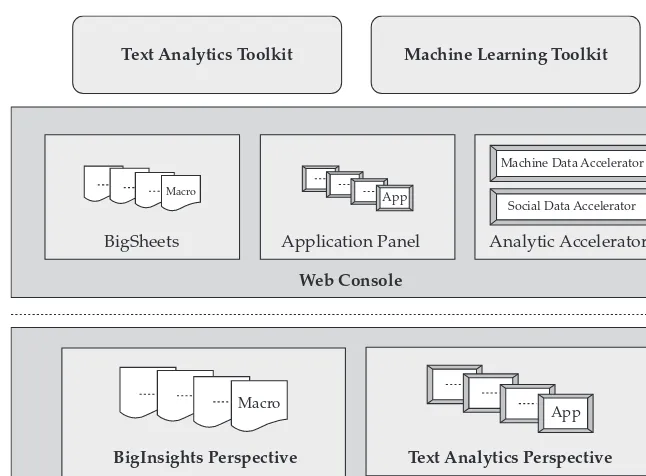
What’s in the Box: The Components of InfoSphere BigInsights . . . 90
A Low-Cost Way to Get Started: Running BigInsights on the Cloud . . . 95
Machine Learning for the Masses: Deep Statistical Analysis on BigInsights . . . 99
Analytic Accelerators: Finding Needles in Haystacks of Needles? . . . 99
Apps for the Masses: Easy Deployment and Execution of Custom Applications . . . 100
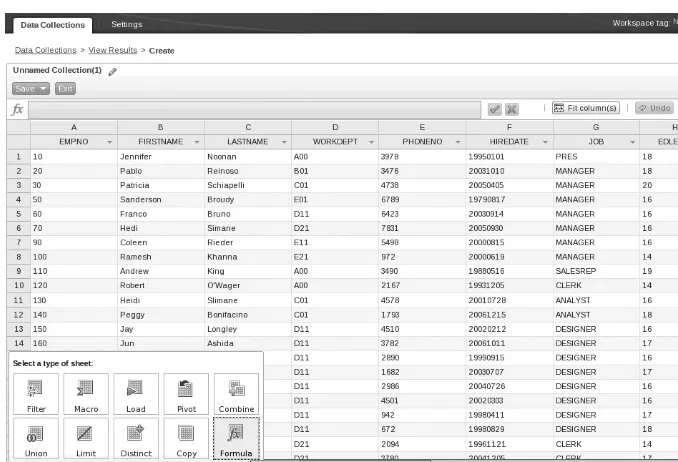
Data Discovery and Visualization: BigSheets . . . 100
The BigInsights Development Environment . . . 103
Data Integration . . . 106
The Anlaytics-Based IBM PureData Systems and DB2 . . . 107
JDBC Module . . . 108
InfoSphere Streams for Data in Motion . . . 109
InfoSphere DataStage . . . 109
Operational Excellence . . . 110
Securing the Cluster . . . 110
Monitoring All Aspects of Your Cluster . . . 112
Compression . . . 113
Improved Workload Scheduling: Intelligent Scheduler . . . 117
Adaptive MapReduce . . . 118
A Flexible File System for Hadoop: GPFS-FPO . . . 120
Wrapping It Up . . . 122
Part III
Analytics for Big Data in Motion
6 Real-Time Analytical Processing with InfoSphere Streams . . . 127The Basics: InfoSphere Streams . . . 128
How InfoSphere Streams Works . . . 132
What’s a Lowercase “stream”? . . . 132
Programming Streams Made Easy . . . 135
The Streams Processing Language . . . 145
Source and Sink Adapters . . . 147
Operators . . . 149
Streams Toolkits . . . 152
Enterprise Class . . . 155
High Availability . . . 155
Integration Is the Apex of Enterprise Class Analysis . . . 157
Industry Use Cases for InfoSphere Streams . . . 158
Telecommunications . . . 158
Contents xiii
Financial Services Sector . . . 160
Health and Life Sciences . . . 160
And the Rest We Can’t Fit in This Book … . . . 161
Wrapping It Up . . . 162
Part IV
Unlocking Big Data
7 If Data Is the New Oil—You Need Data Exploration and Discovery . . . 165Indexing Data from Multiple Sources with InfoSphere Data Explorer . . . 167
Connector Framework . . . 167
The Data Explorer Processing Layer . . . 169
User Management Layer . . . 173
Beefing Up InfoSphere BigInsights . . . 174
An App with a View: Creating Information Dashboards with InfoSphere Data Explorer Application Builder . . . 175
Wrapping It Up: Data Explorer Unlocks Big Data . . . 177
Part V
Big Data Analytic Accelerators
8 Differentiate Yourself with Text Analytics . . . 181What Is Text Analysis? . . . 183
The Annotated Query Language to the Rescue! . . . 184
Productivity Tools That Make All the Difference . . . 188
Wrapping It Up . . . 190
9 The IBM Big Data Analytic Accelerators . . . 191
The IBM Accelerator for Machine Data Analytics . . . 192
Ingesting Machine Data . . . 193
Extract . . . 194
Index . . . 196
Transform . . . 196
Statistical Modeling . . . 197
Visualization . . . 197
The IBM Accelerator for Social Data Analytics . . . 198
Feedback Extractors: What Are People Saying? . . . 200
Profile Extractors: Who Are These People? . . . 200
Workflow: Pulling It All Together . . . 201
The IBM Accelerator for Telecommunications Event Data Analytics . . . 203
Call Detail Record Enrichment . . . 205
Network Quality Monitoring . . . 207
Customer Experience Indicators . . . 207
Wrapping It Up: Accelerating Your Productivity . . . 208
Part VI
Integration and Governance in a Big Data World
10 To Govern or Not to Govern: Governance in a Big Data World . . . 211Why Should Big Data be Governed? . . . 212
Competing on Information and Analytics . . . 214
The Definition of Information Integration and Governance . . . 216
An Information Governance Process . . . 217
The IBM Information Integration and Governance Technology Platform . . . 220
IBM InfoSphere Business Information Exchange . . . 221
IBM InfoSphere Information Server . . . 224
Data Quality . . . 228
Master Data Management . . . 229
Data Lifecycle Management . . . 230
Privacy and Security . . . 232
Wrapping It Up: Trust Is About Turning Big Data into Trusted Information . . . 234
11 Integrating Big Data in the Enterprise . . . 235
Analytic Application Integration . . . 236
IBM Cognos Software . . . 236
IBM Content Analytics with Enterprise Search . . . 237
SPSS . . . 237
SAS . . . 238
Contents xv
Q1 Labs: Security Solutions . . . 238
IBMi2 Intelligence Analysis Platform . . . 239
Platform Symphony MapReduce . . . 239
Component Integration Within the IBM Big Data Platform . . . 240
InfoSphere BigInsights . . . 240
InfoSphere Streams . . . 241
Data Warehouse Solutions . . . 241
The Advanced Text Analytics Toolkit . . . 241
InfoSphere Data Explorer . . . 242
InfoSphere Information Server . . . 242
InfoSphere Master Data Management . . . 243
InfoSphere Guardium . . . 243
InfoSphere Optim . . . 244
WebSphere Front Office . . . 244
WebSphere Decision Server: iLog Rule . . . 245
Rational . . . 245
Data Repository-Level Integration . . . 245
Enterprise Platform Plug-ins . . . 246
Development Tooling . . . 246
Analytics . . . 246
Visualization . . . 246
xvii
FOREWORD
“Big Data” is a curious phrase. Since I first encountered it some three-and-a-half years ago, it has come to be one of the IT industry’s dominant trends, and yet I don’t believe I have come across a single person in that time who will admit to liking the term.
Attend any data management conference or webinar and you’ll hear the same thing: vendors, practitioners, commentators, and analysts describing how unsuitable the term Big Data is, before launching into an explanation of how important Big Data is to their business, or the reverse. Unlike many other industry buzzwords, the origins of Big Data cannot be traced back to a specific vendor or individual. It is not uncommon, therefore, to hear those vendors, practitioners, commentators, and analysts complaining about the lack of definition before introducing their own description of what Big Data means to them.
There is very rarely a significant difference from one definition to the next, however. While the term Big Data might be almost universally unloved, it is also now almost universally understood to refer to the realization of greater business intelligence by storing, processing, and analyzing data that was previously ignored due to the limitations of traditional data management technologies.
Those limitations have come to be defined by a combination of words beginning with the letter “V”: typically volume, variety, and velocity, but with others increasingly added to the mix (more about this in a moment).
The increased use of interactive applications and websites—as well as sen-sors, meters, and other data-generating machines—means that an increasing volume of data is being produced. At the same time, the cost of storage, pro-cessing, and bandwidth has dropped enormously, while network access has increased significantly.
Much of the data that is being produced by these interactive applications and data-generating machines lacks the structure to make it suitable for storage and analysis in traditional relational databases and data warehouses. In addition to this variety, the data is also being produced at a velocity that is often beyond the performance limits of traditional systems.
It is interesting to note that since the first edition of this book, the authors have added a fourth “V”: veracity. This succinctly highlights the fact that tried and tested data management principles—data quality, data cleansing, master data management, and data governance—are not completely redun-dant in a world of Big Data. In fact, they are increasingly being seen as critical factors in the ability of users to ensure they can create another “V”—value— from this increased volume, variety, and velocity of data.
The ongoing importance of existing data management techniques also illustrates another important point about Big Data: that new data manage-ment and analytic technologies are being implemanage-mented to complemanage-ment rather than replace traditional approaches to data management and analytics.
Thus Apache Hadoop does not replace the data warehouse and NoSQL databases do not replace transactional relational databases, while neither MapReduce nor streaming analytics approaches replace existing SQL-based reporting and analytics tools. As stated earlier, Big Data is about adopting new technologies that enable the storage, processing, and analysis of data that was previously ignored.
It is also about the adoption of new business processes and analytics approaches that take advantage of that data. As an industry analyst company focused on innovation and the development and adoption of new technolo-gies, 451 Research has observed that the adoption of nontraditional data management technologies is being driven not just by the volume, variety, velocity, and veracity of data, but also by changes in the manner in which users want to interact with their data.
451 Research uses the term “Total Data” to describe the management approach being embraced by early adopters to process and explore Big Data using the range of new technologies available. “Total Data” is not an alterna-tive to “Big Data.” We believe that if your data is “big,” the way you manage it should be “total.”
Foreword xix
to the increased desire to process and analyze all available data, rather than analyzing a sample of data and extrapolating the results; exploration relates to analytic approaches in which the schema is defined in response to the nature of the query; and frequency refers to the desire to increase the rate of analysis in order to generate more accurate and timely business intelligence.
Since it is important to consider the ongoing importance of existing data management, processing, and analytic approaches, we add a fourth factor: dependency, which relates to the need to balance investment in existing tech-nologies and skills with the adoption of new techniques.
While the authors of this book may not use the term “Total Data,” we see evidence of these four factors influencing the technology and business process choices being made by businesses in the numerous Big Data success stories contained within these pages, as well as the portfolio of technologies being assembled by IBM to address its customers’ Big Data needs.
This brings us back to definitions, and the futility of getting hung up on the meaning of Big Data rather than embracing the associated new data man-agement technologies and approaches. IBM’s research has highlighted that companies that invest in analytics and understanding their business and their customers are significantly more likely to achieve competitive advan-tage over their rivals.
Whatever you might think of the term Big Data, the adoption of new data processing technologies and techniques that complement established analytics approaches promises to deliver new levels of business intelligence, customer service, and revenue opportunities. Many companies are finding that is not something they can afford to ignore.
Matt Aslett
Research Manager, Data Management and Analytics, 451 Research
xxi
PREFACE
Executive Letter from Bob Picciano
When the technology market shifts, big things happen. Opportunities arise and risks are confronted. Organizations and practitioners need to understand and prepare for such change. Part of this process includes being on the look-out for the emerging “factoids” that tell us in advance that we’re approach-ing a shift, lift, rift, or cliff. But even more interestapproach-ing is that emotional sense of promise for what a new space might bring. In our industry, we often see the predictive data, and we’re told about the perils in failing to act. But rarely do we also get that sense of pure excitement about a whole new frontier that is being invented, discovered, forged, and fostered. When both elements are present simultaneously, really interesting things start to happen. Think about it for a moment…when was the last time you had the opportunity to be part of an inflection point? Big Data is one of those rare opportunities.
Studies strongly indicate marked performance differences in those orga-nizations that embrace the opportunities around the broad space of analyt-ics. Our own study, conducted jointly by IBM and MIT, showed that orga-nizations that focus on analytics significantly outperform their segment peers on the key business metrics of growth, earnings, and performance. Consider the emotional side of this. For years, so many of us in the field of analytics and information management have worked to rapidly turn any type of structured or unstructured data into useful insights to differentiate performance. Now, with the emergence of Big Data, for the first time we can really get a sense that the hurdles of volume, variety, velocity, and veracity can be tackled and overcome.
this new challenge as a sideline. Our clients demand a short time to value for their Big Data investments because they seek leadership in their respective marketplaces. One of the most compelling ways to do that is through a plat-form with a maniacal focus on consumability, instantiated by a well thought out and planned tools ecosystem, declarative languages, and techniques that accelerate the ability to quickly drive results. This is exactly what IBM is focusing on and delivering to our clients and partners…today.
Some aspects of the traditional ways in which data is structured and man-aged also apply in the Big Data arena. But new demands will be placed on areas like data governance, the integration of traditional sources, and secu-rity. IBM is focused on delivering in these domain areas, in addition to the mainstream Big Data areas.
IBM has long believed in “workload optimized systems.” You see this manifested today in our IBM PureSystems and IBM PureData Systems fam-ily, which delivers extraordinary economies of scale while reducing labor impact and increasing compute density. The same dynamics are needed in the world of Big Data. There are different tasks to perform, and we have a set of finely tuned, highly consumable engines for them. We have a non-forked version of Hadoop (InfoSphere BigInsights), so the implementation remains pure, with a number of committers contributing assets across the entire Apache Hadoop ecosystem. Looking at our one hundred plus years of his-tory, it’s evident that IBM is also committed to providing the most open sys-tems possible, and it’s key for us to contribute to the Big Data open source movement. Besides Hadoop, IBM’s open source contributions include Apache Derby, Lucene, Jakarta, Geronimo, Eclipse, DRDA, Xerces, parts of Linux, and much more. In fact, many of the open source contributions, along with IBM differentiating technologies, were showcased in unison by the famous Watson win on the popular game show Jeopardy! Quite simply, we believe that strong partnership with the open source community helps the entire domain innovate at a more rapid rate, in service of what our clients need to solve the more challenging business problems that they face.
Preface xxiii
leader in that space; showcased by the family of analytics-based IBM Pure-Data Systems (which incorporate Netezza and DB2 technologies), InfoSphere BigInsights, and more. But the analytics of data in motion will also drive more valuable insight and decision making for front office systems of engagement, where seconds—even micro-seconds—can matter. IBM is perhaps the only innovator combining in-motion and at-rest analytics in one platform.
Finally, organizations seem to really struggle in trying to get their hands around the data assets that they already own, and are often guilty of not knowing what they could already know. Enterprise discovery and search services are needed, and they have to be built from the ground up for Big Data. InfoSphere Data Explorer (technology acquired through IBM’s Vivisi-mo acquisition) has specialized indexing techniques and social algorithms that provide exactly this.
Big Data is flowing like an enormous river, a huge, nearly untapped, resource. What are you doing to tap that stream and make Big Data work for you? You have to decide how you will improve your skills, capabilities, and involvement to take advantage of all that Big Data has to offer. This book is an excellent way to start your journey.
I would like to thank Paul, Dirk, Krishnan, Tom, David, and James for writing this book. They are an outstanding group whose dedication to our clients and to their fellow IBMers is unmatched. Behind them is a large eco-system of IBMers that make the IBM Big Data platform possible. It’s a privi-lege, not a right, to work with good people. The team behind the IBM Big Data platform is an outstanding group of people who are passionate about our customers’ success, dedicated to their work, and continually innovate. Thank you, and enjoy the book.
Bob Picciano
xxv
ACKNOWLEDGMENTS
Collectively, we want to thank the following people, without whom this book would not have been possible: John Choi, Nancy Kopp, Phil Francisco, Shivakumar (Shiv) Vaithyanathan, Roger Rea, Robert Uleman, Tina Chen, Bert Van der Linden, Hui Liao, Klaus Roder, Kevin Foster, Nagui Halim, Cindy Saracco, Vijay R. Bommireddipalli, Tony Curcio, Mike Spicer, Mike Koranda, Stewart Tate, Gary Robinson, Kayla Martell, Bill O’Connell, Anshul Dawra, Andrey Balmin, Manny Corniel, our Research and Development teams, and all the others in our business who make personal sacrifices day in and day out to bring you the IBM Big Data platform. We also want to thank Dan Wolfson, Jeff Pollock, Rick Clements, Paula Sigmon, Aarti Borkar, and the entire InfoSphere Information Integration and Governance team for their help as well.
Tracey Mustacchio, Jerome Pesenti, and Mark Myers joined IBM as part of the Vivisimo acquisition and helped us with this information—welcome and thanks! There’s a special team of Big Data superstars at our disposal, we use and abuse them, and they seem to love it. So we wanted to thank Stephen Brodsky, Anjul Bhambhri, Shankar Venkataraman, and Rafael Coss too.
Jeff Jonas deserves a special thanks for his puzzle inspiration; if you ever get a chance to see this guy speak, don’t miss it: you’ll be wildly entertained and begin to think differently about certain things—albeit not just technology.
A special thanks to Linda Snow and Lauri Saft, for their passion and for being our pro-bono (we forgot to tell them that ahead of time) side-reviewers. We also want to specifically thank Chris Eaton, Steven Sit, and George Lapis for working with some of us on the last book; some of that effort can be found in this one.
xxvii
ABOUT THIS BOOK
This book provides an overview of the IBM Information Management Big Data platform. It’s intended for a broad audience, ranging from those who are brand new to Big Data, to those on the business and management side, to architects, and to developers who want a glimpse into the technical details that underpin this platform. That said, we couldn’t cover everything in this book. Harness the Power of Big Data: The IBM Big Data Platform is meant to be a jumping-off point, igniting a desire to explore more of this platform and leave you with a strong understanding of what makes it so different. You don’t have to read this book from front to back, because it’s organized into six parts that enable you to jump into the specific topics in which you’re inter-ested. That said, we do reference other parts of the book, so you will benefit the most if you read it from front to back.
The chapters in Part I, “The Big Deal About Big Data,” show you how to identify and define what Big Data is (Chapter 1), apply usage patterns to business scenarios to avoid the doomsday Big Data “science project” (Chapter 2), and articulate the key components that make up the IBM Big Data platform (Chapter 3). Having a strong understanding of the IBM Big Data platform capabilities gives you some insight into how and why we built it the way we did (integrated, governed, well tooled, accelerated, con-sumable, and capable). That said, even if you don’t make IBM a partner on your Big Data journey, you’re going to discover the right questions to ask whatever partner you choose. (We think when you ask these question to other vendors, you’ll start to really appreciate what IBM has to offer in this space.) Unfortunately, some folks believe that Big Data is just Hadoop; after reading Chapter 3, we think that you’ll be able to articulate why Hadoop is critical to a Big Data platform, but only as part of a much broader ecosystem that includes many Big Data capabilities, such as analytics, visualization, search, and more.
PureData System for Analytics (formerly known as Netezza) and some light references to the IBM PureData System for Operational Analytics (formerly known as the IBM Smart Analytics System). The family of IBM PureData Systems represents the culmination of years of learned expertise and deploy-ment patterns, packaged together as an expertly integrated system with an optimized and balanced runtime engine for any Big Data tasks at hand. Chapter 5 describes Hadoop. You’ll learn about IBM’s commitment to Hadoop, IBM’s Hadoop distribution (called IBM InfoSphere BigInsights), enterprise hardening features that IBM delivers for Hadoop (some of which can be run on Cloudera’s Hadoop distribution), and more.
“Analytics for Big Data in Motion” is the title of Part III, and it’s an area in which IBM has differentiated itself from any other vendor in the market-place. In fact, few Big Data vendors even talk about it. IBM is well travelled in this area, with a high-velocity Big Data engine, called InfoSphere Streams, which we cover in Chapter 6. We show you how it integrates with at-rest repositories, enabling you to move harvested at-rest analytic artifacts from the interior of the business to the frontier, thereby transforming your analysis from a forecast model to a nowcast model.
Part IV, “Unlocking Big Data,” details the components of the IBM Big Data platform that come from the Vivisimo acquisition earlier in 2012. InfoSphere Data Discovery (Data Discovery) is the IBM name for this suite of technolo-gies that includes industry-leading enterprise search, security consider-ations, a front-end tooling framework for customization of personalized push/pull search, and more. Data Discovery presents an interesting oppor-tunity for many companies to get started with Big Data; after all, shouldn’t you have a crisp understanding of what Big Data assets you already have before starting a new Big Data project? The Vivisimo technology literally took the enterprise landscape by storm with its uncanny ability to find data assets of different variety, size, and shape. We talk about this technology in Chapter 7, as well as highlighting a number of very compelling client success stories. After reading this chapter, we think you’ll agree that the word
Vivisimo! could replace Eureka! (for “I found it!”).
About This Book xxix
platform comes with a rich set of toolkits and accelerators for text analytics and machine learning (among others), a vast array of samples, enriched tool-ing environments, and declarative languages that are purpose-built and optimized for specific Big Data tasks at hand. Collectively, these efforts flatten the time to analytics, enabling our clients to monetize their data with unprecedented speed and agility—showcasing some of these IBM Big Data platform characteristics is the focus of Part V.
Chapter 8 provides details about the Advanced Text Analytics Toolkit. Text analytics requires a different set of optimization choices than a Big Data workload that crunches through millions of files. In the Hadoop benchmark world, you see many references to grep or terasort, which stress the I/O characteristics of the cluster. However, text analytics is heavily dependent on CPU. The IBM Big Data platform has a declarative language called Annotated Query Language (AQL), which is part of this toolkit. Writing AQL programs is facilitated by an Eclipse plug-in that provides design-time assistance, context-sensitive help, and other rapid application development features that are associated with a typical IDE. The toolkit includes a cost-based optimizer that understands the resource requirements of text analysis and optimizes the execution plan with this consideration (IBM, the company that invented SQL and its associated cost-based optimization processing engines is doing the same for AQL).
You’ll build your analytical text-based Big Data applications 50 percent faster than using alternative approaches, they will run up to ten times faster (that’s what we found when we compared it to some alternatives), and the results you get will be more precise and complete (read Chapter 8 for more details).
Chapter 9 describes the three accelerators that IBM has delivered for specific Big Data usage patterns: machine data, social media, and call detail records (CDRs). These accelerators reflect years of client interaction and are packaged together for quick deployment. What’s more, they showcase the component integration of the IBM Big Data platform, combining text analytics, Streams, and BigInsights.
The book finishes with Part VI, “Integration and Governance in a Big Data World.” What’s true in the relational world applies to the Big Data world as well. Chapter 10 provides a brief overview of Big Data governance, from reducing the surface area security profile of data at rest, to archiving, to
trusting the lineage of that data, and more. Chapter 11 highlights the various integration components within the IBM Big Data platform itself, and across other IBM and non-IBM products.
1
Part I
3
1
What Is Big Data?
The term Big Data
is a bit of a misnomer. Truth be told, we’re not even big fans of the term—despite the fact that it’s so prominently displayed on the cover of this book—because it implies that other data is somehow small (it might be) or that this particular type of data is large in size (it can be, but doesn’t have to be). For this reason, we think it’s best to devote an entire chapter to the task of explaining exactly what Big Data is.Why Is Big Data Important?
Before you try to understand what Big Data is, you should know why Big Data matters to business. In a nutshell, the quest for Big Data is directly attributable to analytics, which has evolved from being a business initiative to a business imperative.
In fact, we’d say that analytics has caused a bifurcation of industry partici-pants: some are leaders and some are followers. It’s hard to overlook the impact that analytics has had on organizations during the last decade or so. IBM’s Institute of Business Value, in partnership with MIT’s Sloan Management Review, published the results of a study in a paper called The New Intelligent Enterprise.
Big Data is all about better analytics on a broader spectrum of data, and therefore represents an opportunity to create even more differentiation among industry peers. This is a key point that’s often overlooked: no one has ever delivered a single penny of value out of storing data. Many vendors are talking about Big Data, but we’re not seeing much more than the ability to store large volumes of data, leaving the organization to “roll their own” applications without much help to make sense of it all. Real value can only emerge from a consumable analytics platform that saves you from having to build applications from scratch—one that effectively flattens the time-to- insight curve. Big Data is truly all about analytics.
The joint IBM/MIT study described in The New Intelligent Enterprise also found that the number of enterprises using analytics in an attempt to create a competitive advantage had jumped by almost 60 percent since its previous iteration, which was conducted one year earlier. The study concludes with the observation that nearly six out of ten organizations are now differentiat-ing through analytics.
Quite simply, early analytics adopters are extending their leadership. If you want to lead, you have to know analytics, and if you want to be on the forefront of analytics, you have to put your arms around Big Data.
Now, the “What Is Big Data?” Part
A number of years ago, IBM introduced its Smarter Planet campaign (“Instru-mented, Interconnected, and Intelligent”), which foreshadowed the Big Data craze that hit the IT landscape just a few short years later.
What Is Big Data? 5
In 2005, there were an estimated 1.3 billion RFID tags in circulation; by the end of 2011, this number had risen to 30 billion! Now consider that RFID price points are expected to drop below 1 US cent by 2015, and that there are all kinds of other sensory and measurement technologies already available; in fact, we’d argue at this point, the world can pretty much measure almost anything it wants.
From an instrumentation perspective, what doesn’t have some amount of coding in it today? Just look at your car: you can’t diagnose a problem these days without hooking a computer up to it. Today’s hardware network switches have more software code than components in them. The latest passenger air-planes are instrumented with over one billion lines of code that generates about 10 terabytes (TB) of data, per engine, during every half hour of opera-tion. Let’s put that in perspective: A single flight from London’s Heathrow Airport to John F. Kennedy in New York would generate about 650TB of data! That’s likely more data than what you have sitting in your warehouse today. Most of this data is likely never looked at, unless disaster strikes. Imagine the efficiencies, potential disaster prevention, insights, and other optimization opportunities if all of the data were cost-effectively analyzed.
Today, many utilities are moving to smart meters and grids as part of long-range plans to ensure a reliable energy supply, incorporate distributed genera-tion resources, and enable customers to have more control over their energy use. Many are deploying smart meter systems as a first step, which presents an immediate technical challenge: Going from one meter reading a month to smart meter readings every 15 minutes works out to 96 million reads per day for every million meters: a 3,000-fold increase in data collection rates! As you can imagine, such rates could be crippling if not properly managed.
There’s an upside, of course. The additional data opens up new opportu-nities, enabling energy companies to do things they never could do before. Data gathered from smart meters can provide a better understanding of cus-tomer segmentation and behavior, and of how pricing influences usage—but only if companies have the ability to use such data. For example, time-of-use pricing encourages cost-savvy energy consumers to run their laundry facili-ties, air conditioners, and dishwashers at off-peak times. But the opportuni-ties don’t end there. With the additional information that’s available from smart meters and smart grids, it’s possible to transform and dramatically improve the efficiency of electrical generation and scheduling.
Smart meters are smart because they can communicate, not only with the consumer about electricity usage and pricing, but also with the utility pro-vider about fluctuations in power or the precise location of outages. Smart meters are generating a wealth of new information that’s fundamentally changing the way that utility companies interact with their customers.
What about the advent of the prosumer, a new consumer class that’s also a producer. Prosumers generate power through solar panels and sell it back to the grid; this too has ripple effects across the supply chain. Using predictive analytics on their data, companies can make a wide range of forecasts, such as excess energy calculations with sell and transmittal considerations, typical fail-ure points and grid downtime locations, and which clients are likely to feed energy back to the grid and when they are likely to do so.
What Is Big Data? 7
how loud the packaging was. Customers created thousands of YouTube videos showing how noisy the environmentally friendly bag was. A “Sorry, but I can’t hear you over this SunChips bag” Facebook page had over 50,000 likes, and bloggers let their feelings be known. In the end, Frito-Lay introduced a new qui-eter SunChips bag, demonstrating the power and importance of social media.
For a number of years, Facebook was adding a new user every three seconds; today these users collectively generate double-digit terabytes of data every day. In fact, in a typical day, Facebook experiences over 2.5 billion likes and 300 million photo uploads. The format of a Facebook post is indeed struc-tured data; it’s marked up in the JavaScript Object Notation (JSON) format:
{ "data": [
{ "id": "53423432999_23423423_19898799",
"from": { "name": "Paul Zikopoulos", "id": "Z12" },
"message": "Thinking of surprising my wife with a quality time gift that lets her know she's special, any ideas? I thought about taking her to the driving range, perhaps play a round and caddie my game.",
"created_time": "2012-08-02T21:27:44+0000", "likes: 5,"
"comments": { "data": [ { "id": 2847923942_723423423", "from": { "name": "MaryAnne Infanti", "id": "948574763" },
"message": "Paul! Purses and gold! Costco’s got a great Kate Spade purse on sale this week that says I love you without having to lift a pen. If you go with your idea, the only thing driving will be you: alone! ", "created_time 2012-00-02T11:27:44+0000", "likes: 64 } }
Although there is no doubt that this Facebook posting is structured, it’s the unstructured part that has even more potential value; it holds the intent of a bad plan and commentary that strongly suggests what a better plan might be. The structured data is easy to store and analyze; however, analyzing its unstructured components for intent, sentiment, and so on is veryhard, but it’s got the potential to be very rewarding, if…
the employer (imagine your own name the subject of a court case). This case is before the courts today and will certainly set a precedent, but it illustrates that there is at least perceived, if not factual, value (we think it’s the latter) embodied within the Twitter ecosystem.
Most of today’s collected data is also temporally and spatially enriched. For example, we know where one of the stars of the television show Myth Busters lives—not because he told us, but because he tweeted a picture of his car with location-based services (LBS) enabled on his smart device and ended up sharing his home’s geographic (LAT/LONG) coordinates with over 650,000 of his closest friends! Most people don’t know what LBS is, but they have it turned on because they’re using some mobile mapping application. These days, folks just let you know when they’ve checked in at the gym or what restaurant they’re in through social apps that just convert geographic coordinates into easily identifiable places. Such data often has built-in loca-tion awareness, which represents another tremendous opportunity for finer granularities of personalization or profiled risk assessment, if… Today, a number of major credit card companies have programs based on this approach that you can join; for example, if you purchase a coffee using your credit card, they will profile your location (via LBS), your purchase history, and make an offer that is tailored to you from a retailer in the proximity of your current location.
What Is Big Data? 9
Brought to You by the Letter V:
How We Define Big Data
To keep things simple, we typically define Big Data using four Vs; namely,
volume, variety, velocity, and veracity. We added the veracity characteristic recently in response to the quality and source issues our clients began facing with their Big Data initiatives. Some analysts include other V-based descriptors, such as variability and visibility, but we’ll leave those out of this discussion.
No Question About It: Data Volumes Are on the Rise
Volume is the obvious Big Data trait. At the start of this chapter we rhymed off all kinds of voluminous statistics that do two things: go out of date the moment they are quoted and grow bigger! We can all relate to the cost of home storage; we can remember geeking out and bragging to our friends about our new 1TB drive we bought for $500; it’s now about $60; in a couple of years, a consumer version will fit on your fingernail.
The thing about Big Data and data volumes is that the language has changed. Aggregation that used to be measured in petabytes (PB) is now referenced by a term that sounds as if it’s from a Star Wars movie: zettabytes
(ZB). A zettabyte is a trillion gigabytes (GB), or a billion terabytes!
Since we’ve already given you some great examples of the volume of data in the previous section, we’ll keep this section short and conclude by refer-encing the world’s aggregate digital data growth rate. In 2009, the world had about 0.8ZB of data; in 2010, we crossed the 1ZB marker, and at the end of 2011 that number was estimated to be 1.8ZB (we think 80 percent is quite the significant growth rate). Six or seven years from now, the number is esti-mated (and note that any future estimates in this book are out of date the moment we saved the draft, and on the low side for that matter) to be around 35ZB, equivalent to about four trillion 8GB iPods! That number is astonish-ing considerastonish-ing it’s a low-sided estimate. Just as astoundastonish-ing are the chal-lenges and opportunities that are associated with this amount of data.
Variety Is the Spice of Life
The variety characteristic of Big Data is really about trying to capture all of the data that pertains to our decision-making process. Making sense out of unstructured data, such as opinion and intent musings on Facebook, or analyz-ing images, isn’t somethanalyz-ing that comes naturally for computers. However, this
kind of data complements the data that we use to drive decisions today. Most of the data out there is semistructured or unstructured. (To clarify, all data has some structure; when we refer to unstructured data, we are referring to the sub-components that don’t have structure, such as the freeform text in a comments field or the image in an auto-dated picture.)
Consider a customer call center; imagine being able to detect the change in tone of a frustrated client who raises his voice to say, “This is the third outage I’ve had in one week!” A Big Data solution would not only identify the terms “third” and “outage” as negative polarity trending to consumer vulnerability, but also the tonal change as another indicator that a customer churn incident is trending to happen. All of this insight can be gleaned from unstructured data. Now combine this unstructured data with the customer’s record data and transaction history (the structured data with which we’re familiar), and you’ve got a very personalized model of this consumer: his value, how brittle he’s become as your customer, and much more. (You could start this usage pattern by attempting to analyze recorded calls not in real time, and mature the solution over time to one that analyzes the spoken word in real time.)
An IBM business partner, TerraEchos, has developed one of the most sophisticated sound classification systems in the world. This system is used for real-time perimeter security control; a thousand sensors are buried under-ground to collect and classify detected sounds so that appropriate action can be taken (dispatch personnel, dispatch aerial surveillance, and so on) depend-ing on the classification. Consider the problem of securdepend-ing the perimeter of a nuclear reactor that’s surrounded by parkland. The TerraEchos system can near-instantaneously differentiate the whisper of the wind from a human voice, or the sound of a human footstep from the sound of a running deer. In fact, if a tree were to fall in one of its protected forests, TerraEchos can affirm that it makes a sound even if no one is around to hear it. Sound classification is a great example of the variety characteristic of Big Data.
How Fast Can You Analyze? The Velocity of Your Data
What Is Big Data? 11
Think about it for a moment. The opportunity cost clock on your data starts ticking the moment the data hits the wire. As organizations, we’re tak-ing far too long to spot trends or pick up valuable insights. It doesn’t matter what industry you’re in; being able to more swiftly understand and respond to data signals puts you in a position of power. Whether you’re trying to understand the health of a traffic system, the health of a patient, or the health of a loan portfolio, reacting faster gives you an advantage. Velocity is per-haps one of the most overlooked areas in the Big Data craze, and one in which we believe that IBM is unequalled in the capabilities and sophistica-tion that it provides.
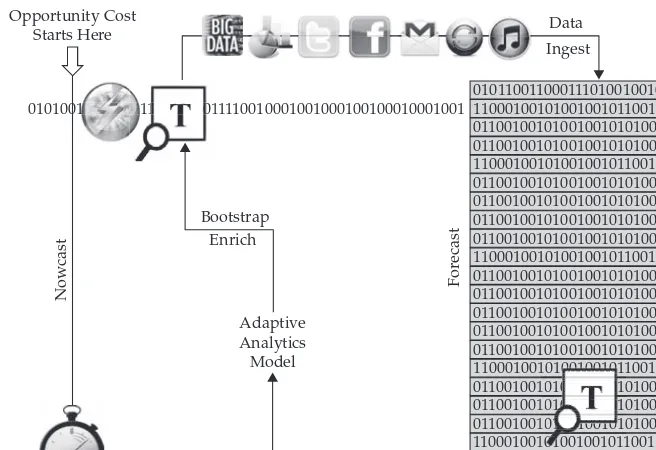
In the Big Data craze that has taken the marketplace by storm, everyone is fixated on at-rest analytics, using optimized engines such the Netezza technology behind the IBM PureData System for Analytics or Hadoop to perform analysis that was never before possible, at least not at such a large scale. Although this is vitally important, we must nevertheless ask: “How do you analyze data in motion?” This capability has the potential to provide businesses with the highest level of differentiation, yet it seems to be somewhat overlooked. The IBM InfoSphere Streams (Streams) part of the IBM Big Data platform provides a real-time streaming data analytics engine. Streams is a platform that provides fast, flexible, and scalable processing of continuous streams of time-sequenced data packets. We’ll delve into the details and capabilities of Streams in Part III, “Analytics for Big Data in Motion.”
quickly, and analyze it to identify emerging signatures and patterns on the network packets as they flow across the network infrastructure.
Finally, from a governance perspective, consider the added benefit of a Big Data analytics velocity engine: If you have a powerful analytics engine that can apply very complex analytics to data as it flows across the wire, and you can glean insight from that data without having to store it, you might not have to subject this data to retention policies, and that can result in huge sav-ings for your IT department.
Today’s CEP solutions are targeted to approximately tens of thousands of messages/second at best, with seconds-to-minutes latency. Moreover, the analytics are mostly rules-based and applicable only to traditional data types (as opposed to the TerraEchos example earlier). Don’t get us wrong; CEP has its place, but it has fundamentally different design points. CEP is a non-programmer-oriented solution for the application of simple rules to discrete, “complex” events.
Note that not a lot of people are talking about Big Data velocity, because there aren’t a lot of vendors that can do it, let alone integrate at-rest technolo-gies with velocity to deliver economies of scale for an enterprise’s current investment. Take a moment to consider the competitive advantage that your company would have with an in-motion, at-rest Big Data analytics platform, by looking at Figure 1-1 (the IBM Big Data platform is covered in detail in Chapter 3).
What Is Big Data? 13
vendors’ Big Data talk ends. The truth is that many vendors can’t help you build the analytics; they can only help you to execute it. This is a key differentiator that you’ll find in the IBM Big Data platform. Imagine being able to seamlessly move the analytic artifacts that you harvest at rest and apply that insight to the data as it happens in motion (the T box by the lightning bolt on the left). This changes the game. It makes the analytic model adaptive, a living and breathing entity that gets smarter day by day and applies learned intelligence to the data as it hits your organization’s doorstep. This model is cyclical, and we often refer to this as adaptive analytics because of the real-time and closed-loop mechanism of this architecture.
The ability to have seamless analytics for both at-rest and in-motion data moves you from the forecast model that’s so tightly aligned with traditional warehousing (on the right) and energizes the business with a nowcast model. The whole point is getting the insight you learn at rest to the frontier of the business so it can be optimized and understood as it happens. Ironically, the more times the enterprise goes through this adaptive analytics cycle,
the more intelligent it becomes. If you’re familiar with control systems or control theory, which adapt based on observations, it’s a similar kind of loop-ing process. As a simple analogy, think about how much easier it is to finish a puzzle when it’s almost done, or even when you have the outside framed. In an RTAP system, the more pieces you identify and bring to the frontier of the business, the more complete a picture you have of the topic of interest, and you have it earlier in the cycle.
Data Here, Data There,
Data, Data Everywhere: The Veracity of Data
Veracity is a term that’s being used more and more to describe Big Data; it refers to the quality or trustworthiness of the data. Tools that help handle Big Data’s veracity transform the data into trustworthy insights and discard noise.
Collectively, a Big Data platform gives businesses the opportunity to ana-lyze all of the data (whole population analytics), and to gain a better under-standing of your business, your customers, the marketplace, and so on. This opportunity leads to the Big Data conundrum: although the economics of deletion have caused a massive spike in the data that’s available to an orga-nization, the percentage of the data that an enterprise can understand is on the decline. A further complication is that the data that the enterprise is try-ing to understand is saturated with both useful signals and lots of noise (data that can’t be trusted, or isn’t useful to the business problem at hand), as shown in Figure 1-2.
We all have firsthand experience with this; Twitter is full of examples of spambots and directed tweets, which is untrustworthy data. The
Figure 1-2 As the amount of data that is available to an organization increases, the
What Is Big Data? 15
2012 presidential election in Mexico turned into a Twitter veracity example with fake accounts, which polluted political discussion, introduced de-rogatory hash tags, and more. Spam is nothing new to folks in IT, but you need to be aware that in the Big Data world, there is also Big Spam poten-tial, and you need a way to sift through it and figure out what data can and can’t be trusted. Of course, there are words that need to be understood in context, jargon, and more (we cover this in Chapter 8).
As previously noted, embedded within all of this noise are useful signals: the person who professes a profound disdain for her current smartphone manufacturer and starts a soliloquy about the need for a new one is express-ing monetizable intent. Big Data is so vast that quality issues are a reality, and veracity is what we generally use to refer to this problem domain. The fact that one in three business leaders don’t trust the information that they use to make decisions is a strong indicator that a good Big Data platform needs to address veracity.
What About My Data Warehouse
in a Big Data World?
skills, APIs, and assets across the platform so that the analytics can be applied to an engine that’s optimized for the data at hand. For example, the IBM Big Data platform lets you take text analytics that are built via its Annotated Query Language (AQL) and seamlessly deploy them from an at-rest Ha-doop engine into its Streams Big Data velocity engine. Most of the MapRe-duce programs that you code in Hadoop can be run in the IBM PureData System for Analytics; the SQL reports that you generate on IBM pureSys-tems for Operational Analytics (formerly known as the IBM Smart Analytics System) can pretty much be deployed without change on DB2 for z/OS.
When you consider where data should be stored, it’s best to first under-stand how data is stored today and what features characterize your persis-tence options. Data that’s stored in a traditional data warehouse goes through a lot of processing before making it into the warehouse. The data is expected to be of high quality once it lands in the warehouse, and so it’s cleaned up through enrichment, matching, glossaries, metadata, master data manage-ment, modeling, and other quality services that are attached to the data before
it’s ready for analysis. Obviously, this can be an expensive process, and the data that lands in a warehouse is viewed as having both high value and broad purpose: it’s going places and will appear in reports and dashboards where accuracy is key.
In contrast, data in some of the newer Big Data repositories rarely under-goes (at least initially) such rigorous preprocessing because that would be cost-prohibitive, and the work in these repositories is subject to more discov-ery than known value. What’s more, each repository has different character-istics with different tradeoffs. One might prioritize on the application of ACID (atomicity, consistency, isolation, and durability) properties, and another might operate in a relaxed consistency state where the BASE properties (basically available, soft state, and eventually consistent) can be tolerated.
What Is Big Data? 17
gold becomes too much of a gambling game. Sure, history has its gold rush fever stories, but nobody ever mobilized millions of people to dig everywhere and anywhere; that would be too expensive. Today’s miners work differently. Gold mining leverages massive capital equipment that can process millions of tons of dirt (low value-per-byte data) to find nearly invisible strands of gold (ore grades of 30 ppm are usually needed before gold is visible to the naked eye). In other words, there’s a great deal of gold (high value-per-byte data) in all of this dirt (low value-per-byte data), and with the right equip-ment, you can economically process lots of dirt and keep the flakes of gold that you find. The flakes of gold are taken for processing (perhaps to your data warehouse or another insight engine) and combined to make a bar of gold, which is stored and logged in a place that’s safe, governed, valued, and trusted. The gold industry is working on chemical washes that aim to reveal even finer granularizations of gold to find more value out of previously extracted dirt (now think data). We think this analogy fits well into our Big Data story because we’re willing to bet that if you had a corpus composed of ten years of your transaction data, new analytic approaches will let you extract more insight out of it three years from now than you can with today’s technology.
In addition, if you look at the access patterns that characterize a data ware-house and a Hadoop repository, one differentiator you’ll find is that a data warehouse is often characterized by response times that allow you to work with the system interactively. Indeed, terms such as “speed-of-thought response times” aren’t the descriptors you’re going to find associated with a batch system, which is what Hadoop is, for now.
A Big Data platform lets you store all of the data in its native business object format and get value out of it through mass parallelism on commodity components. For your interactive navigational needs, you’ll continue to pick and choose sources, cleanse that data, and keep it in warehouses. But you can get more value out of having a large amount of lower-fidelity data by pulling in what might seem to be unrelated information to form a more robust pic-ture. In other words, data might sit in Hadoop for a while, and when its value becomes proven and sustainable, it can be migrated to the warehouse.