19
Since the late 1940s, linear programming models have been used for many different purposes. Airline companies apply these models to optimise their use of planes and staff. NASA has been using them for many years to optimize their use of limited resources. Oil companies use them to optimise their refinery operations. Small and medium-sized businesses use linear programming to solve a huge variety of problems, often involving resource allocation.
In this paper, a typical product-mix problem in a manufacturing system producing two products (each product consists of two sub-assemblies) is solved for its optimal solution through the use of the latest versions of MATLAB having the command simlp, which is very much like linprog. As analysts, we try to find a good enough solution for the decision maker to make a final decision. Our attempt is to give the mathematical description of the product-mix optimization problem and bring the problem into a form ready to call MATLAB’s simlp command. The objective of this paper is to find the best product mix that maximizes profit. The graph obtained using MATLAB commands, give the shaded area enclosed by the constraints called the feasible region, which is the set of points satisfying all the constraints. To find the optimal solution we look at the lines of equal profit to find the corner of the feasible region which yield the highest profit. This corner can be found out at the farthest line of equal profit which still touches the feasible region.
Keywords: Constraints, Decision variables, Duality, Feasible region, Optimization and Operating expenses
1. INTRODUCTION
One of the most widespread commercial applications of scientific computation is linear programming. It is widely used for allocating resources to achieve an objective. Here,
20
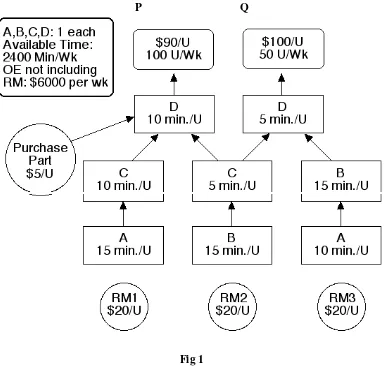
in this paper the product-mix problem illustrated as a prototype example [1] refers to a manufacturing system which may occur in real life applications is being solved through MATLAB. The figure 1 represents a manufacturing system producing two products labeled P and Q. The rounded rectangles at the top of the figure indicate the revenue per unit and the maximum sales per week. For instance we can sell as many as 100 units of P for $90 per unit. The circles show the raw materials used, and the rectangles indicate the operations that the products must pass through in the manufacturing process. Each rectangle designates a machine used for the operation and the time required.
For example product P consists of two subassemblies. RM stands for raw material .To manufacture the first subassembly, one unit of RM1 passes through machine A for 15 minutes. The output of machine A is moved to machine C where it is processed for 10 minutes. The second subassembly starts with RM2 processed in machine B for 15 minutes. The output is taken to machine C for 5 minutes of processing. The two subassemblies are joined with a purchased part in machine D. The result is a finished unit of P. Product Q is manufactured by a similar process as indicated in the figure1.
P Q
21
The rectangle at the upper left indicates that one machine of each type is available. Each machine operates for 2400 minutes per week. OE stands for operating expenses. For this case the operating expenses, not including the raw material cost is $6000. This amount is expended
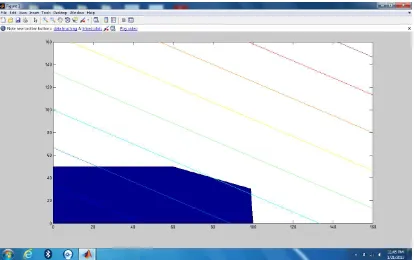
The shaded area enclosed by the constraints is called the feasible region, which is the set of points satisfying all the constraints. If this region is empty, then the problem is said to be infeasible, and it has no solution. The lines of equal profit Z are given by Z = 45x + 60y. If we fix Z to, say 100, then all points (x; y) which satisfy 45x + 60y yield the same profit 100.
hold on;
[u v]=meshgrid(0:160,0:160);
contour(u,v,45*u+60*v);
hold off;
22
Fig 2
3.1 THE COMMAND simlp
The command simlp from the optimization toolbox implements the simplex algorithm to solve a linear programming problem in the form
min f * x x
subject to A * x b
where f is any vector and the matrix A and vector b define the linear constraints. So our original problem is translated into the format
max 45x + 60y min – 45x – 60y
x,y x,y
subject to subject to
15x +10y 2400 15 10 2400
15x+ 30y 2400 15 30 2400
15x + 5y 2400 15 5 x 2400
10x + 5y 2400 10 5 2400
x 100 1 0 y 100
y 50 0 1 50
x 0 -1 0 0
23
Observe the switching of signs to turn the max into a min and to deal with the constraints. Duality in linear programming is a very important concept, more than just a matter of formatting. The economical interpretation of duality can be simplified into the saying that minimizing the cost of production is equivalent to maximizing the profit.
24
4. CONCLUSION
The objective of this research work in finding the maximum units of products for product mix problem is achieved. The final result as derived using MATLAB are as follows: The values obtained are X = 100 units and Y= 30 units which mean that for the product mix to optimize profits the manufacturer should produce 100 units of P products per week and 30 units of Q products per week. The net profit would be equal to maximum revenue, Z minus total operating expenses, OE which comes out to be $300 per week. The extensions of this research work would be to identify bottlenecks and sensitivity analysis using Fuzzy Algorithm which allows us to determine how “sensitive” the optimal solution is to changes in data values. This includes analyzing changes in:
i) An Objective Function Coefficient (OFC) ii) A Right Hand Side (RHS) value of a constraint.
REFERENCES
[1] Operations Research Models and Methods by Paul A Jensen
[2] B.R Hunt, R.L Lipsman and J.M. Rosenberg. A Guide to MATLAB, for beginners and experienced users, Cambridge University Press, 2001
[3] Varun Shukla, Anand Handa and Arun Agarwal, “Spectrum Analysis by using MATLAB Script” International journal of Electronics and Communication Engineering & Technology (IJECET), Volume 3, Issue 1, 2012, pp. 69 - 75, ISSN Print: 0976- 6464, ISSN Online: 0976 –6472.